
 Login Sign Up


| |||||
 |  | ||||

| 12Stocks.com Market Intelligence |
Best SmallCap Stocks
|
| In a hurry? Small Cap Stock Lists: Performance Trends Table, Stock Charts
Sort Small Cap stocks: Daily, Weekly, Year-to-Date, Market Cap & Trends. Filter Small Cap stocks list by sector: Show all, Tech, Finance, Energy, Staples, Retail, Industrial, Materials, Utilities and HealthCare Filter Small Cap stocks list by size: All Large Medium Small and MicroCap |
| 12Stocks.com Small Cap Stocks Performances & Trends Daily | |||||||||
|
|  The overall Smart Investing & Trading Score is 69 (0-bearish to 100-bullish) which puts Small Cap index in short term neutral to bullish trend. The Smart Investing & Trading Score from previous trading session is 49 and hence an improvement of trend.
| ||||||||
Here are the Smart Investing & Trading Scores of the most requested small cap stocks at 12Stocks.com (click stock name for detailed review):
|


| 12Stocks.com: Investing in Smallcap Index with Stocks | |
|
The following table helps investors and traders sort through current performance and trends (as measured by Smart Investing & Trading Score) of various
stocks in the Smallcap Index. Quick View: Move mouse or cursor over stock symbol (ticker) to view short-term technical chart and over stock name to view long term chart. Click on  to add stock symbol to your watchlist and to add stock symbol to your watchlist and  to view watchlist. Click on any ticker or stock name for detailed market intelligence report for that stock. to view watchlist. Click on any ticker or stock name for detailed market intelligence report for that stock. |
12Stocks.com Performance of Stocks in Smallcap Index
| Ticker | Stock Name | Watchlist | Category | Recent Price | Smart Investing & Trading Score | Change % | Weekly Change% |
| HSTM | HealthStream |   | Technology | 27.03 | 69 | 0.07% | 5.54% |
| DDD | 3D Systems | | Technology | 3.62 | 59 | 1.97% | 5.54% |
| ANF | Abercrombie & Fitch Co | | Services & Goods | 128.76 | 90 | 3.09% | 5.47% |
| NRDS | NerdWallet | | Financials | 13.61 | 42 | 2.99% | 5.47% |
| UTL | Unitil | | Utilities | 52.63 | 100 | 0.48% | 5.39% |
| PATK | Patrick Industries | | Industrials | 111.13 | 64 | 0.72% | 5.35% |
| MATW | Matthews | | Services & Goods | 28.59 | 74 | 5.42% | 5.30% |
| PLOW | Douglas Dynamics | | Consumer Staples | 23.54 | 74 | 0.90% | 5.18% |
| IHRT | iHeartMedia | | Services & Goods | 2.25 | 74 | 0.90% | 5.14% |
| CAC | Camden National | | Financials | 32.03 | 95 | -0.31% | 5.02% |
| AZZ | AZZ | | Industrials | 75.02 | 63 | 1.08% | 4.94% |
| FBP | First Ban | | Financials | 18.08 | 100 | 0.61% | 4.87% |
| SAVE | Spirit Airlines | | Transports | 3.71 | 52 | 0.82% | 4.80% |
| AMTB | Amerant Bancorp | | Financials | 22.61 | 100 | -0.13% | 4.77% |
| NXRT | NexPoint Residential | | Financials | 34.85 | 100 | 1.69% | 4.75% |
| UNFI | United Natural | | Consumer Staples | 9.56 | 59 | 1.59% | 4.71% |
| OFIX | Orthofix Medical | | Health Care | 13.60 | 100 | 2.72% | 4.70% |
| GRND | Grindr | | Technology | 10.35 | 90 | 1.17% | 4.65% |
| CVGW | Calavo Growers | | Consumer Staples | 28.28 | 64 | -2.18% | 4.62% |
| USPH | U.S. Physical | | Health Care | 105.20 | 74 | 1.51% | 4.56% |
| PIPR | Piper Sandler | | Financials | 206.14 | 100 | 1.47% | 4.55% |
| CRNC | Cerence | | Technology | 10.15 | 42 | 4.21% | 4.53% |
| SLP | Simulations Plus | | Technology | 46.70 | 93 | -0.04% | 4.50% |
| NMIH | NMI | | Financials | 32.51 | 95 | 0.12% | 4.50% |
| PPBI | Pacific Premier | | Financials | 22.95 | 87 | 0.83% | 4.41% |
| For chart view version of above stock list: Chart View ➞ 0 - 25 , 25 - 50 , 50 - 75 , 75 - 100 , 100 - 125 , 125 - 150 , 150 - 175 , 175 - 200 , 200 - 225 , 225 - 250 , 250 - 275 , 275 - 300 , 300 - 325 , 325 - 350 | ||
 | Click To Change The Sort Order: By Market Cap or Company Size Performance: Year-to-date, Week and Day |  |
| Too many stocks? View smallcap stocks filtered by marketcap & sector |
| Marketcap: All SmallCap Stocks (default-no microcap), Large, Mid-Range, Small |
| Smallcap Sector: Tech, Finance, Energy, Staples, Retail, Industrial, Materials, & Medical |
|
Get the most comprehensive stock market coverage daily at 12Stocks.com ➞ Best Stocks Today ➞ Best Stocks Weekly ➞ Best Stocks Year-to-Date ➞ Best Stocks Trends ➞  Best Stocks Today 12Stocks.com Best Nasdaq Stocks ➞ Best S&P 500 Stocks ➞ Best Tech Stocks ➞ Best Biotech Stocks ➞ |
| Detailed Overview of SmallCap Stocks |
| SmallCap Technical Overview, Leaders & Laggards, Top SmallCap ETF Funds & Detailed SmallCap Stocks List, Charts, Trends & More |
| Smallcap: Technical Analysis, Trends & YTD Performance | |
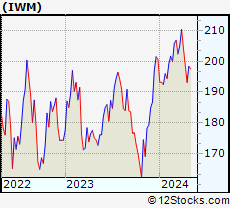
| SmallCap segment as represented by
IWM, an exchange-traded fund [ETF], holds basket of thousands of smallcap stocks from across all major sectors of the US stock market. The smallcap index (contains stocks like Riverbed & Sotheby's) is up by 0.59% and is currently underperforming the overall market by -6.29% year-to-date. Below is a quick view of technical charts and trends: | |
 IWM Weekly Chart |
|
| Long Term Trend: Not Good | |
| Medium Term Trend: Very Good | |
 IWM Daily Chart |
|
| Short Term Trend: Very Good | |
| Overall Trend Score: 69 | |
| YTD Performance: 0.59% | |
| **Trend Scores & Views Are Only For Educational Purposes And Not For Investing | |
| 12Stocks.com: Top Performing Small Cap Index Stocks | ||||||||||||||||||||||||||||||||||||||||||||||||
 The top performing Small Cap Index stocks year to date are
Now, more recently, over last week, the top performing Small Cap Index stocks on the move are


|
||||||||||||||||||||||||||||||||||||||||||||||||
| 12Stocks.com: Investing in Smallcap Index using Exchange Traded Funds | |
|
The following table shows list of key exchange traded funds (ETF) that
help investors track Smallcap index. The following list also includes leveraged ETF funds that track twice or thrice the daily returns of Smallcap indices. Short or inverse ETF funds move in the opposite direction to the index they track and are useful during market pullbacks or during bear markets. Quick View: Move mouse or cursor over ETF symbol (ticker) to view short-term technical chart and over ETF name to view long term chart. Click on ticker or stock name for detailed view. Click on to add stock symbol to your watchlist and to view watchlist. |
12Stocks.com List of ETFs that track Smallcap Index
| Ticker | ETF Name | Watchlist | Recent Price | Smart Investing & Trading Score | Change % | Week % | Year-to-date % |
| IWM | iShares Russell 2000 | | 201.90 | 69 | 0.99 | 1.77 | 0.59% |
| IJR | iShares Core S&P Small-Cap | | 107.13 | 82 | 0.75 | 1.4 | -1.03% |
| VTWO | Vanguard Russell 2000 ETF | | 81.61 | 69 | 0.94 | 1.73 | 0.63% |
| IWN | iShares Russell 2000 Value | | 154.21 | 100 | 0.87 | 2.03 | -0.72% |
| IJS | iShares S&P Small-Cap 600 Value | | 98.72 | 64 | 0.71 | 1.57 | -4.22% |
| IWO | iShares Russell 2000 Growth | | 256.87 | 57 | 0.99 | 1.49 | 1.84% |
| IJT | iShares S&P Small-Cap 600 Growth | | 127.76 | 95 | 0.82 | 1.32 | 2.09% |
| XSLV | PowerShares S&P SmallCap Low Volatil ETF | | 43.22 | 87 | 0.19 | 1.17 | -2.11% |
| SBB | ProShares Short SmallCap600 | | 16.16 | 13 | -1.28 | -1.37 | 1.44% |
| SDD | ProShares UltraShort SmallCap600 | | 18.84 | 23 | -2.41 | -2.61 | 2.27% |
| SAA | ProShares Ultra SmallCap600 | | 23.59 | 69 | 2.86 | 2.39 | -5.45% |
| SMLV | SPDR SSGA US Small Cap Low Volatil ETF | | 109.69 | 87 | 0.78 | 2.01 | -2.52% |
| 12Stocks.com: Charts, Trends, Fundamental Data and Performances of SmallCap Stocks | |
|
We now take in-depth look at all SmallCap stocks including charts, multi-period performances and overall trends (as measured by Smart Investing & Trading Score). One can sort SmallCap stocks (click link to choose) by Daily, Weekly and by Year-to-Date performances. Also, one can sort by size of the company or by market capitalization. |
| Select Your Default Chart Type: | |||||
| |||||
| Click on stock symbol or name for detailed view. Click on to add stock symbol to your watchlist and to view watchlist. Quick View: Move mouse or cursor over "Daily" to quickly view daily technical stock chart and over "Weekly" to view weekly technical stock chart. | |||||

 | HSTM HealthStream, Inc. |
| Sector: Technology | |
| SubSector: Healthcare Information Services | |
| MarketCap: 770.255 Millions | |
| Recent Price: 27.03 Smart Investing & Trading Score: 69 | |
| Day Percent Change: 0.07% Day Change: 0.02 | |
| Week Change: 5.54% Year-to-date Change: 0.0% | |
| HSTM Links: Profile News Message Board | |
| Charts:- Daily , Weekly | |
| Add HSTM to Watchlist: View: Get Complete HSTM Trend Analysis ➞ | |
 | DDD 3D Systems Corporation |
| Sector: Technology | |
| SubSector: Computer Peripherals | |
| MarketCap: 842.989 Millions | |
| Recent Price: 3.62 Smart Investing & Trading Score: 59 | |
| Day Percent Change: 1.97% Day Change: 0.07 | |
| Week Change: 5.54% Year-to-date Change: -43.0% | |
| DDD Links: Profile News Message Board | |
| Charts:- Daily , Weekly | |
| Add DDD to Watchlist: View: Get Complete DDD Trend Analysis ➞ | |
 | ANF Abercrombie & Fitch Co. |
| Sector: Services & Goods | |
| SubSector: Apparel Stores | |
| MarketCap: 589.108 Millions | |
| Recent Price: 128.76 Smart Investing & Trading Score: 90 | |
| Day Percent Change: 3.09% Day Change: 3.86 | |
| Week Change: 5.47% Year-to-date Change: 46.0% | |
| ANF Links: Profile News Message Board | |
| Charts:- Daily , Weekly | |
| Add ANF to Watchlist: View: Get Complete ANF Trend Analysis ➞ | |
 | NRDS NerdWallet, Inc. |
| Sector: Financials | |
| SubSector: Credit Services | |
| MarketCap: 759 Millions | |
| Recent Price: 13.61 Smart Investing & Trading Score: 42 | |
| Day Percent Change: 2.99% Day Change: 0.39 | |
| Week Change: 5.47% Year-to-date Change: -8.9% | |
| NRDS Links: Profile News Message Board | |
| Charts:- Daily , Weekly | |
| Add NRDS to Watchlist: View: Get Complete NRDS Trend Analysis ➞ | |
 | UTL Unitil Corporation |
| Sector: Utilities | |
| SubSector: Diversified Utilities | |
| MarketCap: 756.98 Millions | |
| Recent Price: 52.63 Smart Investing & Trading Score: 100 | |
| Day Percent Change: 0.48% Day Change: 0.25 | |
| Week Change: 5.39% Year-to-date Change: 0.1% | |
| UTL Links: Profile News Message Board | |
| Charts:- Daily , Weekly | |
| Add UTL to Watchlist: View: Get Complete UTL Trend Analysis ➞ | |
 | PATK Patrick Industries, Inc. |
| Sector: Industrials | |
| SubSector: Lumber, Wood Production | |
| MarketCap: 565.838 Millions | |
| Recent Price: 111.13 Smart Investing & Trading Score: 64 | |
| Day Percent Change: 0.72% Day Change: 0.79 | |
| Week Change: 5.35% Year-to-date Change: 10.7% | |
| PATK Links: Profile News Message Board | |
| Charts:- Daily , Weekly | |
| Add PATK to Watchlist: View: Get Complete PATK Trend Analysis ➞ | |
 | MATW Matthews International Corporation |
| Sector: Services & Goods | |
| SubSector: Personal Services | |
| MarketCap: 803.325 Millions | |
| Recent Price: 28.59 Smart Investing & Trading Score: 74 | |
| Day Percent Change: 5.42% Day Change: 1.47 | |
| Week Change: 5.3% Year-to-date Change: -22.0% | |
| MATW Links: Profile News Message Board | |
| Charts:- Daily , Weekly | |
| Add MATW to Watchlist: View: Get Complete MATW Trend Analysis ➞ | |
 | PLOW Douglas Dynamics, Inc. |
| Sector: Consumer Staples | |
| SubSector: Auto Parts | |
| MarketCap: 654.739 Millions | |
| Recent Price: 23.54 Smart Investing & Trading Score: 74 | |
| Day Percent Change: 0.90% Day Change: 0.21 | |
| Week Change: 5.18% Year-to-date Change: -20.7% | |
| PLOW Links: Profile News Message Board | |
| Charts:- Daily , Weekly | |
| Add PLOW to Watchlist: View: Get Complete PLOW Trend Analysis ➞ | |
 | IHRT iHeartMedia, Inc. |
| Sector: Services & Goods | |
| SubSector: Broadcasting - Radio | |
| MarketCap: 694 Millions | |
| Recent Price: 2.25 Smart Investing & Trading Score: 74 | |
| Day Percent Change: 0.90% Day Change: 0.02 | |
| Week Change: 5.14% Year-to-date Change: -15.7% | |
| IHRT Links: Profile News Message Board | |
| Charts:- Daily , Weekly | |
| Add IHRT to Watchlist: View: Get Complete IHRT Trend Analysis ➞ | |
 | CAC Camden National Corporation |
| Sector: Financials | |
| SubSector: Regional - Northeast Banks | |
| MarketCap: 550.999 Millions | |
| Recent Price: 32.03 Smart Investing & Trading Score: 95 | |
| Day Percent Change: -0.31% Day Change: -0.10 | |
| Week Change: 5.02% Year-to-date Change: -14.9% | |
| CAC Links: Profile News Message Board | |
| Charts:- Daily , Weekly | |
| Add CAC to Watchlist: View: Get Complete CAC Trend Analysis ➞ | |
 | AZZ AZZ Inc. |
| Sector: Industrials | |
| SubSector: Diversified Machinery | |
| MarketCap: 743.416 Millions | |
| Recent Price: 75.02 Smart Investing & Trading Score: 63 | |
| Day Percent Change: 1.08% Day Change: 0.80 | |
| Week Change: 4.94% Year-to-date Change: 29.1% | |
| AZZ Links: Profile News Message Board | |
| Charts:- Daily , Weekly | |
| Add AZZ to Watchlist: View: Get Complete AZZ Trend Analysis ➞ | |
 | FBP First BanCorp. |
| Sector: Financials | |
| SubSector: Foreign Regional Banks | |
| MarketCap: 913.079 Millions | |
| Recent Price: 18.08 Smart Investing & Trading Score: 100 | |
| Day Percent Change: 0.61% Day Change: 0.11 | |
| Week Change: 4.87% Year-to-date Change: 9.9% | |
| FBP Links: Profile News Message Board | |
| Charts:- Daily , Weekly | |
| Add FBP to Watchlist: View: Get Complete FBP Trend Analysis ➞ | |
 | SAVE Spirit Airlines, Inc. |
| Sector: Transports | |
| SubSector: Major Airlines | |
| MarketCap: 885 Millions | |
| Recent Price: 3.71 Smart Investing & Trading Score: 52 | |
| Day Percent Change: 0.82% Day Change: 0.03 | |
| Week Change: 4.8% Year-to-date Change: -77.4% | |
| SAVE Links: Profile News Message Board | |
| Charts:- Daily , Weekly | |
| Add SAVE to Watchlist: View: Get Complete SAVE Trend Analysis ➞ | |
 | AMTB Amerant Bancorp Inc. |
| Sector: Financials | |
| SubSector: Regional - Midwest Banks | |
| MarketCap: 653.87 Millions | |
| Recent Price: 22.61 Smart Investing & Trading Score: 100 | |
| Day Percent Change: -0.13% Day Change: -0.03 | |
| Week Change: 4.77% Year-to-date Change: -8.0% | |
| AMTB Links: Profile News Message Board | |
| Charts:- Daily , Weekly | |
| Add AMTB to Watchlist: View: Get Complete AMTB Trend Analysis ➞ | |
 | NXRT NexPoint Residential Trust, Inc. |
| Sector: Financials | |
| SubSector: REIT - Residential | |
| MarketCap: 839.161 Millions | |
| Recent Price: 34.85 Smart Investing & Trading Score: 100 | |
| Day Percent Change: 1.69% Day Change: 0.58 | |
| Week Change: 4.75% Year-to-date Change: 1.2% | |
| NXRT Links: Profile News Message Board | |
| Charts:- Daily , Weekly | |
| Add NXRT to Watchlist: View: Get Complete NXRT Trend Analysis ➞ | |
 | UNFI United Natural Foods, Inc. |
| Sector: Consumer Staples | |
| SubSector: Food Wholesale | |
| MarketCap: 746.329 Millions | |
| Recent Price: 9.56 Smart Investing & Trading Score: 59 | |
| Day Percent Change: 1.59% Day Change: 0.15 | |
| Week Change: 4.71% Year-to-date Change: -41.1% | |
| UNFI Links: Profile News Message Board | |
| Charts:- Daily , Weekly | |
| Add UNFI to Watchlist: View: Get Complete UNFI Trend Analysis ➞ | |
 | OFIX Orthofix Medical Inc. |
| Sector: Health Care | |
| SubSector: Medical Appliances & Equipment | |
| MarketCap: 508.18 Millions | |
| Recent Price: 13.60 Smart Investing & Trading Score: 100 | |
| Day Percent Change: 2.72% Day Change: 0.36 | |
| Week Change: 4.7% Year-to-date Change: 0.9% | |
| OFIX Links: Profile News Message Board | |
| Charts:- Daily , Weekly | |
| Add OFIX to Watchlist: View: Get Complete OFIX Trend Analysis ➞ | |
 | GRND Grindr Inc. |
| Sector: Technology | |
| SubSector: Software - Application | |
| MarketCap: 929 Millions | |
| Recent Price: 10.35 Smart Investing & Trading Score: 90 | |
| Day Percent Change: 1.17% Day Change: 0.12 | |
| Week Change: 4.65% Year-to-date Change: 15.5% | |
| GRND Links: Profile News Message Board | |
| Charts:- Daily , Weekly | |
| Add GRND to Watchlist: View: Get Complete GRND Trend Analysis ➞ | |
 | CVGW Calavo Growers, Inc. |
| Sector: Consumer Staples | |
| SubSector: Farm Products | |
| MarketCap: 935.287 Millions | |
| Recent Price: 28.28 Smart Investing & Trading Score: 64 | |
| Day Percent Change: -2.18% Day Change: -0.63 | |
| Week Change: 4.62% Year-to-date Change: -3.8% | |
| CVGW Links: Profile News Message Board | |
| Charts:- Daily , Weekly | |
| Add CVGW to Watchlist: View: Get Complete CVGW Trend Analysis ➞ | |
 | USPH U.S. Physical Therapy, Inc. |
| Sector: Health Care | |
| SubSector: Specialized Health Services | |
| MarketCap: 793.556 Millions | |
| Recent Price: 105.20 Smart Investing & Trading Score: 74 | |
| Day Percent Change: 1.51% Day Change: 1.56 | |
| Week Change: 4.56% Year-to-date Change: 13.0% | |
| USPH Links: Profile News Message Board | |
| Charts:- Daily , Weekly | |
| Add USPH to Watchlist: View: Get Complete USPH Trend Analysis ➞ | |
 | PIPR Piper Sandler Companies |
| Sector: Financials | |
| SubSector: Asset Management | |
| MarketCap: 759.603 Millions | |
| Recent Price: 206.14 Smart Investing & Trading Score: 100 | |
| Day Percent Change: 1.47% Day Change: 2.98 | |
| Week Change: 4.55% Year-to-date Change: 17.9% | |
| PIPR Links: Profile News Message Board | |
| Charts:- Daily , Weekly | |
| Add PIPR to Watchlist: View: Get Complete PIPR Trend Analysis ➞ | |
 | CRNC Cerence Inc. |
| Sector: Technology | |
| SubSector: Application Software | |
| MarketCap: 640.662 Millions | |
| Recent Price: 10.15 Smart Investing & Trading Score: 42 | |
| Day Percent Change: 4.21% Day Change: 0.41 | |
| Week Change: 4.53% Year-to-date Change: -48.4% | |
| CRNC Links: Profile News Message Board | |
| Charts:- Daily , Weekly | |
| Add CRNC to Watchlist: View: Get Complete CRNC Trend Analysis ➞ | |
 | SLP Simulations Plus, Inc. |
| Sector: Technology | |
| SubSector: Business Software & Services | |
| MarketCap: 564.258 Millions | |
| Recent Price: 46.70 Smart Investing & Trading Score: 93 | |
| Day Percent Change: -0.04% Day Change: -0.02 | |
| Week Change: 4.5% Year-to-date Change: 4.4% | |
| SLP Links: Profile News Message Board | |
| Charts:- Daily , Weekly | |
| Add SLP to Watchlist: View: Get Complete SLP Trend Analysis ➞ | |
 | NMIH NMI Holdings, Inc. |
| Sector: Financials | |
| SubSector: Surety & Title Insurance | |
| MarketCap: 816.018 Millions | |
| Recent Price: 32.51 Smart Investing & Trading Score: 95 | |
| Day Percent Change: 0.12% Day Change: 0.04 | |
| Week Change: 4.5% Year-to-date Change: 9.5% | |
| NMIH Links: Profile News Message Board | |
| Charts:- Daily , Weekly | |
| Add NMIH to Watchlist: View: Get Complete NMIH Trend Analysis ➞ | |
 | PPBI Pacific Premier Bancorp, Inc. |
| Sector: Financials | |
| SubSector: Regional - Pacific Banks | |
| MarketCap: 978.029 Millions | |
| Recent Price: 22.95 Smart Investing & Trading Score: 87 | |
| Day Percent Change: 0.83% Day Change: 0.19 | |
| Week Change: 4.41% Year-to-date Change: -21.2% | |
| PPBI Links: Profile News Message Board | |
| Charts:- Daily , Weekly | |
| Add PPBI to Watchlist: View: Get Complete PPBI Trend Analysis ➞ | |
| For tabular summary view of above stock list: Summary View ➞ 0 - 25 , 25 - 50 , 50 - 75 , 75 - 100 , 100 - 125 , 125 - 150 , 150 - 175 , 175 - 200 , 200 - 225 , 225 - 250 , 250 - 275 , 275 - 300 , 300 - 325 , 325 - 350 | ||
| Click To Change The Sort Order: By Market Cap or Company Size Performance: Year-to-date, Week and Day | |
| Select Chart Type: | ||
| Too many stocks? View smallcap stocks filtered by marketcap & sector |
| Marketcap: All SmallCap Stocks (default-no microcap), Large, Mid-Range, Small & MicroCap |
| Sector: Tech, Finance, Energy, Staples, Retail, Industrial, Materials, Utilities & Medical |
|
Best Stocks Today 12Stocks.com |
© 2024 12Stocks.com Terms & Conditions Privacy Contact Us
All Information Provided Only For Education And Not To Be Used For Investing or Trading. See Terms & Conditions


One More Thing ... Get Best Stocks Delivered Daily!
Never Ever Miss A Move With Our Top Ten Stocks Lists
Find Best Stocks In Any Market - Bull or Bear Market
Take A Peek At Our Top Ten Stocks Lists: Daily, Weekly, Year-to-Date & Top Trends
Find Best Stocks In Any Market - Bull or Bear Market
Take A Peek At Our Top Ten Stocks Lists: Daily, Weekly, Year-to-Date & Top Trends
Smallcap Stocks With Best Up Trends [0-bearish to 100-bullish]: Twist Bioscience[100], WideOpenWest [100], Joint [100], FTC Solar[100], Origin Materials[100], Alignment Healthcare[100], Clarus [100], IES [100], Emergent BioSolutions[100], Enovix [100], El Pollo[100]
Best Smallcap Stocks Year-to-Date:
Janux [482.74%], Viking [313.59%], Longboard [272.5%], Alpine Immune[239.29%], Bakkt [199.55%], Avidity Biosciences[192.48%], Vera [189.47%], Cullinan Oncology[176.9%], Super Micro[175.35%], Y-mAbs [151.47%], Sana [149.33%] Best Smallcap Stocks This Week:
Emergent BioSolutions[102.6%], Deciphera [73.24%], Origin Materials[66.52%], Eyenovia [60.78%], Cue Biopharma[56.04%], Aspen Aerogels[55.96%], Enovix [54.02%], Luna Innovations[53.77%], Codexis [47.37%], Carvana Co[44.31%], Office Properties[42.79%] Best Smallcap Stocks Daily:
Luna Innovations[36.00%], Twist Bioscience[28.74%], Ardelyx [28.42%], WideOpenWest [28.23%], 2U [26.63%], Joint [25.35%], FTC Solar[25.09%], Origin Materials[22.23%], Alignment Healthcare[21.97%], Clarus [18.67%], Aurora Innovation[18.09%]