
 Login Sign Up


| |||||
 |  | ||||

| 12Stocks.com Market Intelligence |
Best SmallCap Stocks
|
| In a hurry? Small Cap Stock Lists: Performance Trends Table, Stock Charts
Sort Small Cap stocks: Daily, Weekly, Year-to-Date, Market Cap & Trends. Filter Small Cap stocks list by sector: Show all, Tech, Finance, Energy, Staples, Retail, Industrial, Materials, Utilities and HealthCare Filter Small Cap stocks list by size: All Large Medium Small and MicroCap |
| 12Stocks.com Small Cap Stocks Performances & Trends Daily | |||||||||
|
|  The overall Smart Investing & Trading Score is 69 (0-bearish to 100-bullish) which puts Small Cap index in short term neutral to bullish trend. The Smart Investing & Trading Score from previous trading session is 49 and hence an improvement of trend.
| ||||||||
Here are the Smart Investing & Trading Scores of the most requested small cap stocks at 12Stocks.com (click stock name for detailed review):
|


| 12Stocks.com: Investing in Smallcap Index with Stocks | |
|
The following table helps investors and traders sort through current performance and trends (as measured by Smart Investing & Trading Score) of various
stocks in the Smallcap Index. Quick View: Move mouse or cursor over stock symbol (ticker) to view short-term technical chart and over stock name to view long term chart. Click on  to add stock symbol to your watchlist and to add stock symbol to your watchlist and  to view watchlist. Click on any ticker or stock name for detailed market intelligence report for that stock. to view watchlist. Click on any ticker or stock name for detailed market intelligence report for that stock. |
12Stocks.com Performance of Stocks in Smallcap Index
| Ticker | Stock Name | Watchlist | Category | Recent Price | Smart Investing & Trading Score | Change % | Weekly Change% |
| ORGN | Origin Materials |   | Materials | 1.17 | 100 | 22.23% | 66.52% |
| CDXS | Codexis | | Health Care | 3.92 | 74 | 17.37% | 47.37% |
| ARDX | Ardelyx | | Health Care | 8.72 | 74 | 28.42% | 35.83% |
| PAHC | Phibro Animal | | Health Care | 17.07 | 95 | 1.85% | 34.09% |
| PIII | P3 Health | | Health Care | 0.58 | 60 | -5.19% | 31.33% |
| PRDO | Perdoceo Education | | Services & Goods | 24.34 | 100 | 0.95% | 29.06% |
| CDNA | CareDx | | Services & Goods | 9.72 | 74 | 4.85% | 28.57% |
| CNDT | Conduent | | Technology | 3.87 | 100 | 5.16% | 26.47% |
| AMPX | Amprius | | Industrials | 2.15 | 74 | 7.21% | 23.85% |
| CRS | Carpenter | | Industrials | 103.64 | 100 | 3.74% | 23.38% |
| ENTA | Enanta | | Health Care | 15.17 | 80 | 9.06% | 22.64% |
| TYRA | Tyra Biosciences | | Health Care | 18.96 | 74 | 5.95% | 21.00% |
| CDLX | Cardlytics | | Technology | 14.88 | 100 | 6.51% | 20.88% |
| CSTL | Castle Biosciences | | Health Care | 24.33 | 100 | 6.52% | 19.62% |
| HLIT | Harmonic | | Technology | 10.96 | 64 | -1.26% | 19.13% |
| OMER | Omeros | | Health Care | 3.73 | 59 | 0.27% | 18.41% |
| YMAB | Y-mAbs | | Health Care | 17.15 | 95 | -0.58% | 16.59% |
| AMPS | Altus Power | | Utilities | 4.21 | 57 | 5.77% | 16.44% |
| RVNC | Revance | | Health Care | 3.95 | 59 | 4.77% | 16.18% |
| BHE | Benchmark Electronics | | Technology | 36.43 | 100 | 1.87% | 16.17% |
| SSP | E.W. Scripps | | Services & Goods | 4.27 | 100 | 1.18% | 15.41% |
| FDMT | 4D Molecular | | Health Care | 26.70 | 44 | 5.20% | 14.96% |
| OSPN | OneSpan | | Technology | 12.39 | 100 | 13.15% | 14.83% |
| RXST | RxSight | | Health Care | 60.57 | 100 | 3.10% | 14.82% |
| LC | LendingClub | | Financials | 9.28 | 100 | -0.54% | 14.57% |
| For chart view version of above stock list: Chart View ➞ 0 - 25 , 25 - 50 , 50 - 75 , 75 - 100 , 100 - 125 , 125 - 150 , 150 - 175 , 175 - 200 , 200 - 225 , 225 - 250 , 250 - 275 , 275 - 300 , 300 - 325 , 325 - 350 | ||
 | Click To Change The Sort Order: By Market Cap or Company Size Performance: Year-to-date, Week and Day |  |
| Too many stocks? View smallcap stocks filtered by marketcap & sector |
| Marketcap: All SmallCap Stocks (default-no microcap), Large, Mid-Range, Small |
| Smallcap Sector: Tech, Finance, Energy, Staples, Retail, Industrial, Materials, & Medical |
|
Get the most comprehensive stock market coverage daily at 12Stocks.com ➞ Best Stocks Today ➞ Best Stocks Weekly ➞ Best Stocks Year-to-Date ➞ Best Stocks Trends ➞  Best Stocks Today 12Stocks.com Best Nasdaq Stocks ➞ Best S&P 500 Stocks ➞ Best Tech Stocks ➞ Best Biotech Stocks ➞ |
| Detailed Overview of SmallCap Stocks |
| SmallCap Technical Overview, Leaders & Laggards, Top SmallCap ETF Funds & Detailed SmallCap Stocks List, Charts, Trends & More |
| Smallcap: Technical Analysis, Trends & YTD Performance | |
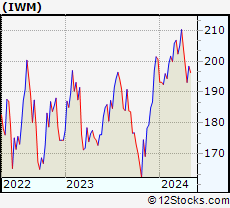
| SmallCap segment as represented by
IWM, an exchange-traded fund [ETF], holds basket of thousands of smallcap stocks from across all major sectors of the US stock market. The smallcap index (contains stocks like Riverbed & Sotheby's) is up by 0.59% and is currently underperforming the overall market by -6.29% year-to-date. Below is a quick view of technical charts and trends: | |
 IWM Weekly Chart |
|
| Long Term Trend: Not Good | |
| Medium Term Trend: Very Good | |
 IWM Daily Chart |
|
| Short Term Trend: Very Good | |
| Overall Trend Score: 69 | |
| YTD Performance: 0.59% | |
| **Trend Scores & Views Are Only For Educational Purposes And Not For Investing | |
| 12Stocks.com: Top Performing Small Cap Index Stocks | ||||||||||||||||||||||||||||||||||||||||||||||||
 The top performing Small Cap Index stocks year to date are
Now, more recently, over last week, the top performing Small Cap Index stocks on the move are


|
||||||||||||||||||||||||||||||||||||||||||||||||
| 12Stocks.com: Investing in Smallcap Index using Exchange Traded Funds | |
|
The following table shows list of key exchange traded funds (ETF) that
help investors track Smallcap index. The following list also includes leveraged ETF funds that track twice or thrice the daily returns of Smallcap indices. Short or inverse ETF funds move in the opposite direction to the index they track and are useful during market pullbacks or during bear markets. Quick View: Move mouse or cursor over ETF symbol (ticker) to view short-term technical chart and over ETF name to view long term chart. Click on ticker or stock name for detailed view. Click on to add stock symbol to your watchlist and to view watchlist. |
12Stocks.com List of ETFs that track Smallcap Index
| Ticker | ETF Name | Watchlist | Recent Price | Smart Investing & Trading Score | Change % | Week % | Year-to-date % |
| IWM | iShares Russell 2000 | | 201.90 | 69 | 0.99 | 1.77 | 0.59% |
| IJR | iShares Core S&P Small-Cap | | 107.13 | 82 | 0.75 | 1.4 | -1.03% |
| VTWO | Vanguard Russell 2000 ETF | | 81.61 | 69 | 0.94 | 1.73 | 0.63% |
| IWN | iShares Russell 2000 Value | | 154.21 | 100 | 0.87 | 2.03 | -0.72% |
| IJS | iShares S&P Small-Cap 600 Value | | 98.72 | 64 | 0.71 | 1.57 | -4.22% |
| IWO | iShares Russell 2000 Growth | | 256.87 | 57 | 0.99 | 1.49 | 1.84% |
| IJT | iShares S&P Small-Cap 600 Growth | | 127.76 | 95 | 0.82 | 1.32 | 2.09% |
| XSLV | PowerShares S&P SmallCap Low Volatil ETF | | 43.22 | 87 | 0.19 | 1.17 | -2.11% |
| SBB | ProShares Short SmallCap600 | | 16.16 | 13 | -1.28 | -1.37 | 1.44% |
| SDD | ProShares UltraShort SmallCap600 | | 18.84 | 23 | -2.41 | -2.61 | 2.27% |
| SAA | ProShares Ultra SmallCap600 | | 23.59 | 69 | 2.86 | 2.39 | -5.45% |
| SMLV | SPDR SSGA US Small Cap Low Volatil ETF | | 109.69 | 87 | 0.78 | 2.01 | -2.52% |
| 12Stocks.com: Charts, Trends, Fundamental Data and Performances of SmallCap Stocks | |
|
We now take in-depth look at all SmallCap stocks including charts, multi-period performances and overall trends (as measured by Smart Investing & Trading Score). One can sort SmallCap stocks (click link to choose) by Daily, Weekly and by Year-to-Date performances. Also, one can sort by size of the company or by market capitalization. |
| Select Your Default Chart Type: | |||||
| |||||
| Click on stock symbol or name for detailed view. Click on to add stock symbol to your watchlist and to view watchlist. Quick View: Move mouse or cursor over "Daily" to quickly view daily technical stock chart and over "Weekly" to view weekly technical stock chart. | |||||

 | ORGN Origin Materials, Inc. |
| Sector: Materials | |
| SubSector: Chemicals | |
| MarketCap: 586 Millions | |
| Recent Price: 1.17 Smart Investing & Trading Score: 100 | |
| Day Percent Change: 22.23% Day Change: 0.21 | |
| Week Change: 66.52% Year-to-date Change: 38.8% | |
| ORGN Links: Profile News Message Board | |
| Charts:- Daily , Weekly | |
| Add ORGN to Watchlist: View: Get Complete ORGN Trend Analysis ➞ | |
 | CDXS Codexis, Inc. |
| Sector: Health Care | |
| SubSector: Biotechnology | |
| MarketCap: 592.185 Millions | |
| Recent Price: 3.92 Smart Investing & Trading Score: 74 | |
| Day Percent Change: 17.37% Day Change: 0.58 | |
| Week Change: 47.37% Year-to-date Change: 28.5% | |
| CDXS Links: Profile News Message Board | |
| Charts:- Daily , Weekly | |
| Add CDXS to Watchlist: View: Get Complete CDXS Trend Analysis ➞ | |
 | ARDX Ardelyx, Inc. |
| Sector: Health Care | |
| SubSector: Biotechnology | |
| MarketCap: 541.985 Millions | |
| Recent Price: 8.72 Smart Investing & Trading Score: 74 | |
| Day Percent Change: 28.42% Day Change: 1.93 | |
| Week Change: 35.83% Year-to-date Change: 40.7% | |
| ARDX Links: Profile News Message Board | |
| Charts:- Daily , Weekly | |
| Add ARDX to Watchlist: View: Get Complete ARDX Trend Analysis ➞ | |
 | PAHC Phibro Animal Health Corporation |
| Sector: Health Care | |
| SubSector: Specialized Health Services | |
| MarketCap: 852.956 Millions | |
| Recent Price: 17.07 Smart Investing & Trading Score: 95 | |
| Day Percent Change: 1.85% Day Change: 0.31 | |
| Week Change: 34.09% Year-to-date Change: 47.4% | |
| PAHC Links: Profile News Message Board | |
| Charts:- Daily , Weekly | |
| Add PAHC to Watchlist: View: Get Complete PAHC Trend Analysis ➞ | |
 | PIII P3 Health Partners Inc. |
| Sector: Health Care | |
| SubSector: Medical Care Facilities | |
| MarketCap: 944 Millions | |
| Recent Price: 0.58 Smart Investing & Trading Score: 60 | |
| Day Percent Change: -5.19% Day Change: -0.03 | |
| Week Change: 31.33% Year-to-date Change: -60.6% | |
| PIII Links: Profile News Message Board | |
| Charts:- Daily , Weekly | |
| Add PIII to Watchlist: View: Get Complete PIII Trend Analysis ➞ | |
 | PRDO Perdoceo Education Corporation |
| Sector: Services & Goods | |
| SubSector: Education & Training Services | |
| MarketCap: 631.006 Millions | |
| Recent Price: 24.34 Smart Investing & Trading Score: 100 | |
| Day Percent Change: 0.95% Day Change: 0.23 | |
| Week Change: 29.06% Year-to-date Change: 38.6% | |
| PRDO Links: Profile News Message Board | |
| Charts:- Daily , Weekly | |
| Add PRDO to Watchlist: View: Get Complete PRDO Trend Analysis ➞ | |
 | CDNA CareDx, Inc |
| Sector: Services & Goods | |
| SubSector: Research Services | |
| MarketCap: 828.194 Millions | |
| Recent Price: 9.72 Smart Investing & Trading Score: 74 | |
| Day Percent Change: 4.85% Day Change: 0.45 | |
| Week Change: 28.57% Year-to-date Change: -19.0% | |
| CDNA Links: Profile News Message Board | |
| Charts:- Daily , Weekly | |
| Add CDNA to Watchlist: View: Get Complete CDNA Trend Analysis ➞ | |
 | CNDT Conduent Incorporated |
| Sector: Technology | |
| SubSector: Information Technology Services | |
| MarketCap: 514.968 Millions | |
| Recent Price: 3.87 Smart Investing & Trading Score: 100 | |
| Day Percent Change: 5.16% Day Change: 0.19 | |
| Week Change: 26.47% Year-to-date Change: 6.0% | |
| CNDT Links: Profile News Message Board | |
| Charts:- Daily , Weekly | |
| Add CNDT to Watchlist: View: Get Complete CNDT Trend Analysis ➞ | |
 | AMPX Amprius Technologies, Inc. |
| Sector: Industrials | |
| SubSector: Electrical Equipment & Parts | |
| MarketCap: 608 Millions | |
| Recent Price: 2.15 Smart Investing & Trading Score: 74 | |
| Day Percent Change: 7.21% Day Change: 0.15 | |
| Week Change: 23.85% Year-to-date Change: -57.0% | |
| AMPX Links: Profile News Message Board | |
| Charts:- Daily , Weekly | |
| Add AMPX to Watchlist: View: Get Complete AMPX Trend Analysis ➞ | |
 | CRS Carpenter Technology Corporation |
| Sector: Industrials | |
| SubSector: Metal Fabrication | |
| MarketCap: 853.35 Millions | |
| Recent Price: 103.64 Smart Investing & Trading Score: 100 | |
| Day Percent Change: 3.74% Day Change: 3.74 | |
| Week Change: 23.38% Year-to-date Change: 46.4% | |
| CRS Links: Profile News Message Board | |
| Charts:- Daily , Weekly | |
| Add CRS to Watchlist: View: Get Complete CRS Trend Analysis ➞ | |
 | ENTA Enanta Pharmaceuticals, Inc. |
| Sector: Health Care | |
| SubSector: Biotechnology | |
| MarketCap: 998.385 Millions | |
| Recent Price: 15.17 Smart Investing & Trading Score: 80 | |
| Day Percent Change: 9.06% Day Change: 1.26 | |
| Week Change: 22.64% Year-to-date Change: 61.2% | |
| ENTA Links: Profile News Message Board | |
| Charts:- Daily , Weekly | |
| Add ENTA to Watchlist: View: Get Complete ENTA Trend Analysis ➞ | |
 | TYRA Tyra Biosciences, Inc. |
| Sector: Health Care | |
| SubSector: Biotechnology | |
| MarketCap: 732 Millions | |
| Recent Price: 18.96 Smart Investing & Trading Score: 74 | |
| Day Percent Change: 5.95% Day Change: 1.07 | |
| Week Change: 21% Year-to-date Change: 42.2% | |
| TYRA Links: Profile News Message Board | |
| Charts:- Daily , Weekly | |
| Add TYRA to Watchlist: View: Get Complete TYRA Trend Analysis ➞ | |
 | CDLX Cardlytics, Inc. |
| Sector: Technology | |
| SubSector: Internet Information Providers | |
| MarketCap: 855.48 Millions | |
| Recent Price: 14.88 Smart Investing & Trading Score: 100 | |
| Day Percent Change: 6.51% Day Change: 0.91 | |
| Week Change: 20.88% Year-to-date Change: 61.6% | |
| CDLX Links: Profile News Message Board | |
| Charts:- Daily , Weekly | |
| Add CDLX to Watchlist: View: Get Complete CDLX Trend Analysis ➞ | |
 | CSTL Castle Biosciences, Inc. |
| Sector: Health Care | |
| SubSector: Medical Laboratories & Research | |
| MarketCap: 545 Millions | |
| Recent Price: 24.33 Smart Investing & Trading Score: 100 | |
| Day Percent Change: 6.52% Day Change: 1.49 | |
| Week Change: 19.62% Year-to-date Change: 12.7% | |
| CSTL Links: Profile News Message Board | |
| Charts:- Daily , Weekly | |
| Add CSTL to Watchlist: View: Get Complete CSTL Trend Analysis ➞ | |
 | HLIT Harmonic Inc. |
| Sector: Technology | |
| SubSector: Communication Equipment | |
| MarketCap: 533.539 Millions | |
| Recent Price: 10.96 Smart Investing & Trading Score: 64 | |
| Day Percent Change: -1.26% Day Change: -0.14 | |
| Week Change: 19.13% Year-to-date Change: -16.0% | |
| HLIT Links: Profile News Message Board | |
| Charts:- Daily , Weekly | |
| Add HLIT to Watchlist: View: Get Complete HLIT Trend Analysis ➞ | |
 | OMER Omeros Corporation |
| Sector: Health Care | |
| SubSector: Biotechnology | |
| MarketCap: 759.585 Millions | |
| Recent Price: 3.73 Smart Investing & Trading Score: 59 | |
| Day Percent Change: 0.27% Day Change: 0.01 | |
| Week Change: 18.41% Year-to-date Change: 14.1% | |
| OMER Links: Profile News Message Board | |
| Charts:- Daily , Weekly | |
| Add OMER to Watchlist: View: Get Complete OMER Trend Analysis ➞ | |
 | YMAB Y-mAbs Therapeutics, Inc. |
| Sector: Health Care | |
| SubSector: Biotechnology | |
| MarketCap: 899.585 Millions | |
| Recent Price: 17.15 Smart Investing & Trading Score: 95 | |
| Day Percent Change: -0.58% Day Change: -0.10 | |
| Week Change: 16.59% Year-to-date Change: 151.5% | |
| YMAB Links: Profile News Message Board | |
| Charts:- Daily , Weekly | |
| Add YMAB to Watchlist: View: Get Complete YMAB Trend Analysis ➞ | |
 | AMPS Altus Power, Inc. |
| Sector: Utilities | |
| SubSector: Utilities - Renewable | |
| MarketCap: 866 Millions | |
| Recent Price: 4.21 Smart Investing & Trading Score: 57 | |
| Day Percent Change: 5.77% Day Change: 0.23 | |
| Week Change: 16.44% Year-to-date Change: -38.8% | |
| AMPS Links: Profile News Message Board | |
| Charts:- Daily , Weekly | |
| Add AMPS to Watchlist: View: Get Complete AMPS Trend Analysis ➞ | |
 | RVNC Revance Therapeutics, Inc. |
| Sector: Health Care | |
| SubSector: Biotechnology | |
| MarketCap: 854.185 Millions | |
| Recent Price: 3.95 Smart Investing & Trading Score: 59 | |
| Day Percent Change: 4.77% Day Change: 0.18 | |
| Week Change: 16.18% Year-to-date Change: -55.1% | |
| RVNC Links: Profile News Message Board | |
| Charts:- Daily , Weekly | |
| Add RVNC to Watchlist: View: Get Complete RVNC Trend Analysis ➞ | |
 | BHE Benchmark Electronics, Inc. |
| Sector: Technology | |
| SubSector: Printed Circuit Boards | |
| MarketCap: 766.835 Millions | |
| Recent Price: 36.43 Smart Investing & Trading Score: 100 | |
| Day Percent Change: 1.87% Day Change: 0.67 | |
| Week Change: 16.17% Year-to-date Change: 31.8% | |
| BHE Links: Profile News Message Board | |
| Charts:- Daily , Weekly | |
| Add BHE to Watchlist: View: Get Complete BHE Trend Analysis ➞ | |
 | SSP The E.W. Scripps Company |
| Sector: Services & Goods | |
| SubSector: Broadcasting - TV | |
| MarketCap: 766.163 Millions | |
| Recent Price: 4.27 Smart Investing & Trading Score: 100 | |
| Day Percent Change: 1.18% Day Change: 0.05 | |
| Week Change: 15.41% Year-to-date Change: -46.6% | |
| SSP Links: Profile News Message Board | |
| Charts:- Daily , Weekly | |
| Add SSP to Watchlist: View: Get Complete SSP Trend Analysis ➞ | |
 | FDMT 4D Molecular Therapeutics, Inc. |
| Sector: Health Care | |
| SubSector: Biotechnology | |
| MarketCap: 772 Millions | |
| Recent Price: 26.70 Smart Investing & Trading Score: 44 | |
| Day Percent Change: 5.20% Day Change: 1.32 | |
| Week Change: 14.96% Year-to-date Change: 29.0% | |
| FDMT Links: Profile News Message Board | |
| Charts:- Daily , Weekly | |
| Add FDMT to Watchlist: View: Get Complete FDMT Trend Analysis ➞ | |
 | OSPN OneSpan Inc. |
| Sector: Technology | |
| SubSector: Application Software | |
| MarketCap: 657.762 Millions | |
| Recent Price: 12.39 Smart Investing & Trading Score: 100 | |
| Day Percent Change: 13.15% Day Change: 1.44 | |
| Week Change: 14.83% Year-to-date Change: 15.6% | |
| OSPN Links: Profile News Message Board | |
| Charts:- Daily , Weekly | |
| Add OSPN to Watchlist: View: Get Complete OSPN Trend Analysis ➞ | |
 | RXST RxSight, Inc. |
| Sector: Health Care | |
| SubSector: Medical Devices | |
| MarketCap: 893 Millions | |
| Recent Price: 60.57 Smart Investing & Trading Score: 100 | |
| Day Percent Change: 3.10% Day Change: 1.82 | |
| Week Change: 14.82% Year-to-date Change: 51.0% | |
| RXST Links: Profile News Message Board | |
| Charts:- Daily , Weekly | |
| Add RXST to Watchlist: View: Get Complete RXST Trend Analysis ➞ | |
 | LC LendingClub Corporation |
| Sector: Financials | |
| SubSector: Credit Services | |
| MarketCap: 852.308 Millions | |
| Recent Price: 9.28 Smart Investing & Trading Score: 100 | |
| Day Percent Change: -0.54% Day Change: -0.05 | |
| Week Change: 14.57% Year-to-date Change: 6.2% | |
| LC Links: Profile News Message Board | |
| Charts:- Daily , Weekly | |
| Add LC to Watchlist: View: Get Complete LC Trend Analysis ➞ | |
| For tabular summary view of above stock list: Summary View ➞ 0 - 25 , 25 - 50 , 50 - 75 , 75 - 100 , 100 - 125 , 125 - 150 , 150 - 175 , 175 - 200 , 200 - 225 , 225 - 250 , 250 - 275 , 275 - 300 , 300 - 325 , 325 - 350 | ||
| Click To Change The Sort Order: By Market Cap or Company Size Performance: Year-to-date, Week and Day | |
| Select Chart Type: | ||
| Too many stocks? View smallcap stocks filtered by marketcap & sector |
| Marketcap: All SmallCap Stocks (default-no microcap), Large, Mid-Range, Small & MicroCap |
| Sector: Tech, Finance, Energy, Staples, Retail, Industrial, Materials, Utilities & Medical |
|
Best Stocks Today 12Stocks.com |
© 2024 12Stocks.com Terms & Conditions Privacy Contact Us
All Information Provided Only For Education And Not To Be Used For Investing or Trading. See Terms & Conditions


One More Thing ... Get Best Stocks Delivered Daily!
Never Ever Miss A Move With Our Top Ten Stocks Lists
Find Best Stocks In Any Market - Bull or Bear Market
Take A Peek At Our Top Ten Stocks Lists: Daily, Weekly, Year-to-Date & Top Trends
Find Best Stocks In Any Market - Bull or Bear Market
Take A Peek At Our Top Ten Stocks Lists: Daily, Weekly, Year-to-Date & Top Trends
Smallcap Stocks With Best Up Trends [0-bearish to 100-bullish]: Twist Bioscience[100], WideOpenWest [100], Joint [100], FTC Solar[100], Origin Materials[100], Alignment Healthcare[100], Clarus [100], IES [100], Emergent BioSolutions[100], Enovix [100], El Pollo[100]
Best Smallcap Stocks Year-to-Date:
Janux [482.74%], Viking [313.59%], Longboard [272.5%], Alpine Immune[239.29%], Bakkt [199.55%], Avidity Biosciences[192.48%], Vera [189.47%], Cullinan Oncology[176.9%], Super Micro[175.35%], Y-mAbs [151.47%], Sana [149.33%] Best Smallcap Stocks This Week:
Emergent BioSolutions[102.6%], Deciphera [73.24%], Origin Materials[66.52%], Eyenovia [60.78%], Cue Biopharma[56.04%], Aspen Aerogels[55.96%], Enovix [54.02%], Luna Innovations[53.77%], Codexis [47.37%], Carvana Co[44.31%], Office Properties[42.79%] Best Smallcap Stocks Daily:
Luna Innovations[36.00%], Twist Bioscience[28.74%], Ardelyx [28.42%], WideOpenWest [28.23%], 2U [26.63%], Joint [25.35%], FTC Solar[25.09%], Origin Materials[22.23%], Alignment Healthcare[21.97%], Clarus [18.67%], Aurora Innovation[18.09%]