
 Login Sign Up


| |||||
 |  | ||||

| 12Stocks.com Market Intelligence |
Best SmallCap Stocks
|
| In a hurry? Small Cap Stock Lists: Performance Trends Table, Stock Charts
Sort Small Cap stocks: Daily, Weekly, Year-to-Date, Market Cap & Trends. Filter Small Cap stocks list by sector: Show all, Tech, Finance, Energy, Staples, Retail, Industrial, Materials, Utilities and HealthCare Filter Small Cap stocks list by size: All Large Medium Small and MicroCap |
| 12Stocks.com Small Cap Stocks Performances & Trends Daily | |||||||||
|
|  The overall Smart Investing & Trading Score is 69 (0-bearish to 100-bullish) which puts Small Cap index in short term neutral to bullish trend. The Smart Investing & Trading Score from previous trading session is 49 and hence an improvement of trend.
| ||||||||
Here are the Smart Investing & Trading Scores of the most requested small cap stocks at 12Stocks.com (click stock name for detailed review):
|


| 12Stocks.com: Investing in Smallcap Index with Stocks | |
|
The following table helps investors and traders sort through current performance and trends (as measured by Smart Investing & Trading Score) of various
stocks in the Smallcap Index. Quick View: Move mouse or cursor over stock symbol (ticker) to view short-term technical chart and over stock name to view long term chart. Click on  to add stock symbol to your watchlist and to add stock symbol to your watchlist and  to view watchlist. Click on any ticker or stock name for detailed market intelligence report for that stock. to view watchlist. Click on any ticker or stock name for detailed market intelligence report for that stock. |
12Stocks.com Performance of Stocks in Smallcap Index
| Ticker | Stock Name | Watchlist | Category | Recent Price | Smart Investing & Trading Score | Change % | Weekly Change% |
| CAKE | Cheesecake Factory |   | Services & Goods | 33.67 | 15 | 0.60% | -4.77% |
| BLMN | Bloomin | | Services & Goods | 25.61 | 25 | 2.07% | -4.90% |
| RES | RPC | | Energy | 6.77 | 32 | 2.27% | -4.92% |
| SKT | Tanger Factory | | Financials | 27.46 | 22 | -1.89% | -4.92% |
| MUR | Murphy Oil | | Energy | 44.15 | 46 | -0.16% | -4.93% |
| FLR | Fluor | | Industrials | 38.90 | 26 | -5.67% | -5.01% |
| CERS | Cerus | | Health Care | 1.62 | 17 | -7.95% | -5.26% |
| HCC | Warrior Met | | Materials | 66.23 | 58 | 1.13% | -5.56% |
| EVLV | Evolv | | Industrials | 3.88 | 53 | -0.77% | -5.94% |
| CLB | Core | | Energy | 15.92 | 68 | 1.40% | -6.02% |
| JACK | Jack in | | Services & Goods | 55.23 | 10 | 1.06% | -6.06% |
| ITCI | Intra-Cellular Therapies | | Health Care | 68.80 | 15 | -2.19% | -6.09% |
| CIFR | Cipher Mining | | Financials | 4.21 | 78 | 6.18% | -6.24% |
| MBI | MBIA | | Financials | 6.38 | 64 | -1.69% | -6.45% |
| AESI | Atlas Energy | | Energy | 21.87 | 36 | -1.26% | -6.66% |
| IAUX | i-80 Gold | | Materials | 1.22 | 47 | -0.41% | -6.87% |
| UIS | Unisys | | Technology | 5.08 | 0 | -3.05% | -6.96% |
| VREX | Varex Imaging | | Health Care | 15.59 | 0 | -5.11% | -7.15% |
| SIG | Signet Jewelers | | Services & Goods | 94.35 | 0 | -3.13% | -7.32% |
| CHCT | Community Healthcare | | Financials | 24.37 | 10 | -2.21% | -7.44% |
| HURN | Huron Consulting | | Services & Goods | 86.32 | 0 | 0.79% | -7.81% |
| PWP | Perella Weinberg | | Financials | 13.95 | 26 | -8.67% | -8.88% |
| HMST | HomeStreet | | Financials | 10.98 | 22 | 1.48% | -8.88% |
| JOUT | Johnson Outdoors | | Consumer Staples | 37.83 | 0 | -11.22% | -9.39% |
| SAH | Sonic Automotive | | Services & Goods | 56.43 | 63 | -1.14% | -9.42% |
| For chart view version of above stock list: Chart View ➞ 0 - 25 , 25 - 50 , 50 - 75 , 75 - 100 , 100 - 125 , 125 - 150 , 150 - 175 , 175 - 200 , 200 - 225 , 225 - 250 , 250 - 275 , 275 - 300 , 300 - 325 , 325 - 350 | ||
 | Click To Change The Sort Order: By Market Cap or Company Size Performance: Year-to-date, Week and Day |  |
| Too many stocks? View smallcap stocks filtered by marketcap & sector |
| Marketcap: All SmallCap Stocks (default-no microcap), Large, Mid-Range, Small |
| Smallcap Sector: Tech, Finance, Energy, Staples, Retail, Industrial, Materials, & Medical |
|
Get the most comprehensive stock market coverage daily at 12Stocks.com ➞ Best Stocks Today ➞ Best Stocks Weekly ➞ Best Stocks Year-to-Date ➞ Best Stocks Trends ➞  Best Stocks Today 12Stocks.com Best Nasdaq Stocks ➞ Best S&P 500 Stocks ➞ Best Tech Stocks ➞ Best Biotech Stocks ➞ |
| Detailed Overview of SmallCap Stocks |
| SmallCap Technical Overview, Leaders & Laggards, Top SmallCap ETF Funds & Detailed SmallCap Stocks List, Charts, Trends & More |
| Smallcap: Technical Analysis, Trends & YTD Performance | |
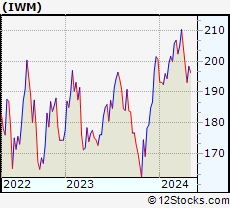
| SmallCap segment as represented by
IWM, an exchange-traded fund [ETF], holds basket of thousands of smallcap stocks from across all major sectors of the US stock market. The smallcap index (contains stocks like Riverbed & Sotheby's) is up by 0.59% and is currently underperforming the overall market by -6.29% year-to-date. Below is a quick view of technical charts and trends: | |
 IWM Weekly Chart |
|
| Long Term Trend: Not Good | |
| Medium Term Trend: Very Good | |
 IWM Daily Chart |
|
| Short Term Trend: Very Good | |
| Overall Trend Score: 69 | |
| YTD Performance: 0.59% | |
| **Trend Scores & Views Are Only For Educational Purposes And Not For Investing | |
| 12Stocks.com: Top Performing Small Cap Index Stocks | ||||||||||||||||||||||||||||||||||||||||||||||||
 The top performing Small Cap Index stocks year to date are
Now, more recently, over last week, the top performing Small Cap Index stocks on the move are


|
||||||||||||||||||||||||||||||||||||||||||||||||
| 12Stocks.com: Investing in Smallcap Index using Exchange Traded Funds | |
|
The following table shows list of key exchange traded funds (ETF) that
help investors track Smallcap index. The following list also includes leveraged ETF funds that track twice or thrice the daily returns of Smallcap indices. Short or inverse ETF funds move in the opposite direction to the index they track and are useful during market pullbacks or during bear markets. Quick View: Move mouse or cursor over ETF symbol (ticker) to view short-term technical chart and over ETF name to view long term chart. Click on ticker or stock name for detailed view. Click on to add stock symbol to your watchlist and to view watchlist. |
12Stocks.com List of ETFs that track Smallcap Index
| Ticker | ETF Name | Watchlist | Recent Price | Smart Investing & Trading Score | Change % | Week % | Year-to-date % |
| IWM | iShares Russell 2000 | | 201.90 | 69 | 0.99 | 1.77 | 0.59% |
| IJR | iShares Core S&P Small-Cap | | 107.13 | 82 | 0.75 | 1.4 | -1.03% |
| VTWO | Vanguard Russell 2000 ETF | | 81.61 | 69 | 0.94 | 1.73 | 0.63% |
| IWN | iShares Russell 2000 Value | | 154.21 | 100 | 0.87 | 2.03 | -0.72% |
| IJS | iShares S&P Small-Cap 600 Value | | 98.72 | 64 | 0.71 | 1.57 | -4.22% |
| IWO | iShares Russell 2000 Growth | | 256.87 | 57 | 0.99 | 1.49 | 1.84% |
| IJT | iShares S&P Small-Cap 600 Growth | | 127.76 | 95 | 0.82 | 1.32 | 2.09% |
| XSLV | PowerShares S&P SmallCap Low Volatil ETF | | 43.22 | 87 | 0.19 | 1.17 | -2.11% |
| SBB | ProShares Short SmallCap600 | | 16.16 | 13 | -1.28 | -1.37 | 1.44% |
| SDD | ProShares UltraShort SmallCap600 | | 18.84 | 23 | -2.41 | -2.61 | 2.27% |
| SAA | ProShares Ultra SmallCap600 | | 23.59 | 69 | 2.86 | 2.39 | -5.45% |
| SMLV | SPDR SSGA US Small Cap Low Volatil ETF | | 109.69 | 87 | 0.78 | 2.01 | -2.52% |
| 12Stocks.com: Charts, Trends, Fundamental Data and Performances of SmallCap Stocks | |
|
We now take in-depth look at all SmallCap stocks including charts, multi-period performances and overall trends (as measured by Smart Investing & Trading Score). One can sort SmallCap stocks (click link to choose) by Daily, Weekly and by Year-to-Date performances. Also, one can sort by size of the company or by market capitalization. |
| Select Your Default Chart Type: | |||||
| |||||
| Click on stock symbol or name for detailed view. Click on to add stock symbol to your watchlist and to view watchlist. Quick View: Move mouse or cursor over "Daily" to quickly view daily technical stock chart and over "Weekly" to view weekly technical stock chart. | |||||

 | CAKE The Cheesecake Factory Incorporated |
| Sector: Services & Goods | |
| SubSector: Restaurants | |
| MarketCap: 829 Millions | |
| Recent Price: 33.67 Smart Investing & Trading Score: 15 | |
| Day Percent Change: 0.60% Day Change: 0.20 | |
| Week Change: -4.77% Year-to-date Change: -3.8% | |
| CAKE Links: Profile News Message Board | |
| Charts:- Daily , Weekly | |
| Add CAKE to Watchlist: View: Get Complete CAKE Trend Analysis ➞ | |
 | BLMN Bloomin Brands, Inc. |
| Sector: Services & Goods | |
| SubSector: Restaurants | |
| MarketCap: 503.47 Millions | |
| Recent Price: 25.61 Smart Investing & Trading Score: 25 | |
| Day Percent Change: 2.07% Day Change: 0.52 | |
| Week Change: -4.9% Year-to-date Change: -9.0% | |
| BLMN Links: Profile News Message Board | |
| Charts:- Daily , Weekly | |
| Add BLMN to Watchlist: View: Get Complete BLMN Trend Analysis ➞ | |
 | RES RPC, Inc. |
| Sector: Energy | |
| SubSector: Oil & Gas Equipment & Services | |
| MarketCap: 546.261 Millions | |
| Recent Price: 6.77 Smart Investing & Trading Score: 32 | |
| Day Percent Change: 2.27% Day Change: 0.15 | |
| Week Change: -4.92% Year-to-date Change: -7.0% | |
| RES Links: Profile News Message Board | |
| Charts:- Daily , Weekly | |
| Add RES to Watchlist: View: Get Complete RES Trend Analysis ➞ | |
 | SKT Tanger Factory Outlet Centers, Inc. |
| Sector: Financials | |
| SubSector: REIT - Retail | |
| MarketCap: 720.214 Millions | |
| Recent Price: 27.46 Smart Investing & Trading Score: 22 | |
| Day Percent Change: -1.89% Day Change: -0.53 | |
| Week Change: -4.92% Year-to-date Change: -0.9% | |
| SKT Links: Profile News Message Board | |
| Charts:- Daily , Weekly | |
| Add SKT to Watchlist: View: Get Complete SKT Trend Analysis ➞ | |
 | MUR Murphy Oil Corporation |
| Sector: Energy | |
| SubSector: Independent Oil & Gas | |
| MarketCap: 985.993 Millions | |
| Recent Price: 44.15 Smart Investing & Trading Score: 46 | |
| Day Percent Change: -0.16% Day Change: -0.07 | |
| Week Change: -4.93% Year-to-date Change: 3.5% | |
| MUR Links: Profile News Message Board | |
| Charts:- Daily , Weekly | |
| Add MUR to Watchlist: View: Get Complete MUR Trend Analysis ➞ | |
 | FLR Fluor Corporation |
| Sector: Industrials | |
| SubSector: Heavy Construction | |
| MarketCap: 891.495 Millions | |
| Recent Price: 38.90 Smart Investing & Trading Score: 26 | |
| Day Percent Change: -5.67% Day Change: -2.34 | |
| Week Change: -5.01% Year-to-date Change: -0.7% | |
| FLR Links: Profile News Message Board | |
| Charts:- Daily , Weekly | |
| Add FLR to Watchlist: View: Get Complete FLR Trend Analysis ➞ | |
 | CERS Cerus Corporation |
| Sector: Health Care | |
| SubSector: Biotechnology | |
| MarketCap: 607.185 Millions | |
| Recent Price: 1.62 Smart Investing & Trading Score: 17 | |
| Day Percent Change: -7.95% Day Change: -0.14 | |
| Week Change: -5.26% Year-to-date Change: -25.0% | |
| CERS Links: Profile News Message Board | |
| Charts:- Daily , Weekly | |
| Add CERS to Watchlist: View: Get Complete CERS Trend Analysis ➞ | |
 | HCC Warrior Met Coal, Inc. |
| Sector: Materials | |
| SubSector: Industrial Metals & Minerals | |
| MarketCap: 748.81 Millions | |
| Recent Price: 66.23 Smart Investing & Trading Score: 58 | |
| Day Percent Change: 1.13% Day Change: 0.74 | |
| Week Change: -5.56% Year-to-date Change: 8.6% | |
| HCC Links: Profile News Message Board | |
| Charts:- Daily , Weekly | |
| Add HCC to Watchlist: View: Get Complete HCC Trend Analysis ➞ | |
 | EVLV Evolv Technologies Holdings, Inc. |
| Sector: Industrials | |
| SubSector: Security & Protection Services | |
| MarketCap: 853 Millions | |
| Recent Price: 3.88 Smart Investing & Trading Score: 53 | |
| Day Percent Change: -0.77% Day Change: -0.03 | |
| Week Change: -5.94% Year-to-date Change: -17.8% | |
| EVLV Links: Profile News Message Board | |
| Charts:- Daily , Weekly | |
| Add EVLV to Watchlist: View: Get Complete EVLV Trend Analysis ➞ | |
 | CLB Core Laboratories N.V. |
| Sector: Energy | |
| SubSector: Oil & Gas Equipment & Services | |
| MarketCap: 599.661 Millions | |
| Recent Price: 15.92 Smart Investing & Trading Score: 68 | |
| Day Percent Change: 1.40% Day Change: 0.22 | |
| Week Change: -6.02% Year-to-date Change: -9.9% | |
| CLB Links: Profile News Message Board | |
| Charts:- Daily , Weekly | |
| Add CLB to Watchlist: View: Get Complete CLB Trend Analysis ➞ | |
 | JACK Jack in the Box Inc. |
| Sector: Services & Goods | |
| SubSector: Restaurants | |
| MarketCap: 633.87 Millions | |
| Recent Price: 55.23 Smart Investing & Trading Score: 10 | |
| Day Percent Change: 1.06% Day Change: 0.58 | |
| Week Change: -6.06% Year-to-date Change: -32.3% | |
| JACK Links: Profile News Message Board | |
| Charts:- Daily , Weekly | |
| Add JACK to Watchlist: View: Get Complete JACK Trend Analysis ➞ | |
 | ITCI Intra-Cellular Therapies, Inc. |
| Sector: Health Care | |
| SubSector: Biotechnology | |
| MarketCap: 991.885 Millions | |
| Recent Price: 68.80 Smart Investing & Trading Score: 15 | |
| Day Percent Change: -2.19% Day Change: -1.54 | |
| Week Change: -6.09% Year-to-date Change: -3.9% | |
| ITCI Links: Profile News Message Board | |
| Charts:- Daily , Weekly | |
| Add ITCI to Watchlist: View: Get Complete ITCI Trend Analysis ➞ | |
 | CIFR Cipher Mining Inc. |
| Sector: Financials | |
| SubSector: Capital Markets | |
| MarketCap: 712 Millions | |
| Recent Price: 4.21 Smart Investing & Trading Score: 78 | |
| Day Percent Change: 6.18% Day Change: 0.25 | |
| Week Change: -6.24% Year-to-date Change: 2.4% | |
| CIFR Links: Profile News Message Board | |
| Charts:- Daily , Weekly | |
| Add CIFR to Watchlist: View: Get Complete CIFR Trend Analysis ➞ | |
 | MBI MBIA Inc. |
| Sector: Financials | |
| SubSector: Property & Casualty Insurance | |
| MarketCap: 539.012 Millions | |
| Recent Price: 6.38 Smart Investing & Trading Score: 64 | |
| Day Percent Change: -1.69% Day Change: -0.11 | |
| Week Change: -6.45% Year-to-date Change: 4.3% | |
| MBI Links: Profile News Message Board | |
| Charts:- Daily , Weekly | |
| Add MBI to Watchlist: View: Get Complete MBI Trend Analysis ➞ | |
 | AESI Atlas Energy Solutions Inc. |
| Sector: Energy | |
| SubSector: Oil & Gas Equipment & Services | |
| MarketCap: 947 Millions | |
| Recent Price: 21.87 Smart Investing & Trading Score: 36 | |
| Day Percent Change: -1.26% Day Change: -0.28 | |
| Week Change: -6.66% Year-to-date Change: 27.8% | |
| AESI Links: Profile News Message Board | |
| Charts:- Daily , Weekly | |
| Add AESI to Watchlist: View: Get Complete AESI Trend Analysis ➞ | |
 | IAUX i-80 Gold Corp. |
| Sector: Materials | |
| SubSector: Gold | |
| MarketCap: 616 Millions | |
| Recent Price: 1.22 Smart Investing & Trading Score: 47 | |
| Day Percent Change: -0.41% Day Change: -0.01 | |
| Week Change: -6.87% Year-to-date Change: -30.3% | |
| IAUX Links: Profile News Message Board | |
| Charts:- Daily , Weekly | |
| Add IAUX to Watchlist: View: Get Complete IAUX Trend Analysis ➞ | |
 | UIS Unisys Corporation |
| Sector: Technology | |
| SubSector: Information Technology Services | |
| MarketCap: 803.868 Millions | |
| Recent Price: 5.08 Smart Investing & Trading Score: 0 | |
| Day Percent Change: -3.05% Day Change: -0.16 | |
| Week Change: -6.96% Year-to-date Change: -9.6% | |
| UIS Links: Profile News Message Board | |
| Charts:- Daily , Weekly | |
| Add UIS to Watchlist: View: Get Complete UIS Trend Analysis ➞ | |
 | VREX Varex Imaging Corporation |
| Sector: Health Care | |
| SubSector: Medical Appliances & Equipment | |
| MarketCap: 718.78 Millions | |
| Recent Price: 15.59 Smart Investing & Trading Score: 0 | |
| Day Percent Change: -5.11% Day Change: -0.84 | |
| Week Change: -7.15% Year-to-date Change: -24.0% | |
| VREX Links: Profile News Message Board | |
| Charts:- Daily , Weekly | |
| Add VREX to Watchlist: View: Get Complete VREX Trend Analysis ➞ | |
 | SIG Signet Jewelers Limited |
| Sector: Services & Goods | |
| SubSector: Jewelry Stores | |
| MarketCap: 518.1 Millions | |
| Recent Price: 94.35 Smart Investing & Trading Score: 0 | |
| Day Percent Change: -3.13% Day Change: -3.05 | |
| Week Change: -7.32% Year-to-date Change: -12.0% | |
| SIG Links: Profile News Message Board | |
| Charts:- Daily , Weekly | |
| Add SIG to Watchlist: View: Get Complete SIG Trend Analysis ➞ | |
 | CHCT Community Healthcare Trust Incorporated |
| Sector: Financials | |
| SubSector: REIT - Healthcare Facilities | |
| MarketCap: 698.614 Millions | |
| Recent Price: 24.37 Smart Investing & Trading Score: 10 | |
| Day Percent Change: -2.21% Day Change: -0.55 | |
| Week Change: -7.44% Year-to-date Change: -8.5% | |
| CHCT Links: Profile News Message Board | |
| Charts:- Daily , Weekly | |
| Add CHCT to Watchlist: View: Get Complete CHCT Trend Analysis ➞ | |
 | HURN Huron Consulting Group Inc. |
| Sector: Services & Goods | |
| SubSector: Management Services | |
| MarketCap: 968.645 Millions | |
| Recent Price: 86.32 Smart Investing & Trading Score: 0 | |
| Day Percent Change: 0.79% Day Change: 0.68 | |
| Week Change: -7.81% Year-to-date Change: -16.0% | |
| HURN Links: Profile News Message Board | |
| Charts:- Daily , Weekly | |
| Add HURN to Watchlist: View: Get Complete HURN Trend Analysis ➞ | |
 | PWP Perella Weinberg Partners |
| Sector: Financials | |
| SubSector: Capital Markets | |
| MarketCap: 705 Millions | |
| Recent Price: 13.95 Smart Investing & Trading Score: 26 | |
| Day Percent Change: -8.67% Day Change: -1.33 | |
| Week Change: -8.88% Year-to-date Change: 13.0% | |
| PWP Links: Profile News Message Board | |
| Charts:- Daily , Weekly | |
| Add PWP to Watchlist: View: Get Complete PWP Trend Analysis ➞ | |
 | HMST HomeStreet, Inc. |
| Sector: Financials | |
| SubSector: Savings & Loans | |
| MarketCap: 535.33 Millions | |
| Recent Price: 10.98 Smart Investing & Trading Score: 22 | |
| Day Percent Change: 1.48% Day Change: 0.16 | |
| Week Change: -8.88% Year-to-date Change: 6.6% | |
| HMST Links: Profile News Message Board | |
| Charts:- Daily , Weekly | |
| Add HMST to Watchlist: View: Get Complete HMST Trend Analysis ➞ | |
 | JOUT Johnson Outdoors Inc. |
| Sector: Consumer Staples | |
| SubSector: Sporting Goods | |
| MarketCap: 572.844 Millions | |
| Recent Price: 37.83 Smart Investing & Trading Score: 0 | |
| Day Percent Change: -11.22% Day Change: -4.78 | |
| Week Change: -9.39% Year-to-date Change: -29.2% | |
| JOUT Links: Profile News Message Board | |
| Charts:- Daily , Weekly | |
| Add JOUT to Watchlist: View: Get Complete JOUT Trend Analysis ➞ | |
 | SAH Sonic Automotive, Inc. |
| Sector: Services & Goods | |
| SubSector: Auto Dealerships | |
| MarketCap: 581.321 Millions | |
| Recent Price: 56.43 Smart Investing & Trading Score: 63 | |
| Day Percent Change: -1.14% Day Change: -0.65 | |
| Week Change: -9.42% Year-to-date Change: 0.4% | |
| SAH Links: Profile News Message Board | |
| Charts:- Daily , Weekly | |
| Add SAH to Watchlist: View: Get Complete SAH Trend Analysis ➞ | |
| For tabular summary view of above stock list: Summary View ➞ 0 - 25 , 25 - 50 , 50 - 75 , 75 - 100 , 100 - 125 , 125 - 150 , 150 - 175 , 175 - 200 , 200 - 225 , 225 - 250 , 250 - 275 , 275 - 300 , 300 - 325 , 325 - 350 | ||
| Click To Change The Sort Order: By Market Cap or Company Size Performance: Year-to-date, Week and Day | |
| Select Chart Type: | ||
| Too many stocks? View smallcap stocks filtered by marketcap & sector |
| Marketcap: All SmallCap Stocks (default-no microcap), Large, Mid-Range, Small & MicroCap |
| Sector: Tech, Finance, Energy, Staples, Retail, Industrial, Materials, Utilities & Medical |
|
Best Stocks Today 12Stocks.com |
© 2024 12Stocks.com Terms & Conditions Privacy Contact Us
All Information Provided Only For Education And Not To Be Used For Investing or Trading. See Terms & Conditions


One More Thing ... Get Best Stocks Delivered Daily!
Never Ever Miss A Move With Our Top Ten Stocks Lists
Find Best Stocks In Any Market - Bull or Bear Market
Take A Peek At Our Top Ten Stocks Lists: Daily, Weekly, Year-to-Date & Top Trends
Find Best Stocks In Any Market - Bull or Bear Market
Take A Peek At Our Top Ten Stocks Lists: Daily, Weekly, Year-to-Date & Top Trends
Smallcap Stocks With Best Up Trends [0-bearish to 100-bullish]: Twist Bioscience[100], WideOpenWest [100], Joint [100], FTC Solar[100], Origin Materials[100], Alignment Healthcare[100], Clarus [100], IES [100], Emergent BioSolutions[100], Enovix [100], El Pollo[100]
Best Smallcap Stocks Year-to-Date:
Janux [482.74%], Viking [313.59%], Longboard [272.5%], Alpine Immune[239.29%], Bakkt [199.55%], Avidity Biosciences[192.48%], Vera [189.47%], Cullinan Oncology[176.9%], Super Micro[175.35%], Y-mAbs [151.47%], Sana [149.33%] Best Smallcap Stocks This Week:
Emergent BioSolutions[102.6%], Deciphera [73.24%], Origin Materials[66.52%], Eyenovia [60.78%], Cue Biopharma[56.04%], Aspen Aerogels[55.96%], Enovix [54.02%], Luna Innovations[53.77%], Codexis [47.37%], Carvana Co[44.31%], Office Properties[42.79%] Best Smallcap Stocks Daily:
Luna Innovations[36.00%], Twist Bioscience[28.74%], Ardelyx [28.42%], WideOpenWest [28.23%], 2U [26.63%], Joint [25.35%], FTC Solar[25.09%], Origin Materials[22.23%], Alignment Healthcare[21.97%], Clarus [18.67%], Aurora Innovation[18.09%]