
 Login Sign Up


| |||||
 |  | ||||

| 12Stocks.com Market Intelligence |
Best SmallCap Stocks
|
| In a hurry? Small Cap Stock Lists: Performance Trends Table, Stock Charts
Sort Small Cap stocks: Daily, Weekly, Year-to-Date, Market Cap & Trends. Filter Small Cap stocks list by sector: Show all, Tech, Finance, Energy, Staples, Retail, Industrial, Materials, Utilities and HealthCare Filter Small Cap stocks list by size: All Large Medium Small and MicroCap |
| 12Stocks.com Small Cap Stocks Performances & Trends Daily | |||||||||
|
|  The overall Smart Investing & Trading Score is 69 (0-bearish to 100-bullish) which puts Small Cap index in short term neutral to bullish trend. The Smart Investing & Trading Score from previous trading session is 49 and hence an improvement of trend.
| ||||||||
Here are the Smart Investing & Trading Scores of the most requested small cap stocks at 12Stocks.com (click stock name for detailed review):
|


| 12Stocks.com: Investing in Smallcap Index with Stocks | |
|
The following table helps investors and traders sort through current performance and trends (as measured by Smart Investing & Trading Score) of various
stocks in the Smallcap Index. Quick View: Move mouse or cursor over stock symbol (ticker) to view short-term technical chart and over stock name to view long term chart. Click on  to add stock symbol to your watchlist and to add stock symbol to your watchlist and  to view watchlist. Click on any ticker or stock name for detailed market intelligence report for that stock. to view watchlist. Click on any ticker or stock name for detailed market intelligence report for that stock. |
12Stocks.com Performance of Stocks in Smallcap Index
| Ticker | Stock Name | Watchlist | Category | Recent Price | Smart Investing & Trading Score | Change % | YTD Change% |
| IPAR | Inter Parfums |   | Consumer Staples | 119.11 | 32 | 0.46 | -17.29% |
| ASB | Associated Banc-Corp | | Financials | 21.97 | 100 | 0.46 | 2.71% |
| INST | Instructure | | Technology | 19.65 | 49 | 0.46 | -27.25% |
| SANM | Sanmina | | Technology | 61.76 | 54 | 0.44 | 20.23% |
| NHI | National Health | | Financials | 64.72 | 100 | 0.43 | 15.88% |
| DH | Definitive Healthcare | | Health Care | 7.01 | 47 | 0.43 | -30.39% |
| AX | Axos Financial | | Financials | 57.53 | 100 | 0.42 | 5.37% |
| AUB | Atlantic Union | | Financials | 33.48 | 82 | 0.42 | -8.37% |
| UBSI | United Bankshares | | Financials | 33.96 | 67 | 0.41 | -9.56% |
| SSB | South State | | Financials | 78.57 | 42 | 0.41 | -6.96% |
| CNX | CNX Resources | | Energy | 23.29 | 43 | 0.39 | 16.45% |
| CRVL | CorVel | | Financials | 242.51 | 70 | 0.39 | -1.90% |
| PAX | Patria s | | Financials | 12.83 | 7 | 0.39 | -18.23% |
| MFA | MFA Financial | | Financials | 10.95 | 74 | 0.37 | -2.84% |
| FULT | Fulton Financial | | Financials | 17.03 | 95 | 0.35 | 3.46% |
| CRC | California Resources | | Energy | 51.68 | 10 | 0.35 | -5.49% |
| NWE | NorthWestern | | Utilities | 51.18 | 100 | 0.35 | 0.57% |
| INBX | Inhibrx | | Health Care | 34.13 | 25 | 0.35 | -10.21% |
| NJR | New Jersey | | Utilities | 44.70 | 100 | 0.34 | 0.27% |
| EPRT | Essential Properties | | Financials | 26.91 | 100 | 0.34 | 5.28% |
| ULCC | Frontier Group | | Industrials | 5.92 | 27 | 0.34 | 9.02% |
| DRQ | Dril-Quip | | Energy | 18.60 | 32 | 0.32 | -20.07% |
| MGRC | McGrath RentCorp | | Transports | 109.00 | 39 | 0.32 | -8.88% |
| BBIO | BridgeBio Pharma | | Health Care | 27.83 | 64 | 0.32 | -31.06% |
| DYN | Dyne | | Health Care | 26.08 | 34 | 0.31 | 96.09% |
| For chart view version of above stock list: Chart View ➞ 0 - 25 , 25 - 50 , 50 - 75 , 75 - 100 , 100 - 125 , 125 - 150 , 150 - 175 , 175 - 200 , 200 - 225 , 225 - 250 , 250 - 275 , 275 - 300 , 300 - 325 , 325 - 350 , 350 - 375 , 375 - 400 , 400 - 425 , 425 - 450 , 450 - 475 , 475 - 500 , 500 - 525 , 525 - 550 , 550 - 575 , 575 - 600 , 600 - 625 , 625 - 650 , 650 - 675 , 675 - 700 | ||
 | Click To Change The Sort Order: By Market Cap or Company Size Performance: Year-to-date, Week and Day |  |
| Too many stocks? View smallcap stocks filtered by marketcap & sector |
| Marketcap: All SmallCap Stocks (default-no microcap), Large, Mid-Range, Small |
| Smallcap Sector: Tech, Finance, Energy, Staples, Retail, Industrial, Materials, & Medical |
|
Get the most comprehensive stock market coverage daily at 12Stocks.com ➞ Best Stocks Today ➞ Best Stocks Weekly ➞ Best Stocks Year-to-Date ➞ Best Stocks Trends ➞  Best Stocks Today 12Stocks.com Best Nasdaq Stocks ➞ Best S&P 500 Stocks ➞ Best Tech Stocks ➞ Best Biotech Stocks ➞ |
| Detailed Overview of SmallCap Stocks |
| SmallCap Technical Overview, Leaders & Laggards, Top SmallCap ETF Funds & Detailed SmallCap Stocks List, Charts, Trends & More |
| Smallcap: Technical Analysis, Trends & YTD Performance | |
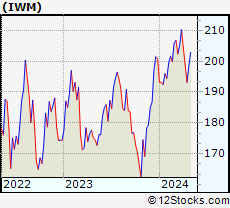
| SmallCap segment as represented by
IWM, an exchange-traded fund [ETF], holds basket of thousands of smallcap stocks from across all major sectors of the US stock market. The smallcap index (contains stocks like Riverbed & Sotheby's) is up by 0.59% and is currently underperforming the overall market by -6.29% year-to-date. Below is a quick view of technical charts and trends: | |
 IWM Weekly Chart |
|
| Long Term Trend: Not Good | |
| Medium Term Trend: Very Good | |
 IWM Daily Chart |
|
| Short Term Trend: Very Good | |
| Overall Trend Score: 69 | |
| YTD Performance: 0.59% | |
| **Trend Scores & Views Are Only For Educational Purposes And Not For Investing | |
| 12Stocks.com: Top Performing Small Cap Index Stocks | ||||||||||||||||||||||||||||||||||||||||||||||||
 The top performing Small Cap Index stocks year to date are
Now, more recently, over last week, the top performing Small Cap Index stocks on the move are


|
||||||||||||||||||||||||||||||||||||||||||||||||
| 12Stocks.com: Investing in Smallcap Index using Exchange Traded Funds | |
|
The following table shows list of key exchange traded funds (ETF) that
help investors track Smallcap index. The following list also includes leveraged ETF funds that track twice or thrice the daily returns of Smallcap indices. Short or inverse ETF funds move in the opposite direction to the index they track and are useful during market pullbacks or during bear markets. Quick View: Move mouse or cursor over ETF symbol (ticker) to view short-term technical chart and over ETF name to view long term chart. Click on ticker or stock name for detailed view. Click on to add stock symbol to your watchlist and to view watchlist. |
12Stocks.com List of ETFs that track Smallcap Index
| Ticker | ETF Name | Watchlist | Recent Price | Smart Investing & Trading Score | Change % | Week % | Year-to-date % |
| IWM | iShares Russell 2000 | | 201.90 | 69 | 0.99 | 1.77 | 0.59% |
| IJR | iShares Core S&P Small-Cap | | 107.13 | 82 | 0.75 | 1.4 | -1.03% |
| VTWO | Vanguard Russell 2000 ETF | | 81.61 | 69 | 0.94 | 1.73 | 0.63% |
| IWN | iShares Russell 2000 Value | | 154.21 | 100 | 0.87 | 2.03 | -0.72% |
| IJS | iShares S&P Small-Cap 600 Value | | 98.72 | 64 | 0.71 | 1.57 | -4.22% |
| IWO | iShares Russell 2000 Growth | | 256.87 | 57 | 0.99 | 1.49 | 1.84% |
| IJT | iShares S&P Small-Cap 600 Growth | | 127.76 | 95 | 0.82 | 1.32 | 2.09% |
| XSLV | PowerShares S&P SmallCap Low Volatil ETF | | 43.22 | 87 | 0.19 | 1.17 | -2.11% |
| SBB | ProShares Short SmallCap600 | | 16.16 | 13 | -1.28 | -1.37 | 1.44% |
| SDD | ProShares UltraShort SmallCap600 | | 18.84 | 23 | -2.41 | -2.61 | 2.27% |
| SAA | ProShares Ultra SmallCap600 | | 23.59 | 69 | 2.86 | 2.39 | -5.45% |
| SMLV | SPDR SSGA US Small Cap Low Volatil ETF | | 109.69 | 87 | 0.78 | 2.01 | -2.52% |
| 12Stocks.com: Charts, Trends, Fundamental Data and Performances of SmallCap Stocks | |
|
We now take in-depth look at all SmallCap stocks including charts, multi-period performances and overall trends (as measured by Smart Investing & Trading Score). One can sort SmallCap stocks (click link to choose) by Daily, Weekly and by Year-to-Date performances. Also, one can sort by size of the company or by market capitalization. |
| Select Your Default Chart Type: | |||||
| |||||
| Click on stock symbol or name for detailed view. Click on to add stock symbol to your watchlist and to view watchlist. Quick View: Move mouse or cursor over "Daily" to quickly view daily technical stock chart and over "Weekly" to view weekly technical stock chart. | |||||

 | IPAR Inter Parfums, Inc. |
| Sector: Consumer Staples | |
| SubSector: Personal Products | |
| MarketCap: 1302.55 Millions | |
| Recent Price: 119.11 Smart Investing & Trading Score: 32 | |
| Day Percent Change: 0.46% Day Change: 0.55 | |
| Week Change: -0.38% Year-to-date Change: -17.3% | |
| IPAR Links: Profile News Message Board | |
| Charts:- Daily , Weekly | |
| Add IPAR to Watchlist: View: Get Complete IPAR Trend Analysis ➞ | |
 | ASB Associated Banc-Corp |
| Sector: Financials | |
| SubSector: Regional - Midwest Banks | |
| MarketCap: 1904.8 Millions | |
| Recent Price: 21.97 Smart Investing & Trading Score: 100 | |
| Day Percent Change: 0.46% Day Change: 0.10 | |
| Week Change: 1.85% Year-to-date Change: 2.7% | |
| ASB Links: Profile News Message Board | |
| Charts:- Daily , Weekly | |
| Add ASB to Watchlist: View: Get Complete ASB Trend Analysis ➞ | |
 | INST Instructure Holdings, Inc. |
| Sector: Technology | |
| SubSector: Software - Application | |
| MarketCap: 3580 Millions | |
| Recent Price: 19.65 Smart Investing & Trading Score: 49 | |
| Day Percent Change: 0.46% Day Change: 0.09 | |
| Week Change: 0% Year-to-date Change: -27.3% | |
| INST Links: Profile News Message Board | |
| Charts:- Daily , Weekly | |
| Add INST to Watchlist: View: Get Complete INST Trend Analysis ➞ | |
 | SANM Sanmina Corporation |
| Sector: Technology | |
| SubSector: Diversified Electronics | |
| MarketCap: 1790.36 Millions | |
| Recent Price: 61.76 Smart Investing & Trading Score: 54 | |
| Day Percent Change: 0.44% Day Change: 0.27 | |
| Week Change: -1.92% Year-to-date Change: 20.2% | |
| SANM Links: Profile News Message Board | |
| Charts:- Daily , Weekly | |
| Add SANM to Watchlist: View: Get Complete SANM Trend Analysis ➞ | |
 | NHI National Health Investors, Inc. |
| Sector: Financials | |
| SubSector: REIT - Healthcare Facilities | |
| MarketCap: 2156.54 Millions | |
| Recent Price: 64.72 Smart Investing & Trading Score: 100 | |
| Day Percent Change: 0.43% Day Change: 0.28 | |
| Week Change: 2.91% Year-to-date Change: 15.9% | |
| NHI Links: Profile News Message Board | |
| Charts:- Daily , Weekly | |
| Add NHI to Watchlist: View: Get Complete NHI Trend Analysis ➞ | |
 | DH Definitive Healthcare Corp. |
| Sector: Health Care | |
| SubSector: Health Information Services | |
| MarketCap: 1690 Millions | |
| Recent Price: 7.01 Smart Investing & Trading Score: 47 | |
| Day Percent Change: 0.43% Day Change: 0.03 | |
| Week Change: 0.29% Year-to-date Change: -30.4% | |
| DH Links: Profile News Message Board | |
| Charts:- Daily , Weekly | |
| Add DH to Watchlist: View: Get Complete DH Trend Analysis ➞ | |
 | AX Axos Financial, Inc. |
| Sector: Financials | |
| SubSector: Savings & Loans | |
| MarketCap: 1037.3 Millions | |
| Recent Price: 57.53 Smart Investing & Trading Score: 100 | |
| Day Percent Change: 0.42% Day Change: 0.24 | |
| Week Change: 8.44% Year-to-date Change: 5.4% | |
| AX Links: Profile News Message Board | |
| Charts:- Daily , Weekly | |
| Add AX to Watchlist: View: Get Complete AX Trend Analysis ➞ | |
 | AUB Atlantic Union Bankshares Corporation |
| Sector: Financials | |
| SubSector: Regional - Mid-Atlantic Banks | |
| MarketCap: 1728.79 Millions | |
| Recent Price: 33.48 Smart Investing & Trading Score: 82 | |
| Day Percent Change: 0.42% Day Change: 0.14 | |
| Week Change: 3.72% Year-to-date Change: -8.4% | |
| AUB Links: Profile News Message Board | |
| Charts:- Daily , Weekly | |
| Add AUB to Watchlist: View: Get Complete AUB Trend Analysis ➞ | |
 | UBSI United Bankshares, Inc. |
| Sector: Financials | |
| SubSector: Regional - Mid-Atlantic Banks | |
| MarketCap: 2286.79 Millions | |
| Recent Price: 33.96 Smart Investing & Trading Score: 67 | |
| Day Percent Change: 0.41% Day Change: 0.14 | |
| Week Change: 1.83% Year-to-date Change: -9.6% | |
| UBSI Links: Profile News Message Board | |
| Charts:- Daily , Weekly | |
| Add UBSI to Watchlist: View: Get Complete UBSI Trend Analysis ➞ | |
 | SSB South State Corporation |
| Sector: Financials | |
| SubSector: Regional - Mid-Atlantic Banks | |
| MarketCap: 2113.49 Millions | |
| Recent Price: 78.57 Smart Investing & Trading Score: 42 | |
| Day Percent Change: 0.41% Day Change: 0.32 | |
| Week Change: 0.8% Year-to-date Change: -7.0% | |
| SSB Links: Profile News Message Board | |
| Charts:- Daily , Weekly | |
| Add SSB to Watchlist: View: Get Complete SSB Trend Analysis ➞ | |
 | CNX CNX Resources Corporation |
| Sector: Energy | |
| SubSector: Independent Oil & Gas | |
| MarketCap: 1344.33 Millions | |
| Recent Price: 23.29 Smart Investing & Trading Score: 43 | |
| Day Percent Change: 0.39% Day Change: 0.09 | |
| Week Change: -2.96% Year-to-date Change: 16.5% | |
| CNX Links: Profile News Message Board | |
| Charts:- Daily , Weekly | |
| Add CNX to Watchlist: View: Get Complete CNX Trend Analysis ➞ | |
 | CRVL CorVel Corporation |
| Sector: Financials | |
| SubSector: Insurance Brokers | |
| MarketCap: 1090.67 Millions | |
| Recent Price: 242.51 Smart Investing & Trading Score: 70 | |
| Day Percent Change: 0.39% Day Change: 0.94 | |
| Week Change: 1.62% Year-to-date Change: -1.9% | |
| CRVL Links: Profile News Message Board | |
| Charts:- Daily , Weekly | |
| Add CRVL to Watchlist: View: Get Complete CRVL Trend Analysis ➞ | |
 | PAX Patria Investments Limited |
| Sector: Financials | |
| SubSector: Asset Management | |
| MarketCap: 2130 Millions | |
| Recent Price: 12.83 Smart Investing & Trading Score: 7 | |
| Day Percent Change: 0.39% Day Change: 0.05 | |
| Week Change: -5.59% Year-to-date Change: -18.2% | |
| PAX Links: Profile News Message Board | |
| Charts:- Daily , Weekly | |
| Add PAX to Watchlist: View: Get Complete PAX Trend Analysis ➞ | |
 | MFA MFA Financial, Inc. |
| Sector: Financials | |
| SubSector: Mortgage Investment | |
| MarketCap: 1869.69 Millions | |
| Recent Price: 10.95 Smart Investing & Trading Score: 74 | |
| Day Percent Change: 0.37% Day Change: 0.04 | |
| Week Change: 2.05% Year-to-date Change: -2.8% | |
| MFA Links: Profile News Message Board | |
| Charts:- Daily , Weekly | |
| Add MFA to Watchlist: View: Get Complete MFA Trend Analysis ➞ | |
 | FULT Fulton Financial Corporation |
| Sector: Financials | |
| SubSector: Regional - Northeast Banks | |
| MarketCap: 2030.89 Millions | |
| Recent Price: 17.03 Smart Investing & Trading Score: 95 | |
| Day Percent Change: 0.35% Day Change: 0.06 | |
| Week Change: 9.03% Year-to-date Change: 3.5% | |
| FULT Links: Profile News Message Board | |
| Charts:- Daily , Weekly | |
| Add FULT to Watchlist: View: Get Complete FULT Trend Analysis ➞ | |
 | CRC California Resources Corporation |
| Sector: Energy | |
| SubSector: Oil & Gas E&P | |
| MarketCap: 18247 Millions | |
| Recent Price: 51.68 Smart Investing & Trading Score: 10 | |
| Day Percent Change: 0.35% Day Change: 0.18 | |
| Week Change: -5.87% Year-to-date Change: -5.5% | |
| CRC Links: Profile News Message Board | |
| Charts:- Daily , Weekly | |
| Add CRC to Watchlist: View: Get Complete CRC Trend Analysis ➞ | |
 | NWE NorthWestern Corporation |
| Sector: Utilities | |
| SubSector: Diversified Utilities | |
| MarketCap: 2801.8 Millions | |
| Recent Price: 51.18 Smart Investing & Trading Score: 100 | |
| Day Percent Change: 0.35% Day Change: 0.18 | |
| Week Change: 3.29% Year-to-date Change: 0.6% | |
| NWE Links: Profile News Message Board | |
| Charts:- Daily , Weekly | |
| Add NWE to Watchlist: View: Get Complete NWE Trend Analysis ➞ | |
 | INBX Inhibrx, Inc. |
| Sector: Health Care | |
| SubSector: Biotechnology | |
| MarketCap: 14187 Millions | |
| Recent Price: 34.13 Smart Investing & Trading Score: 25 | |
| Day Percent Change: 0.35% Day Change: 0.12 | |
| Week Change: 0.21% Year-to-date Change: -10.2% | |
| INBX Links: Profile News Message Board | |
| Charts:- Daily , Weekly | |
| Add INBX to Watchlist: View: Get Complete INBX Trend Analysis ➞ | |
 | NJR New Jersey Resources Corporation |
| Sector: Utilities | |
| SubSector: Gas Utilities | |
| MarketCap: 3320.27 Millions | |
| Recent Price: 44.70 Smart Investing & Trading Score: 100 | |
| Day Percent Change: 0.34% Day Change: 0.15 | |
| Week Change: 3.14% Year-to-date Change: 0.3% | |
| NJR Links: Profile News Message Board | |
| Charts:- Daily , Weekly | |
| Add NJR to Watchlist: View: Get Complete NJR Trend Analysis ➞ | |
 | EPRT Essential Properties Realty Trust, Inc. |
| Sector: Financials | |
| SubSector: REIT - Diversified | |
| MarketCap: 1424.43 Millions | |
| Recent Price: 26.91 Smart Investing & Trading Score: 100 | |
| Day Percent Change: 0.34% Day Change: 0.09 | |
| Week Change: 4.75% Year-to-date Change: 5.3% | |
| EPRT Links: Profile News Message Board | |
| Charts:- Daily , Weekly | |
| Add EPRT to Watchlist: View: Get Complete EPRT Trend Analysis ➞ | |
 | ULCC Frontier Group Holdings, Inc. |
| Sector: Industrials | |
| SubSector: Airlines | |
| MarketCap: 2160 Millions | |
| Recent Price: 5.92 Smart Investing & Trading Score: 27 | |
| Day Percent Change: 0.34% Day Change: 0.02 | |
| Week Change: -3.27% Year-to-date Change: 9.0% | |
| ULCC Links: Profile News Message Board | |
| Charts:- Daily , Weekly | |
| Add ULCC to Watchlist: View: Get Complete ULCC Trend Analysis ➞ | |
 | DRQ Dril-Quip, Inc. |
| Sector: Energy | |
| SubSector: Oil & Gas Equipment & Services | |
| MarketCap: 1211.61 Millions | |
| Recent Price: 18.60 Smart Investing & Trading Score: 32 | |
| Day Percent Change: 0.32% Day Change: 0.06 | |
| Week Change: -6.58% Year-to-date Change: -20.1% | |
| DRQ Links: Profile News Message Board | |
| Charts:- Daily , Weekly | |
| Add DRQ to Watchlist: View: Get Complete DRQ Trend Analysis ➞ | |
 | MGRC McGrath RentCorp |
| Sector: Transports | |
| SubSector: Rental & Leasing Services | |
| MarketCap: 1289.04 Millions | |
| Recent Price: 109.00 Smart Investing & Trading Score: 39 | |
| Day Percent Change: 0.32% Day Change: 0.35 | |
| Week Change: -2.43% Year-to-date Change: -8.9% | |
| MGRC Links: Profile News Message Board | |
| Charts:- Daily , Weekly | |
| Add MGRC to Watchlist: View: Get Complete MGRC Trend Analysis ➞ | |
 | BBIO BridgeBio Pharma, Inc. |
| Sector: Health Care | |
| SubSector: Biotechnology | |
| MarketCap: 3879.35 Millions | |
| Recent Price: 27.83 Smart Investing & Trading Score: 64 | |
| Day Percent Change: 0.32% Day Change: 0.09 | |
| Week Change: 11.86% Year-to-date Change: -31.1% | |
| BBIO Links: Profile News Message Board | |
| Charts:- Daily , Weekly | |
| Add BBIO to Watchlist: View: Get Complete BBIO Trend Analysis ➞ | |
 | DYN Dyne Therapeutics, Inc. |
| Sector: Health Care | |
| SubSector: Biotechnology | |
| MarketCap: 88487 Millions | |
| Recent Price: 26.08 Smart Investing & Trading Score: 34 | |
| Day Percent Change: 0.31% Day Change: 0.08 | |
| Week Change: 5.46% Year-to-date Change: 96.1% | |
| DYN Links: Profile News Message Board | |
| Charts:- Daily , Weekly | |
| Add DYN to Watchlist: View: Get Complete DYN Trend Analysis ➞ | |
| For tabular summary view of above stock list: Summary View ➞ 0 - 25 , 25 - 50 , 50 - 75 , 75 - 100 , 100 - 125 , 125 - 150 , 150 - 175 , 175 - 200 , 200 - 225 , 225 - 250 , 250 - 275 , 275 - 300 , 300 - 325 , 325 - 350 , 350 - 375 , 375 - 400 , 400 - 425 , 425 - 450 , 450 - 475 , 475 - 500 , 500 - 525 , 525 - 550 , 550 - 575 , 575 - 600 , 600 - 625 , 625 - 650 , 650 - 675 , 675 - 700 | ||
| Click To Change The Sort Order: By Market Cap or Company Size Performance: Year-to-date, Week and Day | |
| Select Chart Type: | ||
| Too many stocks? View smallcap stocks filtered by marketcap & sector |
| Marketcap: All SmallCap Stocks (default-no microcap), Large, Mid-Range, Small & MicroCap |
| Sector: Tech, Finance, Energy, Staples, Retail, Industrial, Materials, Utilities & Medical |
|
Best Stocks Today 12Stocks.com |
© 2024 12Stocks.com Terms & Conditions Privacy Contact Us
All Information Provided Only For Education And Not To Be Used For Investing or Trading. See Terms & Conditions


One More Thing ... Get Best Stocks Delivered Daily!
Never Ever Miss A Move With Our Top Ten Stocks Lists
Find Best Stocks In Any Market - Bull or Bear Market
Take A Peek At Our Top Ten Stocks Lists: Daily, Weekly, Year-to-Date & Top Trends
Find Best Stocks In Any Market - Bull or Bear Market
Take A Peek At Our Top Ten Stocks Lists: Daily, Weekly, Year-to-Date & Top Trends
Smallcap Stocks With Best Up Trends [0-bearish to 100-bullish]: Twist Bioscience[100], WideOpenWest [100], Joint [100], FTC Solar[100], Origin Materials[100], Alignment Healthcare[100], Clarus [100], IES [100], Emergent BioSolutions[100], Enovix [100], El Pollo[100]
Best Smallcap Stocks Year-to-Date:
Janux [482.74%], Viking [313.59%], Longboard [272.5%], Alpine Immune[239.29%], Bakkt [199.55%], Avidity Biosciences[192.48%], Vera [189.47%], Cullinan Oncology[176.9%], Super Micro[175.35%], Y-mAbs [151.47%], Sana [149.33%] Best Smallcap Stocks This Week:
Emergent BioSolutions[102.6%], Deciphera [73.24%], Origin Materials[66.52%], Eyenovia [60.78%], Cue Biopharma[56.04%], Aspen Aerogels[55.96%], Enovix [54.02%], Luna Innovations[53.77%], Codexis [47.37%], Carvana Co[44.31%], Office Properties[42.79%] Best Smallcap Stocks Daily:
Luna Innovations[36.00%], Twist Bioscience[28.74%], Ardelyx [28.42%], WideOpenWest [28.23%], 2U [26.63%], Joint [25.35%], FTC Solar[25.09%], Origin Materials[22.23%], Alignment Healthcare[21.97%], Clarus [18.67%], Aurora Innovation[18.09%]