
 Login Sign Up


| |||||
 |  | ||||

| 12Stocks.com Market Intelligence |
Best SmallCap Stocks
|
| In a hurry? Small Cap Stock Lists: Performance Trends Table, Stock Charts
Sort Small Cap stocks: Daily, Weekly, Year-to-Date, Market Cap & Trends. Filter Small Cap stocks list by sector: Show all, Tech, Finance, Energy, Staples, Retail, Industrial, Materials, Utilities and HealthCare Filter Small Cap stocks list by size: All Large Medium Small and MicroCap |
| 12Stocks.com Small Cap Stocks Performances & Trends Daily | |||||||||
|
|  The overall Smart Investing & Trading Score is 69 (0-bearish to 100-bullish) which puts Small Cap index in short term neutral to bullish trend. The Smart Investing & Trading Score from previous trading session is 49 and hence an improvement of trend.
| ||||||||
Here are the Smart Investing & Trading Scores of the most requested small cap stocks at 12Stocks.com (click stock name for detailed review):
|


| 12Stocks.com: Investing in Smallcap Index with Stocks | |
|
The following table helps investors and traders sort through current performance and trends (as measured by Smart Investing & Trading Score) of various
stocks in the Smallcap Index. Quick View: Move mouse or cursor over stock symbol (ticker) to view short-term technical chart and over stock name to view long term chart. Click on  to add stock symbol to your watchlist and to add stock symbol to your watchlist and  to view watchlist. Click on any ticker or stock name for detailed market intelligence report for that stock. to view watchlist. Click on any ticker or stock name for detailed market intelligence report for that stock. |
12Stocks.com Performance of Stocks in Smallcap Index
| Ticker | Stock Name | Watchlist | Category | Recent Price | Smart Investing & Trading Score | Change % | YTD Change% |
| STER | Sterling Check |   | Technology | 15.40 | 52 | 0.65 | 10.55% |
| BOH | Bank of Hawaii | | Financials | 58.86 | 69 | 0.63 | -18.77% |
| DDS | Dillard s | | Services & Goods | 434.00 | 55 | 0.63 | 7.52% |
| KAR | KAR Auction | | Services & Goods | 17.69 | 95 | 0.63 | 19.45% |
| ROCK | Gibraltar Industries | | Materials | 71.69 | 35 | 0.63 | -9.23% |
| GTN | Gray Television | | Services & Goods | 6.48 | 100 | 0.62 | -27.68% |
| FBRT | Franklin BSP | | Financials | 12.89 | 77 | 0.62 | -5.42% |
| COUR | Coursera | | Consumer Staples | 9.67 | 17 | 0.62 | -50.83% |
| HUBG | Hub Group | | Transports | 42.54 | 74 | 0.61 | -53.73% |
| CMPR | Cimpress | | Services & Goods | 83.09 | 17 | 0.61 | 3.80% |
| PKST | Peakstone Realty | | Financials | 14.10 | 93 | 0.61 | -31.31% |
| CHGG | Chegg | | Services & Goods | 5.24 | 27 | 0.58 | -53.87% |
| ASAN | Asana | | Technology | 15.72 | 64 | 0.58 | -17.31% |
| FFIN | First Financial | | Financials | 30.76 | 80 | 0.56 | 1.52% |
| ATKR | Atkore | | Industrials | 176.25 | 63 | 0.56 | 10.16% |
| MEG | Montrose Environmental | | Industrials | 44.51 | 88 | 0.54 | 38.40% |
| PSMT | PriceSmart | | Services & Goods | 82.46 | 59 | 0.54 | 8.81% |
| MAX | MediaAlpha | | Technology | 22.20 | 93 | 0.54 | 99.64% |
| JBLU | JetBlue Airways | | Transports | 5.80 | 37 | 0.52 | 4.50% |
| JJSF | J & J Snack Foods | | Consumer Staples | 138.24 | 43 | 0.52 | -17.29% |
| GOLF | Acushnet | | Services & Goods | 62.18 | 50 | 0.52 | -1.57% |
| ESNT | Essent Group | | Financials | 54.54 | 80 | 0.48 | 3.41% |
| SKYW | SkyWest | | Transports | 75.33 | 90 | 0.47 | 44.31% |
| NRIX | Nurix | | Health Care | 12.79 | 63 | 0.47 | 23.81% |
| GNW | Genworth Financial | | Financials | 6.49 | 100 | 0.46 | -2.84% |
| For chart view version of above stock list: Chart View ➞ 0 - 25 , 25 - 50 , 50 - 75 , 75 - 100 , 100 - 125 , 125 - 150 , 150 - 175 , 175 - 200 , 200 - 225 , 225 - 250 , 250 - 275 , 275 - 300 , 300 - 325 , 325 - 350 , 350 - 375 , 375 - 400 , 400 - 425 , 425 - 450 , 450 - 475 , 475 - 500 , 500 - 525 , 525 - 550 , 550 - 575 , 575 - 600 , 600 - 625 , 625 - 650 , 650 - 675 , 675 - 700 | ||
 | Click To Change The Sort Order: By Market Cap or Company Size Performance: Year-to-date, Week and Day |  |
| Too many stocks? View smallcap stocks filtered by marketcap & sector |
| Marketcap: All SmallCap Stocks (default-no microcap), Large, Mid-Range, Small |
| Smallcap Sector: Tech, Finance, Energy, Staples, Retail, Industrial, Materials, & Medical |
|
Get the most comprehensive stock market coverage daily at 12Stocks.com ➞ Best Stocks Today ➞ Best Stocks Weekly ➞ Best Stocks Year-to-Date ➞ Best Stocks Trends ➞  Best Stocks Today 12Stocks.com Best Nasdaq Stocks ➞ Best S&P 500 Stocks ➞ Best Tech Stocks ➞ Best Biotech Stocks ➞ |
| Detailed Overview of SmallCap Stocks |
| SmallCap Technical Overview, Leaders & Laggards, Top SmallCap ETF Funds & Detailed SmallCap Stocks List, Charts, Trends & More |
| Smallcap: Technical Analysis, Trends & YTD Performance | |
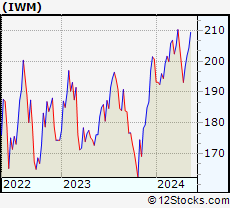
| SmallCap segment as represented by
IWM, an exchange-traded fund [ETF], holds basket of thousands of smallcap stocks from across all major sectors of the US stock market. The smallcap index (contains stocks like Riverbed & Sotheby's) is up by 0.59% and is currently underperforming the overall market by -6.29% year-to-date. Below is a quick view of technical charts and trends: | |
 IWM Weekly Chart |
|
| Long Term Trend: Not Good | |
| Medium Term Trend: Very Good | |
 IWM Daily Chart |
|
| Short Term Trend: Very Good | |
| Overall Trend Score: 69 | |
| YTD Performance: 0.59% | |
| **Trend Scores & Views Are Only For Educational Purposes And Not For Investing | |
| 12Stocks.com: Top Performing Small Cap Index Stocks | ||||||||||||||||||||||||||||||||||||||||||||||||
 The top performing Small Cap Index stocks year to date are
Now, more recently, over last week, the top performing Small Cap Index stocks on the move are


|
||||||||||||||||||||||||||||||||||||||||||||||||
| 12Stocks.com: Investing in Smallcap Index using Exchange Traded Funds | |
|
The following table shows list of key exchange traded funds (ETF) that
help investors track Smallcap index. The following list also includes leveraged ETF funds that track twice or thrice the daily returns of Smallcap indices. Short or inverse ETF funds move in the opposite direction to the index they track and are useful during market pullbacks or during bear markets. Quick View: Move mouse or cursor over ETF symbol (ticker) to view short-term technical chart and over ETF name to view long term chart. Click on ticker or stock name for detailed view. Click on to add stock symbol to your watchlist and to view watchlist. |
12Stocks.com List of ETFs that track Smallcap Index
| Ticker | ETF Name | Watchlist | Recent Price | Smart Investing & Trading Score | Change % | Week % | Year-to-date % |
| IWM | iShares Russell 2000 | | 201.90 | 69 | 0.99 | 1.77 | 0.59% |
| IJR | iShares Core S&P Small-Cap | | 107.13 | 82 | 0.75 | 1.4 | -1.03% |
| VTWO | Vanguard Russell 2000 ETF | | 81.61 | 69 | 0.94 | 1.73 | 0.63% |
| IWN | iShares Russell 2000 Value | | 154.21 | 100 | 0.87 | 2.03 | -0.72% |
| IJS | iShares S&P Small-Cap 600 Value | | 98.72 | 64 | 0.71 | 1.57 | -4.22% |
| IWO | iShares Russell 2000 Growth | | 256.87 | 57 | 0.99 | 1.49 | 1.84% |
| IJT | iShares S&P Small-Cap 600 Growth | | 127.76 | 95 | 0.82 | 1.32 | 2.09% |
| XSLV | PowerShares S&P SmallCap Low Volatil ETF | | 43.22 | 87 | 0.19 | 1.17 | -2.11% |
| SBB | ProShares Short SmallCap600 | | 16.16 | 13 | -1.28 | -1.37 | 1.44% |
| SDD | ProShares UltraShort SmallCap600 | | 18.84 | 23 | -2.41 | -2.61 | 2.27% |
| SAA | ProShares Ultra SmallCap600 | | 23.59 | 69 | 2.86 | 2.39 | -5.45% |
| SMLV | SPDR SSGA US Small Cap Low Volatil ETF | | 109.69 | 87 | 0.78 | 2.01 | -2.52% |
| 12Stocks.com: Charts, Trends, Fundamental Data and Performances of SmallCap Stocks | |
|
We now take in-depth look at all SmallCap stocks including charts, multi-period performances and overall trends (as measured by Smart Investing & Trading Score). One can sort SmallCap stocks (click link to choose) by Daily, Weekly and by Year-to-Date performances. Also, one can sort by size of the company or by market capitalization. |
| Select Your Default Chart Type: | |||||
| |||||
| Click on stock symbol or name for detailed view. Click on to add stock symbol to your watchlist and to view watchlist. Quick View: Move mouse or cursor over "Daily" to quickly view daily technical stock chart and over "Weekly" to view weekly technical stock chart. | |||||

 | STER Sterling Check Corp. |
| Sector: Technology | |
| SubSector: Software - Infrastructure | |
| MarketCap: 1180 Millions | |
| Recent Price: 15.40 Smart Investing & Trading Score: 52 | |
| Day Percent Change: 0.65% Day Change: 0.10 | |
| Week Change: 0.59% Year-to-date Change: 10.6% | |
| STER Links: Profile News Message Board | |
| Charts:- Daily , Weekly | |
| Add STER to Watchlist: View: Get Complete STER Trend Analysis ➞ | |
 | BOH Bank of Hawaii Corporation |
| Sector: Financials | |
| SubSector: Regional - Pacific Banks | |
| MarketCap: 2305.19 Millions | |
| Recent Price: 58.86 Smart Investing & Trading Score: 69 | |
| Day Percent Change: 0.63% Day Change: 0.37 | |
| Week Change: 0.39% Year-to-date Change: -18.8% | |
| BOH Links: Profile News Message Board | |
| Charts:- Daily , Weekly | |
| Add BOH to Watchlist: View: Get Complete BOH Trend Analysis ➞ | |
 | DDS Dillard s, Inc. |
| Sector: Services & Goods | |
| SubSector: Department Stores | |
| MarketCap: 1170.82 Millions | |
| Recent Price: 434.00 Smart Investing & Trading Score: 55 | |
| Day Percent Change: 0.63% Day Change: 2.70 | |
| Week Change: -3.33% Year-to-date Change: 7.5% | |
| DDS Links: Profile News Message Board | |
| Charts:- Daily , Weekly | |
| Add DDS to Watchlist: View: Get Complete DDS Trend Analysis ➞ | |
 | KAR KAR Auction Services, Inc. |
| Sector: Services & Goods | |
| SubSector: Specialty Retail, Other | |
| MarketCap: 1709.54 Millions | |
| Recent Price: 17.69 Smart Investing & Trading Score: 95 | |
| Day Percent Change: 0.63% Day Change: 0.11 | |
| Week Change: 1.55% Year-to-date Change: 19.5% | |
| KAR Links: Profile News Message Board | |
| Charts:- Daily , Weekly | |
| Add KAR to Watchlist: View: Get Complete KAR Trend Analysis ➞ | |
 | ROCK Gibraltar Industries, Inc. |
| Sector: Materials | |
| SubSector: Steel & Iron | |
| MarketCap: 1341.08 Millions | |
| Recent Price: 71.69 Smart Investing & Trading Score: 35 | |
| Day Percent Change: 0.63% Day Change: 0.45 | |
| Week Change: -0.79% Year-to-date Change: -9.2% | |
| ROCK Links: Profile News Message Board | |
| Charts:- Daily , Weekly | |
| Add ROCK to Watchlist: View: Get Complete ROCK Trend Analysis ➞ | |
 | GTN Gray Television, Inc. |
| Sector: Services & Goods | |
| SubSector: Broadcasting - TV | |
| MarketCap: 1144.63 Millions | |
| Recent Price: 6.48 Smart Investing & Trading Score: 100 | |
| Day Percent Change: 0.62% Day Change: 0.04 | |
| Week Change: 15.51% Year-to-date Change: -27.7% | |
| GTN Links: Profile News Message Board | |
| Charts:- Daily , Weekly | |
| Add GTN to Watchlist: View: Get Complete GTN Trend Analysis ➞ | |
 | FBRT Franklin BSP Realty Trust, Inc. |
| Sector: Financials | |
| SubSector: REIT - Mortgage | |
| MarketCap: 1170 Millions | |
| Recent Price: 12.89 Smart Investing & Trading Score: 77 | |
| Day Percent Change: 0.62% Day Change: 0.08 | |
| Week Change: 1.18% Year-to-date Change: -5.4% | |
| FBRT Links: Profile News Message Board | |
| Charts:- Daily , Weekly | |
| Add FBRT to Watchlist: View: Get Complete FBRT Trend Analysis ➞ | |
 | COUR Coursera, Inc. |
| Sector: Consumer Staples | |
| SubSector: Education & Training Services | |
| MarketCap: 1990 Millions | |
| Recent Price: 9.67 Smart Investing & Trading Score: 17 | |
| Day Percent Change: 0.62% Day Change: 0.06 | |
| Week Change: -19.21% Year-to-date Change: -50.8% | |
| COUR Links: Profile News Message Board | |
| Charts:- Daily , Weekly | |
| Add COUR to Watchlist: View: Get Complete COUR Trend Analysis ➞ | |
 | HUBG Hub Group, Inc. |
| Sector: Transports | |
| SubSector: Air Delivery & Freight Services | |
| MarketCap: 1503.88 Millions | |
| Recent Price: 42.54 Smart Investing & Trading Score: 74 | |
| Day Percent Change: 0.61% Day Change: 0.26 | |
| Week Change: 6.54% Year-to-date Change: -53.7% | |
| HUBG Links: Profile News Message Board | |
| Charts:- Daily , Weekly | |
| Add HUBG to Watchlist: View: Get Complete HUBG Trend Analysis ➞ | |
 | CMPR Cimpress plc |
| Sector: Services & Goods | |
| SubSector: Business Services | |
| MarketCap: 1675.02 Millions | |
| Recent Price: 83.09 Smart Investing & Trading Score: 17 | |
| Day Percent Change: 0.61% Day Change: 0.50 | |
| Week Change: -6.72% Year-to-date Change: 3.8% | |
| CMPR Links: Profile News Message Board | |
| Charts:- Daily , Weekly | |
| Add CMPR to Watchlist: View: Get Complete CMPR Trend Analysis ➞ | |
 | PKST Peakstone Realty Trust |
| Sector: Financials | |
| SubSector: REIT - Diversified | |
| MarketCap: 1050 Millions | |
| Recent Price: 14.10 Smart Investing & Trading Score: 93 | |
| Day Percent Change: 0.61% Day Change: 0.09 | |
| Week Change: 1.55% Year-to-date Change: -31.3% | |
| PKST Links: Profile News Message Board | |
| Charts:- Daily , Weekly | |
| Add PKST to Watchlist: View: Get Complete PKST Trend Analysis ➞ | |
 | CHGG Chegg, Inc. |
| Sector: Services & Goods | |
| SubSector: Education & Training Services | |
| MarketCap: 3606.86 Millions | |
| Recent Price: 5.24 Smart Investing & Trading Score: 27 | |
| Day Percent Change: 0.58% Day Change: 0.03 | |
| Week Change: -26.2% Year-to-date Change: -53.9% | |
| CHGG Links: Profile News Message Board | |
| Charts:- Daily , Weekly | |
| Add CHGG to Watchlist: View: Get Complete CHGG Trend Analysis ➞ | |
 | ASAN Asana, Inc. |
| Sector: Technology | |
| SubSector: Software Application | |
| MarketCap: 45087 Millions | |
| Recent Price: 15.72 Smart Investing & Trading Score: 64 | |
| Day Percent Change: 0.58% Day Change: 0.09 | |
| Week Change: 4.24% Year-to-date Change: -17.3% | |
| ASAN Links: Profile News Message Board | |
| Charts:- Daily , Weekly | |
| Add ASAN to Watchlist: View: Get Complete ASAN Trend Analysis ➞ | |
 | FFIN First Financial Bankshares, Inc. |
| Sector: Financials | |
| SubSector: Regional - Southwest Banks | |
| MarketCap: 3503.75 Millions | |
| Recent Price: 30.76 Smart Investing & Trading Score: 80 | |
| Day Percent Change: 0.56% Day Change: 0.17 | |
| Week Change: 1.32% Year-to-date Change: 1.5% | |
| FFIN Links: Profile News Message Board | |
| Charts:- Daily , Weekly | |
| Add FFIN to Watchlist: View: Get Complete FFIN Trend Analysis ➞ | |
 | ATKR Atkore International Group Inc. |
| Sector: Industrials | |
| SubSector: Industrial Electrical Equipment | |
| MarketCap: 1086.79 Millions | |
| Recent Price: 176.25 Smart Investing & Trading Score: 63 | |
| Day Percent Change: 0.56% Day Change: 0.99 | |
| Week Change: -3.68% Year-to-date Change: 10.2% | |
| ATKR Links: Profile News Message Board | |
| Charts:- Daily , Weekly | |
| Add ATKR to Watchlist: View: Get Complete ATKR Trend Analysis ➞ | |
 | MEG Montrose Environmental Group, Inc. |
| Sector: Industrials | |
| SubSector: Waste Management | |
| MarketCap: 71627 Millions | |
| Recent Price: 44.51 Smart Investing & Trading Score: 88 | |
| Day Percent Change: 0.54% Day Change: 0.24 | |
| Week Change: 3.25% Year-to-date Change: 38.4% | |
| MEG Links: Profile News Message Board | |
| Charts:- Daily , Weekly | |
| Add MEG to Watchlist: View: Get Complete MEG Trend Analysis ➞ | |
 | PSMT PriceSmart, Inc. |
| Sector: Services & Goods | |
| SubSector: Discount, Variety Stores | |
| MarketCap: 1655.72 Millions | |
| Recent Price: 82.46 Smart Investing & Trading Score: 59 | |
| Day Percent Change: 0.54% Day Change: 0.44 | |
| Week Change: 1.19% Year-to-date Change: 8.8% | |
| PSMT Links: Profile News Message Board | |
| Charts:- Daily , Weekly | |
| Add PSMT to Watchlist: View: Get Complete PSMT Trend Analysis ➞ | |
 | MAX MediaAlpha, Inc. |
| Sector: Technology | |
| SubSector: Internet Content & Information | |
| MarketCap: 22537 Millions | |
| Recent Price: 22.20 Smart Investing & Trading Score: 93 | |
| Day Percent Change: 0.54% Day Change: 0.12 | |
| Week Change: 17.71% Year-to-date Change: 99.6% | |
| MAX Links: Profile News Message Board | |
| Charts:- Daily , Weekly | |
| Add MAX to Watchlist: View: Get Complete MAX Trend Analysis ➞ | |
 | JBLU JetBlue Airways Corporation |
| Sector: Transports | |
| SubSector: Regional Airlines | |
| MarketCap: 2383.1 Millions | |
| Recent Price: 5.80 Smart Investing & Trading Score: 37 | |
| Day Percent Change: 0.52% Day Change: 0.03 | |
| Week Change: 0.35% Year-to-date Change: 4.5% | |
| JBLU Links: Profile News Message Board | |
| Charts:- Daily , Weekly | |
| Add JBLU to Watchlist: View: Get Complete JBLU Trend Analysis ➞ | |
 | JJSF J & J Snack Foods Corp. |
| Sector: Consumer Staples | |
| SubSector: Processed & Packaged Goods | |
| MarketCap: 2706.28 Millions | |
| Recent Price: 138.24 Smart Investing & Trading Score: 43 | |
| Day Percent Change: 0.52% Day Change: 0.72 | |
| Week Change: 1.15% Year-to-date Change: -17.3% | |
| JJSF Links: Profile News Message Board | |
| Charts:- Daily , Weekly | |
| Add JJSF to Watchlist: View: Get Complete JJSF Trend Analysis ➞ | |
 | GOLF Acushnet Holdings Corp. |
| Sector: Services & Goods | |
| SubSector: Sporting Goods Stores | |
| MarketCap: 1717.74 Millions | |
| Recent Price: 62.18 Smart Investing & Trading Score: 50 | |
| Day Percent Change: 0.52% Day Change: 0.32 | |
| Week Change: -0.08% Year-to-date Change: -1.6% | |
| GOLF Links: Profile News Message Board | |
| Charts:- Daily , Weekly | |
| Add GOLF to Watchlist: View: Get Complete GOLF Trend Analysis ➞ | |
 | ESNT Essent Group Ltd. |
| Sector: Financials | |
| SubSector: Mortgage Investment | |
| MarketCap: 2806.19 Millions | |
| Recent Price: 54.54 Smart Investing & Trading Score: 80 | |
| Day Percent Change: 0.48% Day Change: 0.26 | |
| Week Change: 1.04% Year-to-date Change: 3.4% | |
| ESNT Links: Profile News Message Board | |
| Charts:- Daily , Weekly | |
| Add ESNT to Watchlist: View: Get Complete ESNT Trend Analysis ➞ | |
 | SKYW SkyWest, Inc. |
| Sector: Transports | |
| SubSector: Regional Airlines | |
| MarketCap: 1394.7 Millions | |
| Recent Price: 75.33 Smart Investing & Trading Score: 90 | |
| Day Percent Change: 0.47% Day Change: 0.35 | |
| Week Change: 2.27% Year-to-date Change: 44.3% | |
| SKYW Links: Profile News Message Board | |
| Charts:- Daily , Weekly | |
| Add SKYW to Watchlist: View: Get Complete SKYW Trend Analysis ➞ | |
 | NRIX Nurix Therapeutics, Inc. |
| Sector: Health Care | |
| SubSector: Biotechnology | |
| MarketCap: 16787 Millions | |
| Recent Price: 12.79 Smart Investing & Trading Score: 63 | |
| Day Percent Change: 0.47% Day Change: 0.06 | |
| Week Change: 3.48% Year-to-date Change: 23.8% | |
| NRIX Links: Profile News Message Board | |
| Charts:- Daily , Weekly | |
| Add NRIX to Watchlist: View: Get Complete NRIX Trend Analysis ➞ | |
 | GNW Genworth Financial, Inc. |
| Sector: Financials | |
| SubSector: Life Insurance | |
| MarketCap: 1719.76 Millions | |
| Recent Price: 6.49 Smart Investing & Trading Score: 100 | |
| Day Percent Change: 0.46% Day Change: 0.03 | |
| Week Change: 8.35% Year-to-date Change: -2.8% | |
| GNW Links: Profile News Message Board | |
| Charts:- Daily , Weekly | |
| Add GNW to Watchlist: View: Get Complete GNW Trend Analysis ➞ | |
| For tabular summary view of above stock list: Summary View ➞ 0 - 25 , 25 - 50 , 50 - 75 , 75 - 100 , 100 - 125 , 125 - 150 , 150 - 175 , 175 - 200 , 200 - 225 , 225 - 250 , 250 - 275 , 275 - 300 , 300 - 325 , 325 - 350 , 350 - 375 , 375 - 400 , 400 - 425 , 425 - 450 , 450 - 475 , 475 - 500 , 500 - 525 , 525 - 550 , 550 - 575 , 575 - 600 , 600 - 625 , 625 - 650 , 650 - 675 , 675 - 700 | ||
| Click To Change The Sort Order: By Market Cap or Company Size Performance: Year-to-date, Week and Day | |
| Select Chart Type: | ||
| Too many stocks? View smallcap stocks filtered by marketcap & sector |
| Marketcap: All SmallCap Stocks (default-no microcap), Large, Mid-Range, Small & MicroCap |
| Sector: Tech, Finance, Energy, Staples, Retail, Industrial, Materials, Utilities & Medical |
|
Best Stocks Today 12Stocks.com |
© 2024 12Stocks.com Terms & Conditions Privacy Contact Us
All Information Provided Only For Education And Not To Be Used For Investing or Trading. See Terms & Conditions


One More Thing ... Get Best Stocks Delivered Daily!
Never Ever Miss A Move With Our Top Ten Stocks Lists
Find Best Stocks In Any Market - Bull or Bear Market
Take A Peek At Our Top Ten Stocks Lists: Daily, Weekly, Year-to-Date & Top Trends
Find Best Stocks In Any Market - Bull or Bear Market
Take A Peek At Our Top Ten Stocks Lists: Daily, Weekly, Year-to-Date & Top Trends
Smallcap Stocks With Best Up Trends [0-bearish to 100-bullish]: Twist Bioscience[100], WideOpenWest [100], Joint [100], FTC Solar[100], Origin Materials[100], Alignment Healthcare[100], Clarus [100], IES [100], Emergent BioSolutions[100], Enovix [100], El Pollo[100]
Best Smallcap Stocks Year-to-Date:
Janux [482.74%], Viking [313.59%], Longboard [272.5%], Alpine Immune[239.29%], Bakkt [199.55%], Avidity Biosciences[192.48%], Vera [189.47%], Cullinan Oncology[176.9%], Super Micro[175.35%], Y-mAbs [151.47%], Sana [149.33%] Best Smallcap Stocks This Week:
Emergent BioSolutions[102.6%], Deciphera [73.24%], Origin Materials[66.52%], Eyenovia [60.78%], Cue Biopharma[56.04%], Aspen Aerogels[55.96%], Enovix [54.02%], Luna Innovations[53.77%], Codexis [47.37%], Carvana Co[44.31%], Office Properties[42.79%] Best Smallcap Stocks Daily:
Luna Innovations[36.00%], Twist Bioscience[28.74%], Ardelyx [28.42%], WideOpenWest [28.23%], 2U [26.63%], Joint [25.35%], FTC Solar[25.09%], Origin Materials[22.23%], Alignment Healthcare[21.97%], Clarus [18.67%], Aurora Innovation[18.09%]