
 Login Sign Up


| |||||
 |  | ||||

| 12Stocks.com Market Intelligence |
Best SmallCap Stocks
|
| In a hurry? Small Cap Stock Lists: Performance Trends Table, Stock Charts
Sort Small Cap stocks: Daily, Weekly, Year-to-Date, Market Cap & Trends. Filter Small Cap stocks list by sector: Show all, Tech, Finance, Energy, Staples, Retail, Industrial, Materials, Utilities and HealthCare Filter Small Cap stocks list by size: All Large Medium Small and MicroCap |
| 12Stocks.com Small Cap Stocks Performances & Trends Daily | |||||||||
|
|  The overall Smart Investing & Trading Score is 69 (0-bearish to 100-bullish) which puts Small Cap index in short term neutral to bullish trend. The Smart Investing & Trading Score from previous trading session is 49 and hence an improvement of trend.
| ||||||||
Here are the Smart Investing & Trading Scores of the most requested small cap stocks at 12Stocks.com (click stock name for detailed review):
|


| 12Stocks.com: Investing in Smallcap Index with Stocks | |
|
The following table helps investors and traders sort through current performance and trends (as measured by Smart Investing & Trading Score) of various
stocks in the Smallcap Index. Quick View: Move mouse or cursor over stock symbol (ticker) to view short-term technical chart and over stock name to view long term chart. Click on  to add stock symbol to your watchlist and to add stock symbol to your watchlist and  to view watchlist. Click on any ticker or stock name for detailed market intelligence report for that stock. to view watchlist. Click on any ticker or stock name for detailed market intelligence report for that stock. |
12Stocks.com Performance of Stocks in Smallcap Index
| Ticker | Stock Name | Watchlist | Category | Recent Price | Smart Investing & Trading Score | Change % | YTD Change% |
| NABL | N-able |   | Technology | 12.54 | 49 | 1.21 | -5.75% |
| TRNO | Terreno Realty | | Financials | 54.89 | 32 | 1.20 | -12.41% |
| ARVN | Arvinas | | Health Care | 32.82 | 32 | 1.20 | -20.26% |
| ORA | Ormat | | Utilities | 67.50 | 100 | 1.18 | -10.94% |
| PDM | Piedmont Office | | Financials | 6.91 | 93 | 1.17 | -2.81% |
| SVC | Service Properties | | Financials | 6.12 | 27 | 1.16 | -28.34% |
| HAE | Haemonetics | | Health Care | 94.40 | 100 | 1.15 | 10.40% |
| TCBI | Texas Capital | | Financials | 60.58 | 100 | 1.15 | -6.27% |
| INDB | Independent Bank | | Financials | 51.92 | 87 | 1.15 | -21.11% |
| FUL | H.B. Fuller | | Materials | 76.93 | 64 | 1.14 | -5.50% |
| WSBC | WesBanco | | Financials | 28.28 | 67 | 1.14 | -9.85% |
| RPD | Rapid7 | | Technology | 45.21 | 35 | 1.14 | -20.82% |
| RGNX | REGENXBIO | | Health Care | 16.83 | 49 | 1.14 | -6.24% |
| NNOX | Nano X | | Health Care | 9.35 | 37 | 1.14 | 46.70% |
| SLAB | Silicon | | Technology | 122.37 | 25 | 1.12 | -7.48% |
| AIV | Apartment | | Financials | 8.20 | 100 | 1.11 | 4.73% |
| CWK | Cushman & Wakefield | | Financials | 10.02 | 87 | 1.11 | -7.22% |
| IIPR | Innovative Industrial | | Financials | 109.48 | 100 | 1.10 | 8.59% |
| PJT | PJT Partners | | Financials | 99.53 | 57 | 1.09 | -2.30% |
| PRVA | Privia Health | | Health Care | 18.46 | 52 | 1.07 | -21.88% |
| WD | Walker & Dunlop | | Financials | 95.23 | 77 | 1.06 | -14.21% |
| ACLX | Arcellx | | Health Care | 53.63 | 32 | 1.06 | -3.90% |
| TMP | Tompkins Financial | | Financials | 47.32 | 74 | 1.05 | -21.43% |
| UVV | Universal | | Consumer Staples | 53.39 | 100 | 1.04 | -20.69% |
| UCBI | United Community | | Financials | 26.32 | 100 | 1.04 | -10.05% |
| For chart view version of above stock list: Chart View ➞ 0 - 25 , 25 - 50 , 50 - 75 , 75 - 100 , 100 - 125 , 125 - 150 , 150 - 175 , 175 - 200 , 200 - 225 , 225 - 250 , 250 - 275 , 275 - 300 , 300 - 325 , 325 - 350 , 350 - 375 , 375 - 400 , 400 - 425 , 425 - 450 , 450 - 475 , 475 - 500 , 500 - 525 , 525 - 550 , 550 - 575 , 575 - 600 , 600 - 625 , 625 - 650 , 650 - 675 , 675 - 700 | ||
 | Click To Change The Sort Order: By Market Cap or Company Size Performance: Year-to-date, Week and Day |  |
| Too many stocks? View smallcap stocks filtered by marketcap & sector |
| Marketcap: All SmallCap Stocks (default-no microcap), Large, Mid-Range, Small |
| Smallcap Sector: Tech, Finance, Energy, Staples, Retail, Industrial, Materials, & Medical |
|
Get the most comprehensive stock market coverage daily at 12Stocks.com ➞ Best Stocks Today ➞ Best Stocks Weekly ➞ Best Stocks Year-to-Date ➞ Best Stocks Trends ➞  Best Stocks Today 12Stocks.com Best Nasdaq Stocks ➞ Best S&P 500 Stocks ➞ Best Tech Stocks ➞ Best Biotech Stocks ➞ |
| Detailed Overview of SmallCap Stocks |
| SmallCap Technical Overview, Leaders & Laggards, Top SmallCap ETF Funds & Detailed SmallCap Stocks List, Charts, Trends & More |
| Smallcap: Technical Analysis, Trends & YTD Performance | |
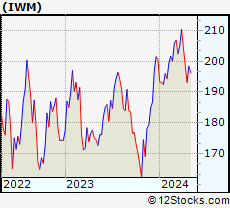
| SmallCap segment as represented by
IWM, an exchange-traded fund [ETF], holds basket of thousands of smallcap stocks from across all major sectors of the US stock market. The smallcap index (contains stocks like Riverbed & Sotheby's) is up by 0.59% and is currently underperforming the overall market by -6.29% year-to-date. Below is a quick view of technical charts and trends: | |
 IWM Weekly Chart |
|
| Long Term Trend: Not Good | |
| Medium Term Trend: Very Good | |
 IWM Daily Chart |
|
| Short Term Trend: Very Good | |
| Overall Trend Score: 69 | |
| YTD Performance: 0.59% | |
| **Trend Scores & Views Are Only For Educational Purposes And Not For Investing | |
| 12Stocks.com: Top Performing Small Cap Index Stocks | ||||||||||||||||||||||||||||||||||||||||||||||||
 The top performing Small Cap Index stocks year to date are
Now, more recently, over last week, the top performing Small Cap Index stocks on the move are


|
||||||||||||||||||||||||||||||||||||||||||||||||
| 12Stocks.com: Investing in Smallcap Index using Exchange Traded Funds | |
|
The following table shows list of key exchange traded funds (ETF) that
help investors track Smallcap index. The following list also includes leveraged ETF funds that track twice or thrice the daily returns of Smallcap indices. Short or inverse ETF funds move in the opposite direction to the index they track and are useful during market pullbacks or during bear markets. Quick View: Move mouse or cursor over ETF symbol (ticker) to view short-term technical chart and over ETF name to view long term chart. Click on ticker or stock name for detailed view. Click on to add stock symbol to your watchlist and to view watchlist. |
12Stocks.com List of ETFs that track Smallcap Index
| Ticker | ETF Name | Watchlist | Recent Price | Smart Investing & Trading Score | Change % | Week % | Year-to-date % |
| IWM | iShares Russell 2000 | | 201.90 | 69 | 0.99 | 1.77 | 0.59% |
| IJR | iShares Core S&P Small-Cap | | 107.13 | 82 | 0.75 | 1.4 | -1.03% |
| VTWO | Vanguard Russell 2000 ETF | | 81.61 | 69 | 0.94 | 1.73 | 0.63% |
| IWN | iShares Russell 2000 Value | | 154.21 | 100 | 0.87 | 2.03 | -0.72% |
| IJS | iShares S&P Small-Cap 600 Value | | 98.72 | 64 | 0.71 | 1.57 | -4.22% |
| IWO | iShares Russell 2000 Growth | | 256.87 | 57 | 0.99 | 1.49 | 1.84% |
| IJT | iShares S&P Small-Cap 600 Growth | | 127.76 | 95 | 0.82 | 1.32 | 2.09% |
| XSLV | PowerShares S&P SmallCap Low Volatil ETF | | 43.22 | 87 | 0.19 | 1.17 | -2.11% |
| SBB | ProShares Short SmallCap600 | | 16.16 | 13 | -1.28 | -1.37 | 1.44% |
| SDD | ProShares UltraShort SmallCap600 | | 18.84 | 23 | -2.41 | -2.61 | 2.27% |
| SAA | ProShares Ultra SmallCap600 | | 23.59 | 69 | 2.86 | 2.39 | -5.45% |
| SMLV | SPDR SSGA US Small Cap Low Volatil ETF | | 109.69 | 87 | 0.78 | 2.01 | -2.52% |
| 12Stocks.com: Charts, Trends, Fundamental Data and Performances of SmallCap Stocks | |
|
We now take in-depth look at all SmallCap stocks including charts, multi-period performances and overall trends (as measured by Smart Investing & Trading Score). One can sort SmallCap stocks (click link to choose) by Daily, Weekly and by Year-to-Date performances. Also, one can sort by size of the company or by market capitalization. |
| Select Your Default Chart Type: | |||||
| |||||
| Click on stock symbol or name for detailed view. Click on to add stock symbol to your watchlist and to view watchlist. Quick View: Move mouse or cursor over "Daily" to quickly view daily technical stock chart and over "Weekly" to view weekly technical stock chart. | |||||

 | NABL N-able, Inc. |
| Sector: Technology | |
| SubSector: Information Technology Services | |
| MarketCap: 2590 Millions | |
| Recent Price: 12.54 Smart Investing & Trading Score: 49 | |
| Day Percent Change: 1.21% Day Change: 0.15 | |
| Week Change: 1.13% Year-to-date Change: -5.8% | |
| NABL Links: Profile News Message Board | |
| Charts:- Daily , Weekly | |
| Add NABL to Watchlist: View: Get Complete NABL Trend Analysis ➞ | |
 | TRNO Terreno Realty Corporation |
| Sector: Financials | |
| SubSector: REIT - Industrial | |
| MarketCap: 3359.69 Millions | |
| Recent Price: 54.89 Smart Investing & Trading Score: 32 | |
| Day Percent Change: 1.20% Day Change: 0.65 | |
| Week Change: 1.4% Year-to-date Change: -12.4% | |
| TRNO Links: Profile News Message Board | |
| Charts:- Daily , Weekly | |
| Add TRNO to Watchlist: View: Get Complete TRNO Trend Analysis ➞ | |
 | ARVN Arvinas, Inc. |
| Sector: Health Care | |
| SubSector: Biotechnology | |
| MarketCap: 3469.85 Millions | |
| Recent Price: 32.82 Smart Investing & Trading Score: 32 | |
| Day Percent Change: 1.20% Day Change: 0.39 | |
| Week Change: 1.39% Year-to-date Change: -20.3% | |
| ARVN Links: Profile News Message Board | |
| Charts:- Daily , Weekly | |
| Add ARVN to Watchlist: View: Get Complete ARVN Trend Analysis ➞ | |
 | ORA Ormat Technologies, Inc. |
| Sector: Utilities | |
| SubSector: Electric Utilities | |
| MarketCap: 3610.74 Millions | |
| Recent Price: 67.50 Smart Investing & Trading Score: 100 | |
| Day Percent Change: 1.18% Day Change: 0.79 | |
| Week Change: 6.96% Year-to-date Change: -10.9% | |
| ORA Links: Profile News Message Board | |
| Charts:- Daily , Weekly | |
| Add ORA to Watchlist: View: Get Complete ORA Trend Analysis ➞ | |
 | PDM Piedmont Office Realty Trust, Inc. |
| Sector: Financials | |
| SubSector: REIT - Office | |
| MarketCap: 2097.46 Millions | |
| Recent Price: 6.91 Smart Investing & Trading Score: 93 | |
| Day Percent Change: 1.17% Day Change: 0.08 | |
| Week Change: 2.98% Year-to-date Change: -2.8% | |
| PDM Links: Profile News Message Board | |
| Charts:- Daily , Weekly | |
| Add PDM to Watchlist: View: Get Complete PDM Trend Analysis ➞ | |
 | SVC Service Properties Trust |
| Sector: Financials | |
| SubSector: REIT - Hotel/Motel | |
| MarketCap: 1067.74 Millions | |
| Recent Price: 6.12 Smart Investing & Trading Score: 27 | |
| Day Percent Change: 1.16% Day Change: 0.07 | |
| Week Change: -1.69% Year-to-date Change: -28.3% | |
| SVC Links: Profile News Message Board | |
| Charts:- Daily , Weekly | |
| Add SVC to Watchlist: View: Get Complete SVC Trend Analysis ➞ | |
 | HAE Haemonetics Corporation |
| Sector: Health Care | |
| SubSector: Medical Instruments & Supplies | |
| MarketCap: 4500.7 Millions | |
| Recent Price: 94.40 Smart Investing & Trading Score: 100 | |
| Day Percent Change: 1.15% Day Change: 1.07 | |
| Week Change: 3.75% Year-to-date Change: 10.4% | |
| HAE Links: Profile News Message Board | |
| Charts:- Daily , Weekly | |
| Add HAE to Watchlist: View: Get Complete HAE Trend Analysis ➞ | |
 | TCBI Texas Capital Bancshares, Inc. |
| Sector: Financials | |
| SubSector: Regional - Southwest Banks | |
| MarketCap: 1202.75 Millions | |
| Recent Price: 60.58 Smart Investing & Trading Score: 100 | |
| Day Percent Change: 1.15% Day Change: 0.69 | |
| Week Change: 4.79% Year-to-date Change: -6.3% | |
| TCBI Links: Profile News Message Board | |
| Charts:- Daily , Weekly | |
| Add TCBI to Watchlist: View: Get Complete TCBI Trend Analysis ➞ | |
 | INDB Independent Bank Corp. |
| Sector: Financials | |
| SubSector: Regional - Northeast Banks | |
| MarketCap: 2347.09 Millions | |
| Recent Price: 51.92 Smart Investing & Trading Score: 87 | |
| Day Percent Change: 1.15% Day Change: 0.59 | |
| Week Change: -1.54% Year-to-date Change: -21.1% | |
| INDB Links: Profile News Message Board | |
| Charts:- Daily , Weekly | |
| Add INDB to Watchlist: View: Get Complete INDB Trend Analysis ➞ | |
 | FUL H.B. Fuller Company |
| Sector: Materials | |
| SubSector: Specialty Chemicals | |
| MarketCap: 1655.67 Millions | |
| Recent Price: 76.93 Smart Investing & Trading Score: 64 | |
| Day Percent Change: 1.14% Day Change: 0.87 | |
| Week Change: 3.64% Year-to-date Change: -5.5% | |
| FUL Links: Profile News Message Board | |
| Charts:- Daily , Weekly | |
| Add FUL to Watchlist: View: Get Complete FUL Trend Analysis ➞ | |
 | WSBC WesBanco, Inc. |
| Sector: Financials | |
| SubSector: Regional - Mid-Atlantic Banks | |
| MarketCap: 1575.79 Millions | |
| Recent Price: 28.28 Smart Investing & Trading Score: 67 | |
| Day Percent Change: 1.14% Day Change: 0.32 | |
| Week Change: 2.76% Year-to-date Change: -9.9% | |
| WSBC Links: Profile News Message Board | |
| Charts:- Daily , Weekly | |
| Add WSBC to Watchlist: View: Get Complete WSBC Trend Analysis ➞ | |
 | RPD Rapid7, Inc. |
| Sector: Technology | |
| SubSector: Application Software | |
| MarketCap: 1981.12 Millions | |
| Recent Price: 45.21 Smart Investing & Trading Score: 35 | |
| Day Percent Change: 1.14% Day Change: 0.51 | |
| Week Change: -1.57% Year-to-date Change: -20.8% | |
| RPD Links: Profile News Message Board | |
| Charts:- Daily , Weekly | |
| Add RPD to Watchlist: View: Get Complete RPD Trend Analysis ➞ | |
 | RGNX REGENXBIO Inc. |
| Sector: Health Care | |
| SubSector: Biotechnology | |
| MarketCap: 1232.85 Millions | |
| Recent Price: 16.83 Smart Investing & Trading Score: 49 | |
| Day Percent Change: 1.14% Day Change: 0.19 | |
| Week Change: 3.95% Year-to-date Change: -6.2% | |
| RGNX Links: Profile News Message Board | |
| Charts:- Daily , Weekly | |
| Add RGNX to Watchlist: View: Get Complete RGNX Trend Analysis ➞ | |
 | NNOX Nano X Imaging Ltd. |
| Sector: Health Care | |
| SubSector: Medical Devices | |
| MarketCap: 22587 Millions | |
| Recent Price: 9.35 Smart Investing & Trading Score: 37 | |
| Day Percent Change: 1.14% Day Change: 0.11 | |
| Week Change: 4.3% Year-to-date Change: 46.7% | |
| NNOX Links: Profile News Message Board | |
| Charts:- Daily , Weekly | |
| Add NNOX to Watchlist: View: Get Complete NNOX Trend Analysis ➞ | |
 | SLAB Silicon Laboratories Inc. |
| Sector: Technology | |
| SubSector: Semiconductor - Integrated Circuits | |
| MarketCap: 3710.2 Millions | |
| Recent Price: 122.37 Smart Investing & Trading Score: 25 | |
| Day Percent Change: 1.12% Day Change: 1.35 | |
| Week Change: 0.2% Year-to-date Change: -7.5% | |
| SLAB Links: Profile News Message Board | |
| Charts:- Daily , Weekly | |
| Add SLAB to Watchlist: View: Get Complete SLAB Trend Analysis ➞ | |
 | AIV Apartment Investment and Management Company |
| Sector: Financials | |
| SubSector: REIT - Residential | |
| MarketCap: 4485.11 Millions | |
| Recent Price: 8.20 Smart Investing & Trading Score: 100 | |
| Day Percent Change: 1.11% Day Change: 0.09 | |
| Week Change: 1.86% Year-to-date Change: 4.7% | |
| AIV Links: Profile News Message Board | |
| Charts:- Daily , Weekly | |
| Add AIV to Watchlist: View: Get Complete AIV Trend Analysis ➞ | |
 | CWK Cushman & Wakefield plc |
| Sector: Financials | |
| SubSector: Property Management | |
| MarketCap: 2651.62 Millions | |
| Recent Price: 10.02 Smart Investing & Trading Score: 87 | |
| Day Percent Change: 1.11% Day Change: 0.11 | |
| Week Change: 3.09% Year-to-date Change: -7.2% | |
| CWK Links: Profile News Message Board | |
| Charts:- Daily , Weekly | |
| Add CWK to Watchlist: View: Get Complete CWK Trend Analysis ➞ | |
 | IIPR Innovative Industrial Properties, Inc. |
| Sector: Financials | |
| SubSector: REIT - Industrial | |
| MarketCap: 1193.29 Millions | |
| Recent Price: 109.48 Smart Investing & Trading Score: 100 | |
| Day Percent Change: 1.10% Day Change: 1.19 | |
| Week Change: 12.05% Year-to-date Change: 8.6% | |
| IIPR Links: Profile News Message Board | |
| Charts:- Daily , Weekly | |
| Add IIPR to Watchlist: View: Get Complete IIPR Trend Analysis ➞ | |
 | PJT PJT Partners Inc. |
| Sector: Financials | |
| SubSector: Asset Management | |
| MarketCap: 1100.93 Millions | |
| Recent Price: 99.53 Smart Investing & Trading Score: 57 | |
| Day Percent Change: 1.09% Day Change: 1.07 | |
| Week Change: 5.78% Year-to-date Change: -2.3% | |
| PJT Links: Profile News Message Board | |
| Charts:- Daily , Weekly | |
| Add PJT to Watchlist: View: Get Complete PJT Trend Analysis ➞ | |
 | PRVA Privia Health Group, Inc. |
| Sector: Health Care | |
| SubSector: Health Information Services | |
| MarketCap: 3130 Millions | |
| Recent Price: 18.46 Smart Investing & Trading Score: 52 | |
| Day Percent Change: 1.07% Day Change: 0.20 | |
| Week Change: 1.04% Year-to-date Change: -21.9% | |
| PRVA Links: Profile News Message Board | |
| Charts:- Daily , Weekly | |
| Add PRVA to Watchlist: View: Get Complete PRVA Trend Analysis ➞ | |
 | WD Walker & Dunlop, Inc. |
| Sector: Financials | |
| SubSector: Mortgage Investment | |
| MarketCap: 1312.99 Millions | |
| Recent Price: 95.23 Smart Investing & Trading Score: 77 | |
| Day Percent Change: 1.06% Day Change: 1.00 | |
| Week Change: 2.17% Year-to-date Change: -14.2% | |
| WD Links: Profile News Message Board | |
| Charts:- Daily , Weekly | |
| Add WD to Watchlist: View: Get Complete WD Trend Analysis ➞ | |
 | ACLX Arcellx, Inc. |
| Sector: Health Care | |
| SubSector: Biotechnology | |
| MarketCap: 1530 Millions | |
| Recent Price: 53.63 Smart Investing & Trading Score: 32 | |
| Day Percent Change: 1.06% Day Change: 0.57 | |
| Week Change: 3.39% Year-to-date Change: -3.9% | |
| ACLX Links: Profile News Message Board | |
| Charts:- Daily , Weekly | |
| Add ACLX to Watchlist: View: Get Complete ACLX Trend Analysis ➞ | |
 | TMP Tompkins Financial Corporation |
| Sector: Financials | |
| SubSector: Regional - Northeast Banks | |
| MarketCap: 1144.79 Millions | |
| Recent Price: 47.32 Smart Investing & Trading Score: 74 | |
| Day Percent Change: 1.05% Day Change: 0.49 | |
| Week Change: 2.14% Year-to-date Change: -21.4% | |
| TMP Links: Profile News Message Board | |
| Charts:- Daily , Weekly | |
| Add TMP to Watchlist: View: Get Complete TMP Trend Analysis ➞ | |
 | UVV Universal Corporation |
| Sector: Consumer Staples | |
| SubSector: Tobacco Products, Other | |
| MarketCap: 1107.7 Millions | |
| Recent Price: 53.39 Smart Investing & Trading Score: 100 | |
| Day Percent Change: 1.04% Day Change: 0.55 | |
| Week Change: 5.1% Year-to-date Change: -20.7% | |
| UVV Links: Profile News Message Board | |
| Charts:- Daily , Weekly | |
| Add UVV to Watchlist: View: Get Complete UVV Trend Analysis ➞ | |
 | UCBI United Community Banks, Inc. |
| Sector: Financials | |
| SubSector: Regional - Mid-Atlantic Banks | |
| MarketCap: 1593.99 Millions | |
| Recent Price: 26.32 Smart Investing & Trading Score: 100 | |
| Day Percent Change: 1.04% Day Change: 0.27 | |
| Week Change: 1.31% Year-to-date Change: -10.1% | |
| UCBI Links: Profile News Message Board | |
| Charts:- Daily , Weekly | |
| Add UCBI to Watchlist: View: Get Complete UCBI Trend Analysis ➞ | |
| For tabular summary view of above stock list: Summary View ➞ 0 - 25 , 25 - 50 , 50 - 75 , 75 - 100 , 100 - 125 , 125 - 150 , 150 - 175 , 175 - 200 , 200 - 225 , 225 - 250 , 250 - 275 , 275 - 300 , 300 - 325 , 325 - 350 , 350 - 375 , 375 - 400 , 400 - 425 , 425 - 450 , 450 - 475 , 475 - 500 , 500 - 525 , 525 - 550 , 550 - 575 , 575 - 600 , 600 - 625 , 625 - 650 , 650 - 675 , 675 - 700 | ||
| Click To Change The Sort Order: By Market Cap or Company Size Performance: Year-to-date, Week and Day | |
| Select Chart Type: | ||
| Too many stocks? View smallcap stocks filtered by marketcap & sector |
| Marketcap: All SmallCap Stocks (default-no microcap), Large, Mid-Range, Small & MicroCap |
| Sector: Tech, Finance, Energy, Staples, Retail, Industrial, Materials, Utilities & Medical |
|
Best Stocks Today 12Stocks.com |
© 2024 12Stocks.com Terms & Conditions Privacy Contact Us
All Information Provided Only For Education And Not To Be Used For Investing or Trading. See Terms & Conditions


One More Thing ... Get Best Stocks Delivered Daily!
Never Ever Miss A Move With Our Top Ten Stocks Lists
Find Best Stocks In Any Market - Bull or Bear Market
Take A Peek At Our Top Ten Stocks Lists: Daily, Weekly, Year-to-Date & Top Trends
Find Best Stocks In Any Market - Bull or Bear Market
Take A Peek At Our Top Ten Stocks Lists: Daily, Weekly, Year-to-Date & Top Trends
Smallcap Stocks With Best Up Trends [0-bearish to 100-bullish]: Twist Bioscience[100], WideOpenWest [100], Joint [100], FTC Solar[100], Origin Materials[100], Alignment Healthcare[100], Clarus [100], IES [100], Emergent BioSolutions[100], Enovix [100], El Pollo[100]
Best Smallcap Stocks Year-to-Date:
Janux [482.74%], Viking [313.59%], Longboard [272.5%], Alpine Immune[239.29%], Bakkt [199.55%], Avidity Biosciences[192.48%], Vera [189.47%], Cullinan Oncology[176.9%], Super Micro[175.35%], Y-mAbs [151.47%], Sana [149.33%] Best Smallcap Stocks This Week:
Emergent BioSolutions[102.6%], Deciphera [73.24%], Origin Materials[66.52%], Eyenovia [60.78%], Cue Biopharma[56.04%], Aspen Aerogels[55.96%], Enovix [54.02%], Luna Innovations[53.77%], Codexis [47.37%], Carvana Co[44.31%], Office Properties[42.79%] Best Smallcap Stocks Daily:
Luna Innovations[36.00%], Twist Bioscience[28.74%], Ardelyx [28.42%], WideOpenWest [28.23%], 2U [26.63%], Joint [25.35%], FTC Solar[25.09%], Origin Materials[22.23%], Alignment Healthcare[21.97%], Clarus [18.67%], Aurora Innovation[18.09%]