
 Login Sign Up


| |||||
 |  | ||||

| 12Stocks.com Market Intelligence |
Best SmallCap Stocks
|
| In a hurry? Small Cap Stock Lists: Performance Trends Table, Stock Charts
Sort Small Cap stocks: Daily, Weekly, Year-to-Date, Market Cap & Trends. Filter Small Cap stocks list by sector: Show all, Tech, Finance, Energy, Staples, Retail, Industrial, Materials, Utilities and HealthCare Filter Small Cap stocks list by size: All Large Medium Small and MicroCap |
| 12Stocks.com Small Cap Stocks Performances & Trends Daily | |||||||||
|
|  The overall Smart Investing & Trading Score is 80 (0-bearish to 100-bullish) which puts Small Cap index in short term neutral to bullish trend. The Smart Investing & Trading Score from previous trading session is 100 and a deterioration of trend continues.
| ||||||||
Here are the Smart Investing & Trading Scores of the most requested small cap stocks at 12Stocks.com (click stock name for detailed review):
|


| 12Stocks.com: Investing in Smallcap Index with Stocks | |
|
The following table helps investors and traders sort through current performance and trends (as measured by Smart Investing & Trading Score) of various
stocks in the Smallcap Index. Quick View: Move mouse or cursor over stock symbol (ticker) to view short-term technical chart and over stock name to view long term chart. Click on  to add stock symbol to your watchlist and to add stock symbol to your watchlist and  to view watchlist. Click on any ticker or stock name for detailed market intelligence report for that stock. to view watchlist. Click on any ticker or stock name for detailed market intelligence report for that stock. |
12Stocks.com Performance of Stocks in Smallcap Index
| Ticker | Stock Name | Watchlist | Category | Recent Price | Smart Investing & Trading Score | Change % | YTD Change% |
| CVNA | Carvana Co |   | Services & Goods | 365.35 | 40 | 0.99% | 83.08% |
| PTVE | Pactiv Evergreen | | Services & Goods | 18.01 | 50 | -0.06% | 3.15% |
| DDS | Dillard's | | Services & Goods | 586.88 | 80 | 2.12% | 30.38% |
| IBP | Installed Building | | Services & Goods | 260.64 | 30 | -2.73% | 52.65% |
| TMHC | Taylor Morrison | | Services & Goods | 68.73 | 40 | -1.32% | 13.51% |
| MOD | Modine | | Services & Goods | 152.40 | 90 | 1.82% | 31.19% |
| EAT | Brinker | | Services & Goods | 152.84 | 20 | -0.53% | 11.02% |
| RRR | Red Rock | | Services & Goods | 61.08 | 60 | -0.42% | 41.01% |
| LTH | Life Time | | Services & Goods | 28.26 | 10 | 0.86% | 27.98% |
| URBN | Urban Outfitters | | Services & Goods | 71.97 | 70 | 6.29% | 26.62% |
| SGHC | Super Group | | Services & Goods | 12.69 | 70 | 0.40% | 104.40% |
| GPI | Group 1 | | Services & Goods | 458.45 | 30 | -1.69% | 10.39% |
| MTH | Meritage Homes | | Services & Goods | 77.18 | 30 | -2.04% | 2.86% |
| BOOT | Boot Barn | | Services & Goods | 181.52 | 50 | 2.68% | 18.94% |
| ABG | Asbury Automotive | | Services & Goods | 242.74 | 20 | -0.61% | 2.67% |
| DORM | Dorman Products | | Services & Goods | 161.86 | 80 | 0.33% | 26.03% |
| KBH | KB Home | | Services & Goods | 65.19 | 40 | -1.05% | 2.14% |
| FTDR | Frontdoor | | Services & Goods | 65.60 | 70 | -1.06% | 19.64% |
| RUSHA | Rush Enterprises | | Services & Goods | 55.86 | 30 | 0.36% | 2.95% |
| ANF | Abercrombie & Fitch Co | | Services & Goods | 87.62 | 20 | 0.16% | -42.82% |
| GOLF | Acushnet | | Services & Goods | 74.72 | 50 | 0.04% | 4.58% |
| KTB | Kontoor Brands | | Services & Goods | 82.01 | 90 | 1.33% | -1.98% |
| SKY | Champion Homes | | Services & Goods | 75.28 | 70 | 0.78% | -12.44% |
| CVCO | Cavco Industries | | Services & Goods | 545.36 | 90 | 0.07% | 24.21% |
| SHAK | Shake Shack | | Services & Goods | 101.14 | 50 | 0.37% | -24.11% |
| For chart view version of above stock list: Chart View ➞ 0 - 25 , 25 - 50 , 50 - 75 , 75 - 100 , 100 - 125 , 125 - 150 , 150 - 175 , 175 - 200 | ||
 | Click To Change The Sort Order: By Market Cap or Company Size Performance: Year-to-date, Week and Day |  |
| Too many stocks? View smallcap stocks filtered by marketcap & sector |
| Marketcap: All SmallCap Stocks (default-no microcap), Large, Mid-Range, Small |
| Smallcap Sector: Tech, Finance, Energy, Staples, Retail, Industrial, Materials, & Medical |
|
Get the most comprehensive stock market coverage daily at 12Stocks.com ➞ Best Stocks Today ➞ Best Stocks Weekly ➞ Best Stocks Year-to-Date ➞ Best Stocks Trends ➞  Best Stocks Today 12Stocks.com Best Nasdaq Stocks ➞ Best S&P 500 Stocks ➞ Best Tech Stocks ➞ Best Biotech Stocks ➞ |
| Detailed Overview of SmallCap Stocks |
| SmallCap Technical Overview, Leaders & Laggards, Top SmallCap ETF Funds & Detailed SmallCap Stocks List, Charts, Trends & More |
| Smallcap: Technical Analysis, Trends & YTD Performance | |
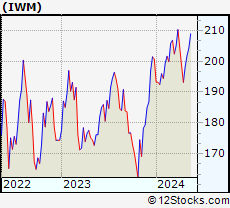
| SmallCap segment as represented by
IWM, an exchange-traded fund [ETF], holds basket of thousands of smallcap stocks from across all major sectors of the US stock market. The smallcap index (contains stocks like Riverbed & Sotheby's) is up by 8.77765% and is currently underperforming the overall market by -4.62315% year-to-date. Below is a quick view of technical charts and trends: | |
 IWM Weekly Chart |
|
| Long Term Trend: Very Good | |
| Medium Term Trend: Good | |
 IWM Daily Chart |
|
| Short Term Trend: Good | |
| Overall Trend Score: 80 | |
| YTD Performance: 8.77765% | |
| **Trend Scores & Views Are Only For Educational Purposes And Not For Investing | |
| 12Stocks.com: Top Performing Small Cap Index Stocks | ||||||||||||||||||||||||||||||||||||||||||||||||
 The top performing Small Cap Index stocks year to date are
Now, more recently, over last week, the top performing Small Cap Index stocks on the move are


|
||||||||||||||||||||||||||||||||||||||||||||||||
| 12Stocks.com: Investing in Smallcap Index using Exchange Traded Funds | |
|
The following table shows list of key exchange traded funds (ETF) that
help investors track Smallcap index. The following list also includes leveraged ETF funds that track twice or thrice the daily returns of Smallcap indices. Short or inverse ETF funds move in the opposite direction to the index they track and are useful during market pullbacks or during bear markets. Quick View: Move mouse or cursor over ETF symbol (ticker) to view short-term technical chart and over ETF name to view long term chart. Click on ticker or stock name for detailed view. Click on to add stock symbol to your watchlist and to view watchlist. |
12Stocks.com List of ETFs that track Smallcap Index
| Ticker | ETF Name | Watchlist | Recent Price | Smart Investing & Trading Score | Change % | Week % | Year-to-date % |
| IWM | iShares Russell 2000 ETF | | 239.35 | 80 | 0.423764 | 0.664508 | 8.77765% |
| IJR | iShares Core S&P Small-Cap ETF | | 118.57 | 70 | 0.0928584 | -0.470075 | 3.8248% |
| VTWO | Vanguard Russell 2000 Index ETF | | 96.80 | 80 | 0.404522 | 0.686499 | 8.91763% |
| IWN | iShares Russell 2000 Value ETF | | 176.23 | 80 | 0.387354 | 0.130682 | 8.34522% |
| IWO | iShares Russell 2000 Growth ETF | | 314.37 | 80 | 0.479432 | 1.13889 | 9.13844% |
| IJS | iShares S&P Small-Cap 600 Value ETF | | 110.64 | 80 | 0.144823 | -0.476747 | 3.1368% |
| IJT | iShares S&P Small-Cap 600 Growth ETF | | 140.88 | 60 | 0.0426076 | -0.360704 | 4.35478% |
| XSLV | Invesco S&P SmallCap Low Volatility ETF | | 47.06 | 40 | -0.570463 | -1.67154 | 1.07497% |
| SBB | ProShares Short SmallCap600 -1x Shares | | 14.03 | 20 | -0.0156829 | 0.42243 | -2.92892% |
| SAA | ProShares Ultra SmallCap600 2x Shares | | 25.47 | 80 | -0.181034 | -1.04841 | -1.26932% |
| SMLV | SPDR SSGA US Small Cap Low Volatility Index ETF | | 132.24 | 50 | -0.00529313 | -0.286533 | 6.06012% |
| SDD | ProShares UltraShort SmallCap600 -2x Shares | | 13.40 | 40 | 0.19964 | -2.57577 | -11.4008% |
| 12Stocks.com: Charts, Trends, Fundamental Data and Performances of SmallCap Stocks | |
|
We now take in-depth look at all SmallCap stocks including charts, multi-period performances and overall trends (as measured by Smart Investing & Trading Score). One can sort SmallCap stocks (click link to choose) by Daily, Weekly and by Year-to-Date performances. Also, one can sort by size of the company or by market capitalization. |
| Select Your Default Chart Type: | |||||
| |||||
| Click on stock symbol or name for detailed view. Click on to add stock symbol to your watchlist and to view watchlist. Quick View: Move mouse or cursor over "Daily" to quickly view daily technical stock chart and over "Weekly" to view weekly technical stock chart. | |||||

 | CVNA Carvana Co |
| Sector: Services & Goods | |
| SubSector: Auto & Truck Dealerships | |
| MarketCap: 79384.2 Millions | |
| Recent Price: 365.35 Smart Investing & Trading Score: 40 | |
| Day Percent Change: 0.989579% Day Change: 0.46 | |
| Week Change: -0.956951% Year-to-date Change: 83.1% | |
| CVNA Links: Profile News Message Board | |
| Charts:- Daily , Weekly | |
| Add CVNA to Watchlist: View: Get Complete CVNA Trend Analysis ➞ | |
 | PTVE Pactiv Evergreen Inc. |
| Sector: Services & Goods | |
| SubSector: Packaging & Containers | |
| MarketCap: 33427 Millions | |
| Recent Price: 18.01 Smart Investing & Trading Score: 50 | |
| Day Percent Change: -0.0554939% Day Change: -9999 | |
| Week Change: 0.44618% Year-to-date Change: 3.2% | |
| PTVE Links: Profile News Message Board | |
| Charts:- Daily , Weekly | |
| Add PTVE to Watchlist: View: Get Complete PTVE Trend Analysis ➞ | |
 | DDS Dillard's Inc |
| Sector: Services & Goods | |
| SubSector: Department Stores | |
| MarketCap: 9008.06 Millions | |
| Recent Price: 586.88 Smart Investing & Trading Score: 80 | |
| Day Percent Change: 2.1247% Day Change: 9.44 | |
| Week Change: 1.71936% Year-to-date Change: 30.4% | |
| DDS Links: Profile News Message Board | |
| Charts:- Daily , Weekly | |
| Add DDS to Watchlist: View: Get Complete DDS Trend Analysis ➞ | |
 | IBP Installed Building Products Inc |
| Sector: Services & Goods | |
| SubSector: Residential Construction | |
| MarketCap: 7490.98 Millions | |
| Recent Price: 260.64 Smart Investing & Trading Score: 30 | |
| Day Percent Change: -2.73175% Day Change: 0.91 | |
| Week Change: -4.92102% Year-to-date Change: 52.7% | |
| IBP Links: Profile News Message Board | |
| Charts:- Daily , Weekly | |
| Add IBP to Watchlist: View: Get Complete IBP Trend Analysis ➞ | |
 | TMHC Taylor Morrison Home Corp |
| Sector: Services & Goods | |
| SubSector: Residential Construction | |
| MarketCap: 7100.9 Millions | |
| Recent Price: 68.73 Smart Investing & Trading Score: 40 | |
| Day Percent Change: -1.32089% Day Change: -0.87 | |
| Week Change: -4.32906% Year-to-date Change: 13.5% | |
| TMHC Links: Profile News Message Board | |
| Charts:- Daily , Weekly | |
| Add TMHC to Watchlist: View: Get Complete TMHC Trend Analysis ➞ | |
 | MOD Modine Manufacturing Co |
| Sector: Services & Goods | |
| SubSector: Auto Parts | |
| MarketCap: 7096.15 Millions | |
| Recent Price: 152.40 Smart Investing & Trading Score: 90 | |
| Day Percent Change: 1.81721% Day Change: -0.04 | |
| Week Change: 12.7302% Year-to-date Change: 31.2% | |
| MOD Links: Profile News Message Board | |
| Charts:- Daily , Weekly | |
| Add MOD to Watchlist: View: Get Complete MOD Trend Analysis ➞ | |
 | EAT Brinker International, Inc |
| Sector: Services & Goods | |
| SubSector: Restaurants | |
| MarketCap: 7040.49 Millions | |
| Recent Price: 152.84 Smart Investing & Trading Score: 20 | |
| Day Percent Change: -0.533646% Day Change: -0.42 | |
| Week Change: -3.40033% Year-to-date Change: 11.0% | |
| EAT Links: Profile News Message Board | |
| Charts:- Daily , Weekly | |
| Add EAT to Watchlist: View: Get Complete EAT Trend Analysis ➞ | |
 | RRR Red Rock Resorts Inc |
| Sector: Services & Goods | |
| SubSector: Resorts & Casinos | |
| MarketCap: 6567.91 Millions | |
| Recent Price: 61.08 Smart Investing & Trading Score: 60 | |
| Day Percent Change: -0.423867% Day Change: 0.14 | |
| Week Change: -1.89528% Year-to-date Change: 41.0% | |
| RRR Links: Profile News Message Board | |
| Charts:- Daily , Weekly | |
| Add RRR to Watchlist: View: Get Complete RRR Trend Analysis ➞ | |
 | LTH Life Time Group Holdings Inc |
| Sector: Services & Goods | |
| SubSector: Leisure | |
| MarketCap: 6375.49 Millions | |
| Recent Price: 28.26 Smart Investing & Trading Score: 10 | |
| Day Percent Change: 0.86% Day Change: 0.24 | |
| Week Change: 3.28% Year-to-date Change: 28.0% | |
| LTH Links: Profile News Message Board | |
| Charts:- Daily , Weekly | |
| Add LTH to Watchlist: View: Get Complete LTH Trend Analysis ➞ | |
 | URBN Urban Outfitters, Inc |
| Sector: Services & Goods | |
| SubSector: Apparel Retail | |
| MarketCap: 6343.97 Millions | |
| Recent Price: 71.97 Smart Investing & Trading Score: 70 | |
| Day Percent Change: 6.29154% Day Change: 0.52 | |
| Week Change: 1.69563% Year-to-date Change: 26.6% | |
| URBN Links: Profile News Message Board | |
| Charts:- Daily , Weekly | |
| Add URBN to Watchlist: View: Get Complete URBN Trend Analysis ➞ | |
 | SGHC Super Group (SGHC) Limited |
| Sector: Services & Goods | |
| SubSector: Gambling | |
| MarketCap: 6343.11 Millions | |
| Recent Price: 12.69 Smart Investing & Trading Score: 70 | |
| Day Percent Change: 0.39557% Day Change: 0.1 | |
| Week Change: 0.316206% Year-to-date Change: 104.4% | |
| SGHC Links: Profile News Message Board | |
| Charts:- Daily , Weekly | |
| Add SGHC to Watchlist: View: Get Complete SGHC Trend Analysis ➞ | |
 | GPI Group 1 Automotive, Inc |
| Sector: Services & Goods | |
| SubSector: Auto & Truck Dealerships | |
| MarketCap: 6261.12 Millions | |
| Recent Price: 458.45 Smart Investing & Trading Score: 30 | |
| Day Percent Change: -1.68768% Day Change: -1.41 | |
| Week Change: -5.25348% Year-to-date Change: 10.4% | |
| GPI Links: Profile News Message Board | |
| Charts:- Daily , Weekly | |
| Add GPI to Watchlist: View: Get Complete GPI Trend Analysis ➞ | |
 | MTH Meritage Homes Corp |
| Sector: Services & Goods | |
| SubSector: Residential Construction | |
| MarketCap: 5893.86 Millions | |
| Recent Price: 77.18 Smart Investing & Trading Score: 30 | |
| Day Percent Change: -2.04341% Day Change: -0.1 | |
| Week Change: -6.8212% Year-to-date Change: 2.9% | |
| MTH Links: Profile News Message Board | |
| Charts:- Daily , Weekly | |
| Add MTH to Watchlist: View: Get Complete MTH Trend Analysis ➞ | |
 | BOOT Boot Barn Holdings Inc |
| Sector: Services & Goods | |
| SubSector: Apparel Retail | |
| MarketCap: 5578.54 Millions | |
| Recent Price: 181.52 Smart Investing & Trading Score: 50 | |
| Day Percent Change: 2.6813% Day Change: 0.58 | |
| Week Change: -0.575122% Year-to-date Change: 18.9% | |
| BOOT Links: Profile News Message Board | |
| Charts:- Daily , Weekly | |
| Add BOOT to Watchlist: View: Get Complete BOOT Trend Analysis ➞ | |
 | ABG Asbury Automotive Group Inc |
| Sector: Services & Goods | |
| SubSector: Auto & Truck Dealerships | |
| MarketCap: 5062.22 Millions | |
| Recent Price: 242.74 Smart Investing & Trading Score: 20 | |
| Day Percent Change: -0.61415% Day Change: -0.71 | |
| Week Change: -5.72472% Year-to-date Change: 2.7% | |
| ABG Links: Profile News Message Board | |
| Charts:- Daily , Weekly | |
| Add ABG to Watchlist: View: Get Complete ABG Trend Analysis ➞ | |
 | DORM Dorman Products Inc |
| Sector: Services & Goods | |
| SubSector: Auto Parts | |
| MarketCap: 4997.54 Millions | |
| Recent Price: 161.86 Smart Investing & Trading Score: 80 | |
| Day Percent Change: 0.328519% Day Change: -0.93 | |
| Week Change: -1.10588% Year-to-date Change: 26.0% | |
| DORM Links: Profile News Message Board | |
| Charts:- Daily , Weekly | |
| Add DORM to Watchlist: View: Get Complete DORM Trend Analysis ➞ | |
 | KBH KB Home |
| Sector: Services & Goods | |
| SubSector: Residential Construction | |
| MarketCap: 4625.37 Millions | |
| Recent Price: 65.19 Smart Investing & Trading Score: 40 | |
| Day Percent Change: -1.04736% Day Change: -0.64 | |
| Week Change: -4.09004% Year-to-date Change: 2.1% | |
| KBH Links: Profile News Message Board | |
| Charts:- Daily , Weekly | |
| Add KBH to Watchlist: View: Get Complete KBH Trend Analysis ➞ | |
 | FTDR Frontdoor Inc |
| Sector: Services & Goods | |
| SubSector: Personal Services | |
| MarketCap: 4593.15 Millions | |
| Recent Price: 65.60 Smart Investing & Trading Score: 70 | |
| Day Percent Change: -1.05581% Day Change: -0.19 | |
| Week Change: 4.04441% Year-to-date Change: 19.6% | |
| FTDR Links: Profile News Message Board | |
| Charts:- Daily , Weekly | |
| Add FTDR to Watchlist: View: Get Complete FTDR Trend Analysis ➞ | |
 | RUSHA Rush Enterprises Inc |
| Sector: Services & Goods | |
| SubSector: Auto & Truck Dealerships | |
| MarketCap: 4549.83 Millions | |
| Recent Price: 55.86 Smart Investing & Trading Score: 30 | |
| Day Percent Change: 0.359324% Day Change: -0.18 | |
| Week Change: -4.08654% Year-to-date Change: 3.0% | |
| RUSHA Links: Profile News Message Board | |
| Charts:- Daily , Weekly | |
| Add RUSHA to Watchlist: View: Get Complete RUSHA Trend Analysis ➞ | |
 | ANF Abercrombie & Fitch Co |
| Sector: Services & Goods | |
| SubSector: Apparel Retail | |
| MarketCap: 4543.74 Millions | |
| Recent Price: 87.62 Smart Investing & Trading Score: 20 | |
| Day Percent Change: 0.160037% Day Change: 0.95 | |
| Week Change: -8.12625% Year-to-date Change: -42.8% | |
| ANF Links: Profile News Message Board | |
| Charts:- Daily , Weekly | |
| Add ANF to Watchlist: View: Get Complete ANF Trend Analysis ➞ | |
 | GOLF Acushnet Holdings Corp |
| Sector: Services & Goods | |
| SubSector: Leisure | |
| MarketCap: 4490.2 Millions | |
| Recent Price: 74.72 Smart Investing & Trading Score: 50 | |
| Day Percent Change: 0.040166% Day Change: -1.08 | |
| Week Change: -2.39059% Year-to-date Change: 4.6% | |
| GOLF Links: Profile News Message Board | |
| Charts:- Daily , Weekly | |
| Add GOLF to Watchlist: View: Get Complete GOLF Trend Analysis ➞ | |
 | KTB Kontoor Brands Inc |
| Sector: Services & Goods | |
| SubSector: Apparel Manufacturing | |
| MarketCap: 4459.28 Millions | |
| Recent Price: 82.01 Smart Investing & Trading Score: 90 | |
| Day Percent Change: 1.33449% Day Change: 0.03 | |
| Week Change: 2.20588% Year-to-date Change: -2.0% | |
| KTB Links: Profile News Message Board | |
| Charts:- Daily , Weekly | |
| Add KTB to Watchlist: View: Get Complete KTB Trend Analysis ➞ | |
 | SKY Champion Homes Inc |
| Sector: Services & Goods | |
| SubSector: Residential Construction | |
| MarketCap: 4431.02 Millions | |
| Recent Price: 75.28 Smart Investing & Trading Score: 70 | |
| Day Percent Change: 0.776439% Day Change: -0.12 | |
| Week Change: -3.97959% Year-to-date Change: -12.4% | |
| SKY Links: Profile News Message Board | |
| Charts:- Daily , Weekly | |
| Add SKY to Watchlist: View: Get Complete SKY Trend Analysis ➞ | |
 | CVCO Cavco Industries Inc |
| Sector: Services & Goods | |
| SubSector: Residential Construction | |
| MarketCap: 4321.77 Millions | |
| Recent Price: 545.36 Smart Investing & Trading Score: 90 | |
| Day Percent Change: 0.0678912% Day Change: 2.18 | |
| Week Change: -0.0879379% Year-to-date Change: 24.2% | |
| CVCO Links: Profile News Message Board | |
| Charts:- Daily , Weekly | |
| Add CVCO to Watchlist: View: Get Complete CVCO Trend Analysis ➞ | |
 | SHAK Shake Shack Inc |
| Sector: Services & Goods | |
| SubSector: Restaurants | |
| MarketCap: 4276.44 Millions | |
| Recent Price: 101.14 Smart Investing & Trading Score: 50 | |
| Day Percent Change: 0.367173% Day Change: -2.1 | |
| Week Change: 0.958275% Year-to-date Change: -24.1% | |
| SHAK Links: Profile News Message Board | |
| Charts:- Daily , Weekly | |
| Add SHAK to Watchlist: View: Get Complete SHAK Trend Analysis ➞ | |
| For tabular summary view of above stock list: Summary View ➞ 0 - 25 , 25 - 50 , 50 - 75 , 75 - 100 , 100 - 125 , 125 - 150 , 150 - 175 , 175 - 200 | ||
| Click To Change The Sort Order: By Market Cap or Company Size Performance: Year-to-date, Week and Day | |
| Select Chart Type: | ||
| Too many stocks? View smallcap stocks filtered by marketcap & sector |
| Marketcap: All SmallCap Stocks (default-no microcap), Large, Mid-Range, Small & MicroCap |
| Sector: Tech, Finance, Energy, Staples, Retail, Industrial, Materials, Utilities & Medical |
|
Best Stocks Today 12Stocks.com |
© 2025 12Stocks.com Terms & Conditions Privacy Contact Us
All Information Provided Only For Education And Not To Be Used For Investing or Trading. See Terms & Conditions


One More Thing ... Get Best Stocks Delivered Daily!
Never Ever Miss A Move With Our Top Ten Stocks Lists
Find Best Stocks In Any Market - Bull or Bear Market
Take A Peek At Our Top Ten Stocks Lists: Daily, Weekly, Year-to-Date & Top Trends
Find Best Stocks In Any Market - Bull or Bear Market
Take A Peek At Our Top Ten Stocks Lists: Daily, Weekly, Year-to-Date & Top Trends
Smallcap Stocks With Best Up Trends [0-bearish to 100-bullish]: Office Properties[100], AVITA Medical[100], Monte Rosa[100], Berry Corp[100], AlloVir [100], GoPro [100], Energy Fuels[100], Cara [100], Fastly [100], Uranium Energy[100], P.A.M. Transportation[100]
Best Smallcap Stocks Year-to-Date:
GrafTech [509.884%], FiscalNote [322.115%], Celcuity [319.421%], Immuneering Corp[255.656%], OptimizeRx Corp[232.63%], Precigen [232.407%], Centrus Energy[228.805%], CommScope Holding[222.674%], EchoStar Corp[216.22%], Cooper-Standard [190.99%], Bloom Energy[186.778%] Best Smallcap Stocks This Week:
Office Properties[289.553%], Textainer Group[258.475%], United Community[163.439%], Lakeland Bancorp[147.684%], Dominion Midstream[118.502%], PDL BioPharma[112.645%], GTx [108.706%], Overseas Shipholding[77.0318%], Vimeo [74.4921%], PGT Innovations[65.2536%], Fuelcell Energy[62.716%] Best Smallcap Stocks Daily:
Office Properties[59.6227%], AVITA Medical[48.2456%], Monte Rosa[43.659%], Berry Corp[21.148%], AlloVir [16.9215%], GoPro [15.942%], Energy Fuels[15.8424%], Irobot Corp[15.4971%], Cara [14.3396%], Tyra Biosciences[14.26%], Zura Bio[13.71%]