
 Login Sign Up


| |||||
 |  | ||||

| 12Stocks.com Market Intelligence |
Best SmallCap Stocks
|
| In a hurry? Small Cap Stock Lists: Performance Trends Table, Stock Charts
Sort Small Cap stocks: Daily, Weekly, Year-to-Date, Market Cap & Trends. Filter Small Cap stocks list by sector: Show all, Tech, Finance, Energy, Staples, Retail, Industrial, Materials, Utilities and HealthCare Filter Small Cap stocks list by size: All Large Medium Small and MicroCap |
| 12Stocks.com Small Cap Stocks Performances & Trends Daily | |||||||||
|
|  The overall Smart Investing & Trading Score is 23 (0-bearish to 100-bullish) which puts Small Cap index in short term bearish to neutral trend. The Smart Investing & Trading Score from previous trading session is 13 and an improvement of trend continues.
| ||||||||
Here are the Smart Investing & Trading Scores of the most requested small cap stocks at 12Stocks.com (click stock name for detailed review):
|


| 12Stocks.com: Investing in Smallcap Index with Stocks | |
|
The following table helps investors and traders sort through current performance and trends (as measured by Smart Investing & Trading Score) of various
stocks in the Smallcap Index. Quick View: Move mouse or cursor over stock symbol (ticker) to view short-term technical chart and over stock name to view long term chart. Click on  to add stock symbol to your watchlist and to add stock symbol to your watchlist and  to view watchlist. Click on any ticker or stock name for detailed market intelligence report for that stock. to view watchlist. Click on any ticker or stock name for detailed market intelligence report for that stock. |
12Stocks.com Performance of Stocks in Smallcap Index
| Ticker | Stock Name | Watchlist | Category | Recent Price | Smart Investing & Trading Score | Change % | YTD Change% |
| DLX | Deluxe |   | Services & Goods | 19.71 | 73 | 4.01% | -8.11% |
| ODP | Office Depot | | Services & Goods | 50.28 | 18 | 1.82% | -10.69% |
| FWRG | First Watch | | Services & Goods | 22.30 | 51 | 1.09% | 11.89% |
| HURN | Huron Consulting | | Services & Goods | 92.32 | 42 | 2.08% | -10.19% |
| FLWS | 1-800-FLOWERS.COM | | Services & Goods | 9.00 | 32 | 2.62% | -16.51% |
| GPI | Group 1 | | Services & Goods | 265.53 | 36 | 0.90% | -12.87% |
| BKE | Buckle | | Services & Goods | 36.59 | 25 | -0.25% | -23.00% |
| AMRC | Ameresco | | Services & Goods | 18.80 | 20 | 1.29% | -40.64% |
| SES | SES AI | | Services & Goods | 1.27 | 0 | -13.90% | -29.05% |
| IMAX | IMAX | | Services & Goods | 17.13 | 88 | 0.12% | 14.05% |
| CAKE | Cheesecake Factory | | Services & Goods | 34.00 | 35 | 0.56% | -2.88% |
| CDNA | CareDx | | Services & Goods | 8.31 | 30 | 2.97% | -30.75% |
| IMKTA | Ingles Markets | | Services & Goods | 75.34 | 52 | 2.70% | -12.77% |
| XPOF | Xponential Fitness | | Services & Goods | 13.15 | 53 | 0.31% | 0.84% |
| MATW | Matthews | | Services & Goods | 26.43 | 32 | 2.76% | -27.89% |
| SCHL | Scholastic | | Services & Goods | 35.68 | 32 | 2.44% | -5.36% |
| SSP | E.W. Scripps | | Services & Goods | 3.59 | 52 | 4.06% | -55.07% |
| MOND | Mondee | | Services & Goods | 2.19 | 32 | 0.46% | -21.22% |
| REZI | Resideo | | Services & Goods | 19.27 | 36 | 0.36% | 2.39% |
| IHRT | iHeartMedia | | Services & Goods | 1.90 | 10 | -1.55% | -28.84% |
| MED | Medifast | | Services & Goods | 32.44 | 45 | -0.09% | -51.74% |
| RVLV | Revolve Group | | Services & Goods | 19.20 | 61 | 0.42% | 15.80% |
| BATRK | Liberty Braves | | Services & Goods | 37.28 | 10 | 0.35% | -5.81% |
| MYPS | PLAYSTUDIOS | | Services & Goods | 2.31 | 36 | -1.28% | -13.64% |
| JACK | Jack in | | Services & Goods | 59.64 | 17 | 2.54% | -26.94% |
| For chart view version of above stock list: Chart View ➞ 0 - 25 , 25 - 50 , 50 - 75 , 75 - 100 , 100 - 125 , 125 - 150 , 150 - 175 , 175 - 200 , 200 - 225 | ||
 | Click To Change The Sort Order: By Market Cap or Company Size Performance: Year-to-date, Week and Day |  |
| Too many stocks? View smallcap stocks filtered by marketcap & sector |
| Marketcap: All SmallCap Stocks (default-no microcap), Large, Mid-Range, Small |
| Smallcap Sector: Tech, Finance, Energy, Staples, Retail, Industrial, Materials, & Medical |
|
Get the most comprehensive stock market coverage daily at 12Stocks.com ➞ Best Stocks Today ➞ Best Stocks Weekly ➞ Best Stocks Year-to-Date ➞ Best Stocks Trends ➞  Best Stocks Today 12Stocks.com Best Nasdaq Stocks ➞ Best S&P 500 Stocks ➞ Best Tech Stocks ➞ Best Biotech Stocks ➞ |
| Detailed Overview of SmallCap Stocks |
| SmallCap Technical Overview, Leaders & Laggards, Top SmallCap ETF Funds & Detailed SmallCap Stocks List, Charts, Trends & More |
| Smallcap: Technical Analysis, Trends & YTD Performance | |
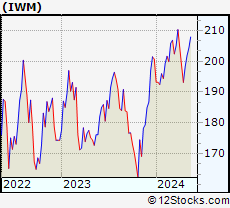
| SmallCap segment as represented by
IWM, an exchange-traded fund [ETF], holds basket of thousands of smallcap stocks from across all major sectors of the US stock market. The smallcap index (contains stocks like Riverbed & Sotheby's) is down by -3.77% and is currently underperforming the overall market by -7.15% year-to-date. Below is a quick view of technical charts and trends: | |
 IWM Weekly Chart |
|
| Long Term Trend: Good | |
| Medium Term Trend: Not Good | |
 IWM Daily Chart |
|
| Short Term Trend: Deteriorating | |
| Overall Trend Score: 23 | |
| YTD Performance: -3.77% | |
| **Trend Scores & Views Are Only For Educational Purposes And Not For Investing | |
| 12Stocks.com: Top Performing Small Cap Index Stocks | ||||||||||||||||||||||||||||||||||||||||||||||||
 The top performing Small Cap Index stocks year to date are
Now, more recently, over last week, the top performing Small Cap Index stocks on the move are


|
||||||||||||||||||||||||||||||||||||||||||||||||
| 12Stocks.com: Investing in Smallcap Index using Exchange Traded Funds | |
|
The following table shows list of key exchange traded funds (ETF) that
help investors track Smallcap index. The following list also includes leveraged ETF funds that track twice or thrice the daily returns of Smallcap indices. Short or inverse ETF funds move in the opposite direction to the index they track and are useful during market pullbacks or during bear markets. Quick View: Move mouse or cursor over ETF symbol (ticker) to view short-term technical chart and over ETF name to view long term chart. Click on ticker or stock name for detailed view. Click on to add stock symbol to your watchlist and to view watchlist. |
12Stocks.com List of ETFs that track Smallcap Index
| Ticker | ETF Name | Watchlist | Recent Price | Smart Investing & Trading Score | Change % | Week % | Year-to-date % |
| IWM | iShares Russell 2000 | | 193.14 | 23 | 0.16 | -2.79 | -3.77% |
| IJR | iShares Core S&P Small-Cap | | 103.22 | 31 | 0.86 | -1.23 | -4.65% |
| IWN | iShares Russell 2000 Value | | 147.78 | 31 | 0.99 | -1.73 | -4.86% |
| VTWO | Vanguard Russell 2000 ETF | | 78.08 | 23 | 0.17 | -2.79 | -3.72% |
| IWO | iShares Russell 2000 Growth | | 245.29 | 23 | -0.67 | -3.94 | -2.75% |
| IJS | iShares S&P Small-Cap 600 Value | | 95.61 | 32 | 1.16 | -0.58 | -7.24% |
| IJT | iShares S&P Small-Cap 600 Growth | | 122.21 | 31 | 0.53 | -2.06 | -2.34% |
| XSLV | PowerShares S&P SmallCap Low Volatil ETF | | 42.18 | 42 | 1.27 | 0.21 | -4.46% |
| SAA | ProShares Ultra SmallCap600 | | 21.80 | 18 | 0.83 | -3.37 | -12.63% |
| SMLV | SPDR SSGA US Small Cap Low Volatil ETF | | 106.09 | 37 | 2.18 | 1.03 | -5.71% |
| SDD | ProShares UltraShort SmallCap600 | | 20.34 | 76 | -1.69 | 2.57 | 10.38% |
| SBB | ProShares Short SmallCap600 | | 16.84 | 76 | -0.82 | 1.77 | 5.71% |
| 12Stocks.com: Charts, Trends, Fundamental Data and Performances of SmallCap Stocks | |
|
We now take in-depth look at all SmallCap stocks including charts, multi-period performances and overall trends (as measured by Smart Investing & Trading Score). One can sort SmallCap stocks (click link to choose) by Daily, Weekly and by Year-to-Date performances. Also, one can sort by size of the company or by market capitalization. |
| Select Your Default Chart Type: | |||||
| |||||
| Click on stock symbol or name for detailed view. Click on to add stock symbol to your watchlist and to view watchlist. Quick View: Move mouse or cursor over "Daily" to quickly view daily technical stock chart and over "Weekly" to view weekly technical stock chart. | |||||

 | DLX Deluxe Corporation |
| Sector: Services & Goods | |
| SubSector: Business Services | |
| MarketCap: 1025.82 Millions | |
| Recent Price: 19.71 Smart Investing & Trading Score: 73 | |
| Day Percent Change: 4.01% Day Change: 0.76 | |
| Week Change: 2.12% Year-to-date Change: -8.1% | |
| DLX Links: Profile News Message Board | |
| Charts:- Daily , Weekly | |
| Add DLX to Watchlist: View: Get Complete DLX Trend Analysis ➞ | |
 | ODP Office Depot, Inc. |
| Sector: Services & Goods | |
| SubSector: Specialty Retail, Other | |
| MarketCap: 1024.44 Millions | |
| Recent Price: 50.28 Smart Investing & Trading Score: 18 | |
| Day Percent Change: 1.82% Day Change: 0.90 | |
| Week Change: -0.3% Year-to-date Change: -10.7% | |
| ODP Links: Profile News Message Board | |
| Charts:- Daily , Weekly | |
| Add ODP to Watchlist: View: Get Complete ODP Trend Analysis ➞ | |
 | FWRG First Watch Restaurant Group, Inc. |
| Sector: Services & Goods | |
| SubSector: Restaurants | |
| MarketCap: 1000 Millions | |
| Recent Price: 22.30 Smart Investing & Trading Score: 51 | |
| Day Percent Change: 1.09% Day Change: 0.24 | |
| Week Change: -4.09% Year-to-date Change: 11.9% | |
| FWRG Links: Profile News Message Board | |
| Charts:- Daily , Weekly | |
| Add FWRG to Watchlist: View: Get Complete FWRG Trend Analysis ➞ | |
 | HURN Huron Consulting Group Inc. |
| Sector: Services & Goods | |
| SubSector: Management Services | |
| MarketCap: 968.645 Millions | |
| Recent Price: 92.32 Smart Investing & Trading Score: 42 | |
| Day Percent Change: 2.08% Day Change: 1.88 | |
| Week Change: -0.08% Year-to-date Change: -10.2% | |
| HURN Links: Profile News Message Board | |
| Charts:- Daily , Weekly | |
| Add HURN to Watchlist: View: Get Complete HURN Trend Analysis ➞ | |
 | FLWS 1-800-FLOWERS.COM, Inc. |
| Sector: Services & Goods | |
| SubSector: Specialty Retail, Other | |
| MarketCap: 940 Millions | |
| Recent Price: 9.00 Smart Investing & Trading Score: 32 | |
| Day Percent Change: 2.62% Day Change: 0.23 | |
| Week Change: 0.67% Year-to-date Change: -16.5% | |
| FLWS Links: Profile News Message Board | |
| Charts:- Daily , Weekly | |
| Add FLWS to Watchlist: View: Get Complete FLWS Trend Analysis ➞ | |
 | GPI Group 1 Automotive, Inc. |
| Sector: Services & Goods | |
| SubSector: Auto Dealerships | |
| MarketCap: 921.021 Millions | |
| Recent Price: 265.53 Smart Investing & Trading Score: 36 | |
| Day Percent Change: 0.90% Day Change: 2.37 | |
| Week Change: -1.45% Year-to-date Change: -12.9% | |
| GPI Links: Profile News Message Board | |
| Charts:- Daily , Weekly | |
| Add GPI to Watchlist: View: Get Complete GPI Trend Analysis ➞ | |
 | BKE The Buckle, Inc. |
| Sector: Services & Goods | |
| SubSector: Apparel Stores | |
| MarketCap: 913.808 Millions | |
| Recent Price: 36.59 Smart Investing & Trading Score: 25 | |
| Day Percent Change: -0.25% Day Change: -0.09 | |
| Week Change: -0.65% Year-to-date Change: -23.0% | |
| BKE Links: Profile News Message Board | |
| Charts:- Daily , Weekly | |
| Add BKE to Watchlist: View: Get Complete BKE Trend Analysis ➞ | |
 | AMRC Ameresco, Inc. |
| Sector: Services & Goods | |
| SubSector: Technical Services | |
| MarketCap: 898.91 Millions | |
| Recent Price: 18.80 Smart Investing & Trading Score: 20 | |
| Day Percent Change: 1.29% Day Change: 0.24 | |
| Week Change: -10.13% Year-to-date Change: -40.6% | |
| AMRC Links: Profile News Message Board | |
| Charts:- Daily , Weekly | |
| Add AMRC to Watchlist: View: Get Complete AMRC Trend Analysis ➞ | |
 | SES SES AI Corporation |
| Sector: Services & Goods | |
| SubSector: Auto Parts | |
| MarketCap: 893 Millions | |
| Recent Price: 1.27 Smart Investing & Trading Score: 0 | |
| Day Percent Change: -13.90% Day Change: -0.21 | |
| Week Change: -14.77% Year-to-date Change: -29.1% | |
| SES Links: Profile News Message Board | |
| Charts:- Daily , Weekly | |
| Add SES to Watchlist: View: Get Complete SES Trend Analysis ➞ | |
 | IMAX IMAX Corporation |
| Sector: Services & Goods | |
| SubSector: Entertainment - Diversified | |
| MarketCap: 874.237 Millions | |
| Recent Price: 17.13 Smart Investing & Trading Score: 88 | |
| Day Percent Change: 0.12% Day Change: 0.02 | |
| Week Change: 4.26% Year-to-date Change: 14.1% | |
| IMAX Links: Profile News Message Board | |
| Charts:- Daily , Weekly | |
| Add IMAX to Watchlist: View: Get Complete IMAX Trend Analysis ➞ | |
 | CAKE The Cheesecake Factory Incorporated |
| Sector: Services & Goods | |
| SubSector: Restaurants | |
| MarketCap: 829 Millions | |
| Recent Price: 34.00 Smart Investing & Trading Score: 35 | |
| Day Percent Change: 0.56% Day Change: 0.19 | |
| Week Change: 1.64% Year-to-date Change: -2.9% | |
| CAKE Links: Profile News Message Board | |
| Charts:- Daily , Weekly | |
| Add CAKE to Watchlist: View: Get Complete CAKE Trend Analysis ➞ | |
 | CDNA CareDx, Inc |
| Sector: Services & Goods | |
| SubSector: Research Services | |
| MarketCap: 828.194 Millions | |
| Recent Price: 8.31 Smart Investing & Trading Score: 30 | |
| Day Percent Change: 2.97% Day Change: 0.24 | |
| Week Change: -2.58% Year-to-date Change: -30.8% | |
| CDNA Links: Profile News Message Board | |
| Charts:- Daily , Weekly | |
| Add CDNA to Watchlist: View: Get Complete CDNA Trend Analysis ➞ | |
 | IMKTA Ingles Markets, Incorporated |
| Sector: Services & Goods | |
| SubSector: Grocery Stores | |
| MarketCap: 827.075 Millions | |
| Recent Price: 75.34 Smart Investing & Trading Score: 52 | |
| Day Percent Change: 2.70% Day Change: 1.98 | |
| Week Change: 3.19% Year-to-date Change: -12.8% | |
| IMKTA Links: Profile News Message Board | |
| Charts:- Daily , Weekly | |
| Add IMKTA to Watchlist: View: Get Complete IMKTA Trend Analysis ➞ | |
 | XPOF Xponential Fitness, Inc. |
| Sector: Services & Goods | |
| SubSector: Leisure | |
| MarketCap: 811 Millions | |
| Recent Price: 13.15 Smart Investing & Trading Score: 53 | |
| Day Percent Change: 0.31% Day Change: 0.04 | |
| Week Change: -8.62% Year-to-date Change: 0.8% | |
| XPOF Links: Profile News Message Board | |
| Charts:- Daily , Weekly | |
| Add XPOF to Watchlist: View: Get Complete XPOF Trend Analysis ➞ | |
 | MATW Matthews International Corporation |
| Sector: Services & Goods | |
| SubSector: Personal Services | |
| MarketCap: 803.325 Millions | |
| Recent Price: 26.43 Smart Investing & Trading Score: 32 | |
| Day Percent Change: 2.76% Day Change: 0.71 | |
| Week Change: -0.86% Year-to-date Change: -27.9% | |
| MATW Links: Profile News Message Board | |
| Charts:- Daily , Weekly | |
| Add MATW to Watchlist: View: Get Complete MATW Trend Analysis ➞ | |
 | SCHL Scholastic Corporation |
| Sector: Services & Goods | |
| SubSector: Publishing - Books | |
| MarketCap: 791 Millions | |
| Recent Price: 35.68 Smart Investing & Trading Score: 32 | |
| Day Percent Change: 2.44% Day Change: 0.85 | |
| Week Change: -0.22% Year-to-date Change: -5.4% | |
| SCHL Links: Profile News Message Board | |
| Charts:- Daily , Weekly | |
| Add SCHL to Watchlist: View: Get Complete SCHL Trend Analysis ➞ | |
 | SSP The E.W. Scripps Company |
| Sector: Services & Goods | |
| SubSector: Broadcasting - TV | |
| MarketCap: 766.163 Millions | |
| Recent Price: 3.59 Smart Investing & Trading Score: 52 | |
| Day Percent Change: 4.06% Day Change: 0.14 | |
| Week Change: 12.19% Year-to-date Change: -55.1% | |
| SSP Links: Profile News Message Board | |
| Charts:- Daily , Weekly | |
| Add SSP to Watchlist: View: Get Complete SSP Trend Analysis ➞ | |
 | MOND Mondee Holdings, Inc. |
| Sector: Services & Goods | |
| SubSector: Travel Services | |
| MarketCap: 744 Millions | |
| Recent Price: 2.19 Smart Investing & Trading Score: 32 | |
| Day Percent Change: 0.46% Day Change: 0.01 | |
| Week Change: -4.78% Year-to-date Change: -21.2% | |
| MOND Links: Profile News Message Board | |
| Charts:- Daily , Weekly | |
| Add MOND to Watchlist: View: Get Complete MOND Trend Analysis ➞ | |
 | REZI Resideo Technologies, Inc. |
| Sector: Services & Goods | |
| SubSector: Security & Protection Services | |
| MarketCap: 712.603 Millions | |
| Recent Price: 19.27 Smart Investing & Trading Score: 36 | |
| Day Percent Change: 0.36% Day Change: 0.07 | |
| Week Change: -8.59% Year-to-date Change: 2.4% | |
| REZI Links: Profile News Message Board | |
| Charts:- Daily , Weekly | |
| Add REZI to Watchlist: View: Get Complete REZI Trend Analysis ➞ | |
 | IHRT iHeartMedia, Inc. |
| Sector: Services & Goods | |
| SubSector: Broadcasting - Radio | |
| MarketCap: 694 Millions | |
| Recent Price: 1.90 Smart Investing & Trading Score: 10 | |
| Day Percent Change: -1.55% Day Change: -0.03 | |
| Week Change: -12.84% Year-to-date Change: -28.8% | |
| IHRT Links: Profile News Message Board | |
| Charts:- Daily , Weekly | |
| Add IHRT to Watchlist: View: Get Complete IHRT Trend Analysis ➞ | |
 | MED Medifast, Inc. |
| Sector: Services & Goods | |
| SubSector: Specialty Retail, Other | |
| MarketCap: 681.044 Millions | |
| Recent Price: 32.44 Smart Investing & Trading Score: 45 | |
| Day Percent Change: -0.09% Day Change: -0.03 | |
| Week Change: 2.95% Year-to-date Change: -51.7% | |
| MED Links: Profile News Message Board | |
| Charts:- Daily , Weekly | |
| Add MED to Watchlist: View: Get Complete MED Trend Analysis ➞ | |
 | RVLV Revolve Group, Inc. |
| Sector: Services & Goods | |
| SubSector: Specialty Retail, Other | |
| MarketCap: 652.244 Millions | |
| Recent Price: 19.20 Smart Investing & Trading Score: 61 | |
| Day Percent Change: 0.42% Day Change: 0.08 | |
| Week Change: 2.62% Year-to-date Change: 15.8% | |
| RVLV Links: Profile News Message Board | |
| Charts:- Daily , Weekly | |
| Add RVLV to Watchlist: View: Get Complete RVLV Trend Analysis ➞ | |
 | BATRK The Liberty Braves Group |
| Sector: Services & Goods | |
| SubSector: Broadcasting - TV | |
| MarketCap: 638.363 Millions | |
| Recent Price: 37.28 Smart Investing & Trading Score: 10 | |
| Day Percent Change: 0.35% Day Change: 0.13 | |
| Week Change: -3.24% Year-to-date Change: -5.8% | |
| BATRK Links: Profile News Message Board | |
| Charts:- Daily , Weekly | |
| Add BATRK to Watchlist: View: Get Complete BATRK Trend Analysis ➞ | |
 | MYPS PLAYSTUDIOS, Inc. |
| Sector: Services & Goods | |
| SubSector: Electronic Gaming & Multimedia | |
| MarketCap: 635 Millions | |
| Recent Price: 2.31 Smart Investing & Trading Score: 36 | |
| Day Percent Change: -1.28% Day Change: -0.03 | |
| Week Change: -11.49% Year-to-date Change: -13.6% | |
| MYPS Links: Profile News Message Board | |
| Charts:- Daily , Weekly | |
| Add MYPS to Watchlist: View: Get Complete MYPS Trend Analysis ➞ | |
 | JACK Jack in the Box Inc. |
| Sector: Services & Goods | |
| SubSector: Restaurants | |
| MarketCap: 633.87 Millions | |
| Recent Price: 59.64 Smart Investing & Trading Score: 17 | |
| Day Percent Change: 2.54% Day Change: 1.48 | |
| Week Change: 0.15% Year-to-date Change: -26.9% | |
| JACK Links: Profile News Message Board | |
| Charts:- Daily , Weekly | |
| Add JACK to Watchlist: View: Get Complete JACK Trend Analysis ➞ | |
| For tabular summary view of above stock list: Summary View ➞ 0 - 25 , 25 - 50 , 50 - 75 , 75 - 100 , 100 - 125 , 125 - 150 , 150 - 175 , 175 - 200 , 200 - 225 | ||
| Click To Change The Sort Order: By Market Cap or Company Size Performance: Year-to-date, Week and Day | |
| Select Chart Type: | ||
| Too many stocks? View smallcap stocks filtered by marketcap & sector |
| Marketcap: All SmallCap Stocks (default-no microcap), Large, Mid-Range, Small & MicroCap |
| Sector: Tech, Finance, Energy, Staples, Retail, Industrial, Materials, Utilities & Medical |
|
Best Stocks Today 12Stocks.com |
© 2024 12Stocks.com Terms & Conditions Privacy Contact Us
All Information Provided Only For Education And Not To Be Used For Investing or Trading. See Terms & Conditions


One More Thing ... Get Best Stocks Delivered Daily!
Never Ever Miss A Move With Our Top Ten Stocks Lists
Find Best Stocks In Any Market - Bull or Bear Market
Take A Peek At Our Top Ten Stocks Lists: Daily, Weekly, Year-to-Date & Top Trends
Find Best Stocks In Any Market - Bull or Bear Market
Take A Peek At Our Top Ten Stocks Lists: Daily, Weekly, Year-to-Date & Top Trends
Smallcap Stocks With Best Up Trends [0-bearish to 100-bullish]: Vertex Energy[100], BancFirst [100], Calavo Growers[100], Old Second[100], Excelerate Energy[100], Gannett Co[100], Core Molding[100], Angel Oak[100], Tejon Ranch[100], United Fire[100], Victory Capital[100]
Best Smallcap Stocks Year-to-Date:
Agenus [541.38%], CareMax [429.9%], Janux [353.14%], Viking [240.78%], Alpine Immune[238.94%], Longboard [185.43%], Arcutis Bio[181.42%], Avidity Biosciences[153.65%], Super Micro[151.06%], Vera [145.48%], Stoke [129.66%] Best Smallcap Stocks This Week:
Macatawa Bank[47.34%], Vertex Energy[43.27%], Snap One[29.73%], Humacyte [28.47%], Vanda [24.03%], ALX Oncology[22.49%], ContextLogic [16.8%], ProKidney [16.57%], Calavo Growers[16.24%], Badger Meter[15.61%], Accolade [13.45%] Best Smallcap Stocks Daily:
Tellurian [28.11%], Origin Materials[19.59%], Metropolitan Bank[18.01%], Genelux [14.25%], Humacyte [14.02%], Vertex Energy[13.74%], Chemung Financial[10.29%], Gevo [10.14%], Riot Blockchain[10.13%], Marathon Patent[9.78%], Emergent BioSolutions[9.68%]