
 Login Sign Up


| |||||
 |  | ||||

| 12Stocks.com Market Intelligence |
Best S&P 100 Stocks
| In a hurry? S&P 100 Stocks Lists: Performance Trends Table, Stock Charts
Sort S&P 100 stocks: Daily, Weekly, Year-to-Date, Market Cap & Trends. |
| 12Stocks.com S&P 100 Stocks Performances & Trends Daily | |||||||||
|
|  The overall Smart Investing & Trading Score is 90 (0-bearish to 100-bullish) which puts S&P 100 index in short term bullish trend. The Smart Investing & Trading Score from previous trading session is 80 and an improvement of trend continues.
| ||||||||
Here are the Smart Investing & Trading Scores of the most requested S&P 100 stocks at 12Stocks.com (click stock name for detailed review):
|


| 12Stocks.com: Top Performing S&P 100 Index Stocks | ||||||||||||||||||||||||||||||||||||||||||||||||
 The top performing S&P 100 Index stocks year to date are
Now, more recently, over last week, the top performing S&P 100 Index stocks on the move are


|
||||||||||||||||||||||||||||||||||||||||||||||||
| 12Stocks.com: Investing in S&P 100 Index with Stocks | |
|
The following table helps investors and traders sort through current performance and trends (as measured by Smart Investing & Trading Score) of various
stocks in the S&P 100 Index. Quick View: Move mouse or cursor over stock symbol (ticker) to view short-term technical chart and over stock name to view long term chart. Click on  to add stock symbol to your watchlist and to add stock symbol to your watchlist and  to view watchlist. Click on any ticker or stock name for detailed market intelligence report for that stock. to view watchlist. Click on any ticker or stock name for detailed market intelligence report for that stock. |
12Stocks.com Performance of Stocks in S&P 100 Index
| Ticker | Stock Name | Watchlist | Category | Recent Price | Smart Investing & Trading Score | Change % | YTD Change% |
| MET | Metlife |   | Financials | 81.33 | 50 | -0.73% | 1.61% |
| COST | Costco Wholesale | | Consumer Staples | 916.77 | 30 | -0.06% | 1.15% |
| AMZN | Amazon.com | | Services & Goods | 222.42 | 50 | 0.81% | 1.00% |
| TMO | Thermo Fisher | | Health Care | 524.96 | 100 | -1.09% | 0.65% |
| TXN | Texas Instruments | | Technology | 182.30 | 30 | 1.06% | -0.21% |
| PEP | PepsiCo | | Consumer Staples | 142.31 | 70 | -0.58% | -3.37% |
| SBUX | Starbucks Corp | | Services & Goods | 86.73 | 80 | 2.76% | -4.73% |
| COP | Conoco Phillips | | Energy | 93.38 | 40 | -2.18% | -5.14% |
| HON | Honeywell | | Industrials | 210.96 | 60 | 0.37% | -5.47% |
| PG | Procter & Gamble Co | | Consumer Staples | 152.05 | 20 | -0.74% | -6.61% |
| MRK | Merck & Co | | Health Care | 89.51 | 100 | -0.69% | -8.05% |
| DHR | Danaher Corp | | Health Care | 210.33 | 100 | -1.20% | -8.19% |
| FDX | Fedex Corp | | Industrials | 242.32 | 100 | 1.16% | -10.60% |
| CL | Colgate-Palmolive Co | | Consumer Staples | 78.31 | 0 | -0.89% | -12.02% |
| KHC | Kraft Heinz | | Consumer Staples | 26.07 | 50 | -0.80% | -12.89% |
| CMCSA | Comcast Corp | | Technology | 30.40 | 0 | -1.75% | -16.58% |
| BMY | Bristol-Myers | | Health Care | 45.73 | 80 | -3.58% | -16.62% |
| PYPL | PayPal | | Financials | 68.93 | 70 | 3.41% | -20.02% |
| ADBE | Adobe | | Technology | 351.55 | 50 | 2.28% | -20.28% |
| CHTR | Charter | | Technology | 269.61 | 40 | -2.00% | -22.83% |
| CRM | Salesforce | | Technology | 238.88 | 10 | 1.35% | -27.53% |
| UPS | United Parcel | | Industrials | 85.57 | 80 | 1.41% | -28.78% |
| ACN | Accenture | | Technology | 244.34 | 40 | 0.26% | -28.95% |
| UNH | Unitedhealth | | Health Care | 353.72 | 100 | 1.56% | -29.09% |
| TGT | Target Corp | | Consumer Staples | 89.51 | 70 | 0.42% | -33.45% |
| For chart view version of above stock list: Chart View ➞ 0 - 25 , 25 - 50 , 50 - 75 , 75 - 100 , 100 - 125 | ||
 | Click To Change The Sort Order: By Market Cap or Company Size Performance: Year-to-date, Week and Day |  |
|
Get the most comprehensive stock market coverage daily at 12Stocks.com ➞ Best Stocks Today ➞ Best Stocks Weekly ➞ Best Stocks Year-to-Date ➞ Best Stocks Trends ➞  Best Stocks Today 12Stocks.com Best Nasdaq Stocks ➞ Best S&P 500 Stocks ➞ Best Tech Stocks ➞ Best Biotech Stocks ➞ |
| Detailed Overview of S&P 100 Stocks |
| S&P 100 Technical Overview, Leaders & Laggards, Top S&P 100 ETF Funds & Detailed S&P 100 Stocks List, Charts, Trends & More |
| S&P 100: Technical Analysis, Trends & YTD Performance | |
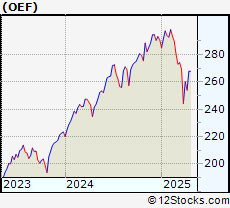
| S&P 100 index as represented by
OEF, an exchange-traded fund [ETF], holds basket of one hundred US (mostly largecap) stocks from across all major sectors of the US stock market. The S&P 100 index (contains stocks like Apple and Exxon) is up by 16.5396% and is currently outperforming the overall market by 1.7817% year-to-date. Below is a quick view of technical charts and trends: | |
 OEF Weekly Chart |
|
| Long Term Trend: Very Good | |
| Medium Term Trend: Good | |
 OEF Daily Chart |
|
| Short Term Trend: Very Good | |
| Overall Trend Score: 90 | |
| YTD Performance: 16.5396% | |
| **Trend Scores & Views Are Only For Educational Purposes And Not For Investing | |
| 12Stocks.com: Investing in S&P 100 Index using Exchange Traded Funds | |
|
The following table shows list of key exchange traded funds (ETF) that
help investors track S&P 100 index. We have also included ETF funds that track S&P 500 index since it is market-cap weighted. The following list also includes leveraged ETF funds that track twice or thrice the daily returns of S&P 100 indices. Short or inverse ETF funds move in the opposite direction to the index they track and are useful during market pullbacks or during bear markets. Quick View: Move mouse or cursor over ETF symbol (ticker) to view short-term technical chart and over ETF name to view long term chart. Click on ticker or stock name for detailed view. Click on to add stock symbol to your watchlist and to view watchlist. |
12Stocks.com List of ETFs that track S&P 100 Index
| Ticker | ETF Name | Watchlist | Recent Price | Smart Investing & Trading Score | Change % | Week % | Year-to-date % |
| SPY | SPDR S&P 500 ETF Trust | | 669.22 | 90 | 0.115192 | 1.22826 | 15.1527% |
| SPXU | ProShares UltraPro Short S&P 500 | | 13.34 | 10 | -0.224383 | -3.26323 | -40.0301% |
| SDS | ProShares UltraShort S&P500 -2x Shares | | 14.33 | 10 | -0.139373 | -2.1843 | -25.9516% |
| SH | ProShares Short S&P500 -1x Shares | | 36.80 | 10 | -0.0543183 | -1.07527 | -11.8852% |
| VOO | Vanguard S&P 500 ETF | | 615.25 | 90 | 0.107389 | 0.943396 | 15.2251% |
| UPRO | ProShares UltraPro S&P 500 ETF 3x Shares | | 113.01 | 90 | 0.275067 | 3.45112 | 29.2069% |
| SPXS | Direxion Daily S&P 500 Bear -3X Shares | | 37.50 | 70 | -0.239425 | 868.992 | 503.962% |
| SPXL | Direxion Daily S&P 500 Bull 3X Shares | | 214.76 | 90 | 0.28953 | 3.47386 | 29.2396% |
| SSO | ProShares Ultra S&P500 2x Shares | | 113.12 | 90 | 0.177117 | 2.334 | 23.4297% |
| OEF | iShares S&P 100 ETF | | 334.28 | 90 | 0.00598337 | 1.05505 | 16.5396% |
| 12Stocks.com: Charts, Trends, Fundamental Data and Performances of S&P 100 Stocks | |
|
We now take in-depth look at all S&P 100 stocks including charts, multi-period performances and overall trends (as measured by Smart Investing & Trading Score). One can sort S&P 100 stocks (click link to choose) by Daily, Weekly and by Year-to-Date performances. Also, one can sort by size of the company or by market capitalization. |
| Select Your Default Chart Type: | |||||
| |||||
| Click on stock symbol or name for detailed view. Click on to add stock symbol to your watchlist and to view watchlist. Quick View: Move mouse or cursor over "Daily" to quickly view daily technical stock chart and over "Weekly" to view weekly technical stock chart. | |||||

 | MET Metlife Inc |
| Sector: Financials | |
| SubSector: Insurance - Life | |
| MarketCap: 52876.2 Millions | |
| Recent Price: 81.33 Smart Investing & Trading Score: 50 | |
| Day Percent Change: -0.732332% Day Change: -0.25 | |
| Week Change: 0.855655% Year-to-date Change: 1.6% | |
| MET Links: Profile News Message Board | |
| Charts:- Daily , Weekly | |
| Add MET to Watchlist: View: Get Complete MET Trend Analysis ➞ | |
 | COST Costco Wholesale Corp |
| Sector: Consumer Staples | |
| SubSector: Discount Stores | |
| MarketCap: 427281 Millions | |
| Recent Price: 916.77 Smart Investing & Trading Score: 30 | |
| Day Percent Change: -0.0621362% Day Change: 0.44 | |
| Week Change: -3.01501% Year-to-date Change: 1.1% | |
| COST Links: Profile News Message Board | |
| Charts:- Daily , Weekly | |
| Add COST to Watchlist: View: Get Complete COST Trend Analysis ➞ | |
 | AMZN Amazon.com Inc |
| Sector: Services & Goods | |
| SubSector: Internet Retail | |
| MarketCap: 2477780 Millions | |
| Recent Price: 222.42 Smart Investing & Trading Score: 50 | |
| Day Percent Change: 0.811313% Day Change: 1.41 | |
| Week Change: 1.00359% Year-to-date Change: 1.0% | |
| AMZN Links: Profile News Message Board | |
| Charts:- Daily , Weekly | |
| Add AMZN to Watchlist: View: Get Complete AMZN Trend Analysis ➞ | |
 | TMO Thermo Fisher Scientific Inc |
| Sector: Health Care | |
| SubSector: Diagnostics & Research | |
| MarketCap: 186012 Millions | |
| Recent Price: 524.96 Smart Investing & Trading Score: 100 | |
| Day Percent Change: -1.08718% Day Change: -2.56 | |
| Week Change: 12.1709% Year-to-date Change: 0.6% | |
| TMO Links: Profile News Message Board | |
| Charts:- Daily , Weekly | |
| Add TMO to Watchlist: View: Get Complete TMO Trend Analysis ➞ | |
 | TXN Texas Instruments Inc |
| Sector: Technology | |
| SubSector: Semiconductors | |
| MarketCap: 170854 Millions | |
| Recent Price: 182.30 Smart Investing & Trading Score: 30 | |
| Day Percent Change: 1.05882% Day Change: 1.79 | |
| Week Change: -1.15759% Year-to-date Change: -0.2% | |
| TXN Links: Profile News Message Board | |
| Charts:- Daily , Weekly | |
| Add TXN to Watchlist: View: Get Complete TXN Trend Analysis ➞ | |
 | PEP PepsiCo Inc |
| Sector: Consumer Staples | |
| SubSector: Beverages - Non-Alcoholic | |
| MarketCap: 200419 Millions | |
| Recent Price: 142.31 Smart Investing & Trading Score: 70 | |
| Day Percent Change: -0.579852% Day Change: -1.2 | |
| Week Change: 0.0984737% Year-to-date Change: -3.4% | |
| PEP Links: Profile News Message Board | |
| Charts:- Daily , Weekly | |
| Add PEP to Watchlist: View: Get Complete PEP Trend Analysis ➞ | |
 | SBUX Starbucks Corp |
| Sector: Services & Goods | |
| SubSector: Restaurants | |
| MarketCap: 97108.3 Millions | |
| Recent Price: 86.73 Smart Investing & Trading Score: 80 | |
| Day Percent Change: 2.76066% Day Change: 2.34 | |
| Week Change: 2.91919% Year-to-date Change: -4.7% | |
| SBUX Links: Profile News Message Board | |
| Charts:- Daily , Weekly | |
| Add SBUX to Watchlist: View: Get Complete SBUX Trend Analysis ➞ | |
 | COP Conoco Phillips |
| Sector: Energy | |
| SubSector: Oil & Gas E&P | |
| MarketCap: 116089 Millions | |
| Recent Price: 93.38 Smart Investing & Trading Score: 40 | |
| Day Percent Change: -2.17892% Day Change: -1.78 | |
| Week Change: -2.35282% Year-to-date Change: -5.1% | |
| COP Links: Profile News Message Board | |
| Charts:- Daily , Weekly | |
| Add COP to Watchlist: View: Get Complete COP Trend Analysis ➞ | |
 | HON Honeywell International Inc |
| Sector: Industrials | |
| SubSector: Conglomerates | |
| MarketCap: 136027 Millions | |
| Recent Price: 210.96 Smart Investing & Trading Score: 60 | |
| Day Percent Change: 0.37111% Day Change: 1.73 | |
| Week Change: 1.13135% Year-to-date Change: -5.5% | |
| HON Links: Profile News Message Board | |
| Charts:- Daily , Weekly | |
| Add HON to Watchlist: View: Get Complete HON Trend Analysis ➞ | |
 | PG Procter & Gamble Co |
| Sector: Consumer Staples | |
| SubSector: Household & Personal Products | |
| MarketCap: 374826 Millions | |
| Recent Price: 152.05 Smart Investing & Trading Score: 20 | |
| Day Percent Change: -0.737694% Day Change: -1.13 | |
| Week Change: -0.24275% Year-to-date Change: -6.6% | |
| PG Links: Profile News Message Board | |
| Charts:- Daily , Weekly | |
| Add PG to Watchlist: View: Get Complete PG Trend Analysis ➞ | |
 | MRK Merck & Co Inc |
| Sector: Health Care | |
| SubSector: Drug Manufacturers - General | |
| MarketCap: 211587 Millions | |
| Recent Price: 89.51 Smart Investing & Trading Score: 100 | |
| Day Percent Change: -0.687895% Day Change: -1.1 | |
| Week Change: 12.3509% Year-to-date Change: -8.0% | |
| MRK Links: Profile News Message Board | |
| Charts:- Daily , Weekly | |
| Add MRK to Watchlist: View: Get Complete MRK Trend Analysis ➞ | |
 | DHR Danaher Corp |
| Sector: Health Care | |
| SubSector: Diagnostics & Research | |
| MarketCap: 143361 Millions | |
| Recent Price: 210.33 Smart Investing & Trading Score: 100 | |
| Day Percent Change: -1.19786% Day Change: -1.46 | |
| Week Change: 13.1354% Year-to-date Change: -8.2% | |
| DHR Links: Profile News Message Board | |
| Charts:- Daily , Weekly | |
| Add DHR to Watchlist: View: Get Complete DHR Trend Analysis ➞ | |
 | FDX Fedex Corp |
| Sector: Industrials | |
| SubSector: Integrated Freight & Logistics | |
| MarketCap: 53718.9 Millions | |
| Recent Price: 242.32 Smart Investing & Trading Score: 100 | |
| Day Percent Change: 1.15633% Day Change: 2.5 | |
| Week Change: 3.66631% Year-to-date Change: -10.6% | |
| FDX Links: Profile News Message Board | |
| Charts:- Daily , Weekly | |
| Add FDX to Watchlist: View: Get Complete FDX Trend Analysis ➞ | |
 | CL Colgate-Palmolive Co |
| Sector: Consumer Staples | |
| SubSector: Household & Personal Products | |
| MarketCap: 68803.8 Millions | |
| Recent Price: 78.31 Smart Investing & Trading Score: 0 | |
| Day Percent Change: -0.885964% Day Change: -0.47 | |
| Week Change: -3.4759% Year-to-date Change: -12.0% | |
| CL Links: Profile News Message Board | |
| Charts:- Daily , Weekly | |
| Add CL to Watchlist: View: Get Complete CL Trend Analysis ➞ | |
 | KHC Kraft Heinz Co |
| Sector: Consumer Staples | |
| SubSector: Packaged Foods | |
| MarketCap: 32300.4 Millions | |
| Recent Price: 26.07 Smart Investing & Trading Score: 50 | |
| Day Percent Change: -0.799087% Day Change: -0.27 | |
| Week Change: -2.50561% Year-to-date Change: -12.9% | |
| KHC Links: Profile News Message Board | |
| Charts:- Daily , Weekly | |
| Add KHC to Watchlist: View: Get Complete KHC Trend Analysis ➞ | |
 | CMCSA Comcast Corp |
| Sector: Technology | |
| SubSector: Telecom Services | |
| MarketCap: 125203 Millions | |
| Recent Price: 30.40 Smart Investing & Trading Score: 0 | |
| Day Percent Change: -1.74531% Day Change: -0.22 | |
| Week Change: -3.8279% Year-to-date Change: -16.6% | |
| CMCSA Links: Profile News Message Board | |
| Charts:- Daily , Weekly | |
| Add CMCSA to Watchlist: View: Get Complete CMCSA Trend Analysis ➞ | |
 | BMY Bristol-Myers Squibb Co |
| Sector: Health Care | |
| SubSector: Drug Manufacturers - General | |
| MarketCap: 95950.5 Millions | |
| Recent Price: 45.73 Smart Investing & Trading Score: 80 | |
| Day Percent Change: -3.58423% Day Change: -1.45 | |
| Week Change: 3.55525% Year-to-date Change: -16.6% | |
| BMY Links: Profile News Message Board | |
| Charts:- Daily , Weekly | |
| Add BMY to Watchlist: View: Get Complete BMY Trend Analysis ➞ | |
 | PYPL PayPal Holdings Inc |
| Sector: Financials | |
| SubSector: Credit Services | |
| MarketCap: 65214.1 Millions | |
| Recent Price: 68.93 Smart Investing & Trading Score: 70 | |
| Day Percent Change: 3.40534% Day Change: 1.84 | |
| Week Change: 1.57678% Year-to-date Change: -20.0% | |
| PYPL Links: Profile News Message Board | |
| Charts:- Daily , Weekly | |
| Add PYPL to Watchlist: View: Get Complete PYPL Trend Analysis ➞ | |
 | ADBE Adobe Inc |
| Sector: Technology | |
| SubSector: Software - Application | |
| MarketCap: 148033 Millions | |
| Recent Price: 351.55 Smart Investing & Trading Score: 50 | |
| Day Percent Change: 2.27802% Day Change: 6.51 | |
| Week Change: -0.48688% Year-to-date Change: -20.3% | |
| ADBE Links: Profile News Message Board | |
| Charts:- Daily , Weekly | |
| Add ADBE to Watchlist: View: Get Complete ADBE Trend Analysis ➞ | |
 | CHTR Charter Communications Inc |
| Sector: Technology | |
| SubSector: Telecom Services | |
| MarketCap: 39864.3 Millions | |
| Recent Price: 269.61 Smart Investing & Trading Score: 40 | |
| Day Percent Change: -1.99564% Day Change: -1.21 | |
| Week Change: 2.36152% Year-to-date Change: -22.8% | |
| CHTR Links: Profile News Message Board | |
| Charts:- Daily , Weekly | |
| Add CHTR to Watchlist: View: Get Complete CHTR Trend Analysis ➞ | |
 | CRM Salesforce Inc |
| Sector: Technology | |
| SubSector: Software - Application | |
| MarketCap: 238724 Millions | |
| Recent Price: 238.88 Smart Investing & Trading Score: 10 | |
| Day Percent Change: 1.35347% Day Change: 3.19 | |
| Week Change: -2.85087% Year-to-date Change: -27.5% | |
| CRM Links: Profile News Message Board | |
| Charts:- Daily , Weekly | |
| Add CRM to Watchlist: View: Get Complete CRM Trend Analysis ➞ | |
 | UPS United Parcel Service, Inc |
| Sector: Industrials | |
| SubSector: Integrated Freight & Logistics | |
| MarketCap: 72077.3 Millions | |
| Recent Price: 85.57 Smart Investing & Trading Score: 80 | |
| Day Percent Change: 1.41029% Day Change: 1.58 | |
| Week Change: 1.99046% Year-to-date Change: -28.8% | |
| UPS Links: Profile News Message Board | |
| Charts:- Daily , Weekly | |
| Add UPS to Watchlist: View: Get Complete UPS Trend Analysis ➞ | |
 | ACN Accenture plc |
| Sector: Technology | |
| SubSector: Information Technology Services | |
| MarketCap: 158796 Millions | |
| Recent Price: 244.34 Smart Investing & Trading Score: 40 | |
| Day Percent Change: 0.258504% Day Change: 0.3 | |
| Week Change: 2.2001% Year-to-date Change: -29.0% | |
| ACN Links: Profile News Message Board | |
| Charts:- Daily , Weekly | |
| Add ACN to Watchlist: View: Get Complete ACN Trend Analysis ➞ | |
 | UNH Unitedhealth Group Inc |
| Sector: Health Care | |
| SubSector: Healthcare Plans | |
| MarketCap: 285640 Millions | |
| Recent Price: 353.72 Smart Investing & Trading Score: 100 | |
| Day Percent Change: 1.55613% Day Change: 5.44 | |
| Week Change: 0.542907% Year-to-date Change: -29.1% | |
| UNH Links: Profile News Message Board | |
| Charts:- Daily , Weekly | |
| Add UNH to Watchlist: View: Get Complete UNH Trend Analysis ➞ | |
 | TGT Target Corp |
| Sector: Consumer Staples | |
| SubSector: Discount Stores | |
| MarketCap: 42336.4 Millions | |
| Recent Price: 89.51 Smart Investing & Trading Score: 70 | |
| Day Percent Change: 0.415077% Day Change: 0.57 | |
| Week Change: 1.35885% Year-to-date Change: -33.4% | |
| TGT Links: Profile News Message Board | |
| Charts:- Daily , Weekly | |
| Add TGT to Watchlist: View: Get Complete TGT Trend Analysis ➞ | |
| For tabular summary view of above stock list: Summary View ➞ 0 - 25 , 25 - 50 , 50 - 75 , 75 - 100 , 100 - 125 | ||
| Click To Change The Sort Order: By Market Cap or Company Size Performance: Year-to-date, Week and Day | |
| Select Chart Type: | ||
|
Best Stocks Today 12Stocks.com |
� 2025 12Stocks.com Terms & Conditions Privacy Contact Us
All Information Provided Only For Education And Not To Be Used For Investing or Trading. See Terms & Conditions


One More Thing ... Get Best Stocks Delivered Daily!
Never Ever Miss A Move With Our Top Ten Stocks Lists
Find Best Stocks In Any Market - Bull or Bear Market
Take A Peek At Our Top Ten Stocks Lists: Daily, Weekly, Year-to-Date & Top Trends
Find Best Stocks In Any Market - Bull or Bear Market
Take A Peek At Our Top Ten Stocks Lists: Daily, Weekly, Year-to-Date & Top Trends
S&P 100 Stocks With Best Up Trends [0-bearish to 100-bullish]: Intel Corp[100], Caterpillar [100], Unitedhealth [100], Fedex Corp[100], NVIDIA Corp[100], CVS Health[100], General Dynamics[100], Johnson & Johnson[100], AMGEN [100], Ford Motor[100], Pfizer [100]
Best S&P 100 Stocks Year-to-Date:
Intel Corp[84.4708%], CVS Health[81.156%], GE Aerospace[78.2112%], Oracle Corp[75.3817%], Broadcom [46.567%], Citi [42.1898%], Advanced Micro[40.703%], Bank Of[39.805%], Caterpillar [38.0414%], Goldman Sachs[36.9027%], NVIDIA Corp[36.6279%] Best S&P 100 Stocks This Week:
Intel Corp[19.4747%], Danaher Corp[13.1354%], Pfizer [12.4118%], Merck & Co[12.3509%], Thermo Fisher[12.1709%], Lilly(Eli) & Co[10.5143%], Abbvie [7.53216%], Business[7.17303%], NVIDIA Corp[6.76386%], AMGEN [6.51099%], NextEra Energy[5.89191%] Best S&P 100 Stocks Daily:
Intel Corp[3.78408%], Advanced Micro[3.48759%], PayPal [3.40534%], Dow [2.77657%], Starbucks Corp[2.76066%], Adobe [2.27802%], Deere & Co[2.23364%], Caterpillar [2.02779%], 3M Co[1.79487%], Blackrock [1.70629%], Unitedhealth [1.55613%]