
 Login Sign Up


| |||||
 |  | ||||

| 12Stocks.com Market Intelligence |
Best S&P 100 Stocks
| In a hurry? S&P 100 Stocks Lists: Performance Trends Table, Stock Charts
Sort S&P 100 stocks: Daily, Weekly, Year-to-Date, Market Cap & Trends. |
| 12Stocks.com S&P 100 Stocks Performances & Trends Daily | |||||||||
|
|  The overall Smart Investing & Trading Score is 90 (0-bearish to 100-bullish) which puts S&P 100 index in short term bullish trend. The Smart Investing & Trading Score from previous trading session is 80 and an improvement of trend continues.
| ||||||||
Here are the Smart Investing & Trading Scores of the most requested S&P 100 stocks at 12Stocks.com (click stock name for detailed review):
|


| 12Stocks.com: Top Performing S&P 100 Index Stocks | ||||||||||||||||||||||||||||||||||||||||||||||||
 The top performing S&P 100 Index stocks year to date are
Now, more recently, over last week, the top performing S&P 100 Index stocks on the move are


|
||||||||||||||||||||||||||||||||||||||||||||||||
| 12Stocks.com: Investing in S&P 100 Index with Stocks | |
|
The following table helps investors and traders sort through current performance and trends (as measured by Smart Investing & Trading Score) of various
stocks in the S&P 100 Index. Quick View: Move mouse or cursor over stock symbol (ticker) to view short-term technical chart and over stock name to view long term chart. Click on  to add stock symbol to your watchlist and to add stock symbol to your watchlist and  to view watchlist. Click on any ticker or stock name for detailed market intelligence report for that stock. to view watchlist. Click on any ticker or stock name for detailed market intelligence report for that stock. |
12Stocks.com Performance of Stocks in S&P 100 Index
| Ticker | Stock Name | Watchlist | Category | Recent Price | Smart Investing & Trading Score | Change % | YTD Change% |
| LOW | Lowe's Cos |   | Services & Goods | 247.33 | 30 | -0.27 | 1.65% |
| ABT | Abbott | | Health Care | 132.99 | 20 | -0.36 | 18.93% |
| AMGN | AMGEN | | Health Care | 297.40 | 100 | -0.37 | 16.65% |
| WMT | Walmart | | Consumer Staples | 101.57 | 20 | -0.38 | 13.44% |
| BAC | Bank Of | | Financials | 50.48 | 20 | -0.39 | 15.37% |
| SPG | Simon Property | | Financials | 185.01 | 50 | -0.40 | 9.36% |
| F | Ford Motor | | Services & Goods | 12.22 | 100 | -0.41 | 34.46% |
| BK | Bank Of | | Financials | 106.38 | 20 | -0.42 | 39.81% |
| WFC | Wells Fargo | | Financials | 80.50 | 20 | -0.46 | 16.57% |
| PFE | Pfizer | | Health Care | 27.08 | 100 | -0.48 | 7.24% |
| GE | GE Aerospace | | Industrials | 299.45 | 70 | -0.48 | 78.21% |
| HD | Home Depot | | Services & Goods | 395.01 | 10 | -0.51 | 2.97% |
| GILD | Gilead Sciences | | Health Care | 110.56 | 0 | -0.53 | 22.04% |
| V | Visa | | Financials | 345.95 | 80 | -0.54 | 10.60% |
| PEP | PepsiCo | | Consumer Staples | 142.31 | 70 | -0.58 | -3.37% |
| NEE | NextEra Energy | | Utilities | 78.18 | 100 | -0.62 | 10.96% |
| XOM | Exxon Mobil | | Energy | 111.29 | 20 | -0.63 | 5.60% |
| CSCO | Cisco Systems | | Technology | 68.31 | 70 | -0.64 | 17.85% |
| DUK | Duke Energy | | Utilities | 121.57 | 10 | -0.67 | 14.83% |
| LLY | Lilly(Eli) & Co | | Health Care | 819.85 | 100 | -0.67 | 5.77% |
| MRK | Merck & Co | | Health Care | 89.51 | 100 | -0.69 | -8.05% |
| DIS | Walt Disney | | Technology | 112.14 | 0 | -0.72 | 1.62% |
| MET | Metlife | | Financials | 81.33 | 50 | -0.73 | 1.61% |
| NFLX | Netflix | | Technology | 1162.30 | 10 | -0.73 | 31.08% |
| PG | Procter & Gamble Co | | Consumer Staples | 152.05 | 20 | -0.74 | -6.61% |
| For chart view version of above stock list: Chart View ➞ 0 - 25 , 25 - 50 , 50 - 75 , 75 - 100 , 100 - 125 | ||
 | Click To Change The Sort Order: By Market Cap or Company Size Performance: Year-to-date, Week and Day |  |
|
Get the most comprehensive stock market coverage daily at 12Stocks.com ➞ Best Stocks Today ➞ Best Stocks Weekly ➞ Best Stocks Year-to-Date ➞ Best Stocks Trends ➞  Best Stocks Today 12Stocks.com Best Nasdaq Stocks ➞ Best S&P 500 Stocks ➞ Best Tech Stocks ➞ Best Biotech Stocks ➞ |
| Detailed Overview of S&P 100 Stocks |
| S&P 100 Technical Overview, Leaders & Laggards, Top S&P 100 ETF Funds & Detailed S&P 100 Stocks List, Charts, Trends & More |
| S&P 100: Technical Analysis, Trends & YTD Performance | |
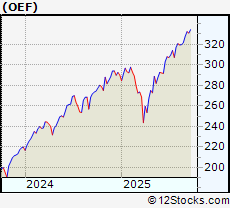
| S&P 100 index as represented by
OEF, an exchange-traded fund [ETF], holds basket of one hundred US (mostly largecap) stocks from across all major sectors of the US stock market. The S&P 100 index (contains stocks like Apple and Exxon) is up by 16.5396% and is currently outperforming the overall market by 1.7817% year-to-date. Below is a quick view of technical charts and trends: | |
 OEF Weekly Chart |
|
| Long Term Trend: Very Good | |
| Medium Term Trend: Good | |
 OEF Daily Chart |
|
| Short Term Trend: Very Good | |
| Overall Trend Score: 90 | |
| YTD Performance: 16.5396% | |
| **Trend Scores & Views Are Only For Educational Purposes And Not For Investing | |
| 12Stocks.com: Investing in S&P 100 Index using Exchange Traded Funds | |
|
The following table shows list of key exchange traded funds (ETF) that
help investors track S&P 100 index. We have also included ETF funds that track S&P 500 index since it is market-cap weighted. The following list also includes leveraged ETF funds that track twice or thrice the daily returns of S&P 100 indices. Short or inverse ETF funds move in the opposite direction to the index they track and are useful during market pullbacks or during bear markets. Quick View: Move mouse or cursor over ETF symbol (ticker) to view short-term technical chart and over ETF name to view long term chart. Click on ticker or stock name for detailed view. Click on to add stock symbol to your watchlist and to view watchlist. |
12Stocks.com List of ETFs that track S&P 100 Index
| Ticker | ETF Name | Watchlist | Recent Price | Smart Investing & Trading Score | Change % | Week % | Year-to-date % |
| SPY | SPDR S&P 500 ETF Trust | | 669.22 | 90 | 0.115192 | 1.22826 | 15.1527% |
| SPXU | ProShares UltraPro Short S&P 500 | | 13.34 | 10 | -0.224383 | -3.26323 | -40.0301% |
| SDS | ProShares UltraShort S&P500 -2x Shares | | 14.33 | 10 | -0.139373 | -2.1843 | -25.9516% |
| SH | ProShares Short S&P500 -1x Shares | | 36.80 | 10 | -0.0543183 | -1.07527 | -11.8852% |
| VOO | Vanguard S&P 500 ETF | | 615.25 | 90 | 0.107389 | 0.943396 | 15.2251% |
| UPRO | ProShares UltraPro S&P 500 ETF 3x Shares | | 113.01 | 90 | 0.275067 | 3.45112 | 29.2069% |
| SPXS | Direxion Daily S&P 500 Bear -3X Shares | | 37.50 | 70 | -0.239425 | 868.992 | 503.962% |
| SPXL | Direxion Daily S&P 500 Bull 3X Shares | | 214.76 | 90 | 0.28953 | 3.47386 | 29.2396% |
| SSO | ProShares Ultra S&P500 2x Shares | | 113.12 | 90 | 0.177117 | 2.334 | 23.4297% |
| OEF | iShares S&P 100 ETF | | 334.28 | 90 | 0.00598337 | 1.05505 | 16.5396% |
| 12Stocks.com: Charts, Trends, Fundamental Data and Performances of S&P 100 Stocks | |
|
We now take in-depth look at all S&P 100 stocks including charts, multi-period performances and overall trends (as measured by Smart Investing & Trading Score). One can sort S&P 100 stocks (click link to choose) by Daily, Weekly and by Year-to-Date performances. Also, one can sort by size of the company or by market capitalization. |
| Select Your Default Chart Type: | |||||
| |||||
| Click on stock symbol or name for detailed view. Click on to add stock symbol to your watchlist and to view watchlist. Quick View: Move mouse or cursor over "Daily" to quickly view daily technical stock chart and over "Weekly" to view weekly technical stock chart. | |||||

 | LOW Lowe's Cos., Inc |
| Sector: Services & Goods | |
| SubSector: Home Improvement Retail | |
| MarketCap: 151406 Millions | |
| Recent Price: 247.33 Smart Investing & Trading Score: 30 | |
| Day Percent Change: -0.26614% Day Change: 0.05 | |
| Week Change: -3.88606% Year-to-date Change: 1.6% | |
| LOW Links: Profile News Message Board | |
| Charts:- Daily , Weekly | |
| Add LOW to Watchlist: View: Get Complete LOW Trend Analysis ➞ | |
 | ABT Abbott Laboratories |
| Sector: Health Care | |
| SubSector: Medical Devices | |
| MarketCap: 231377 Millions | |
| Recent Price: 132.99 Smart Investing & Trading Score: 20 | |
| Day Percent Change: -0.359631% Day Change: -0.27 | |
| Week Change: -0.672194% Year-to-date Change: 18.9% | |
| ABT Links: Profile News Message Board | |
| Charts:- Daily , Weekly | |
| Add ABT to Watchlist: View: Get Complete ABT Trend Analysis ➞ | |
 | AMGN AMGEN Inc |
| Sector: Health Care | |
| SubSector: Drug Manufacturers - General | |
| MarketCap: 152701 Millions | |
| Recent Price: 297.40 Smart Investing & Trading Score: 100 | |
| Day Percent Change: -0.368509% Day Change: -2.21 | |
| Week Change: 6.51099% Year-to-date Change: 16.7% | |
| AMGN Links: Profile News Message Board | |
| Charts:- Daily , Weekly | |
| Add AMGN to Watchlist: View: Get Complete AMGN Trend Analysis ➞ | |
 | WMT Walmart Inc |
| Sector: Consumer Staples | |
| SubSector: Discount Stores | |
| MarketCap: 801351 Millions | |
| Recent Price: 101.57 Smart Investing & Trading Score: 20 | |
| Day Percent Change: -0.382503% Day Change: 0.05 | |
| Week Change: -1.12917% Year-to-date Change: 13.4% | |
| WMT Links: Profile News Message Board | |
| Charts:- Daily , Weekly | |
| Add WMT to Watchlist: View: Get Complete WMT Trend Analysis ➞ | |
 | BAC Bank Of America Corp |
| Sector: Financials | |
| SubSector: Banks - Diversified | |
| MarketCap: 368644 Millions | |
| Recent Price: 50.48 Smart Investing & Trading Score: 20 | |
| Day Percent Change: -0.394633% Day Change: -0.14 | |
| Week Change: -2.35977% Year-to-date Change: 15.4% | |
| BAC Links: Profile News Message Board | |
| Charts:- Daily , Weekly | |
| Add BAC to Watchlist: View: Get Complete BAC Trend Analysis ➞ | |
 | SPG Simon Property Group, Inc |
| Sector: Financials | |
| SubSector: REIT - Retail | |
| MarketCap: 68746 Millions | |
| Recent Price: 185.01 Smart Investing & Trading Score: 50 | |
| Day Percent Change: -0.403747% Day Change: -0.74 | |
| Week Change: 1.02659% Year-to-date Change: 9.4% | |
| SPG Links: Profile News Message Board | |
| Charts:- Daily , Weekly | |
| Add SPG to Watchlist: View: Get Complete SPG Trend Analysis ➞ | |
 | F Ford Motor Co |
| Sector: Services & Goods | |
| SubSector: Auto Manufacturers | |
| MarketCap: 46723.6 Millions | |
| Recent Price: 12.22 Smart Investing & Trading Score: 100 | |
| Day Percent Change: -0.407498% Day Change: -0.08 | |
| Week Change: 5.07309% Year-to-date Change: 34.5% | |
| F Links: Profile News Message Board | |
| Charts:- Daily , Weekly | |
| Add F to Watchlist: View: Get Complete F Trend Analysis ➞ | |
 | BK Bank Of New York Mellon Corp |
| Sector: Financials | |
| SubSector: Banks - Diversified | |
| MarketCap: 73126.4 Millions | |
| Recent Price: 106.38 Smart Investing & Trading Score: 20 | |
| Day Percent Change: -0.42123% Day Change: -0.23 | |
| Week Change: -1.60022% Year-to-date Change: 39.8% | |
| BK Links: Profile News Message Board | |
| Charts:- Daily , Weekly | |
| Add BK to Watchlist: View: Get Complete BK Trend Analysis ➞ | |
 | WFC Wells Fargo & Co |
| Sector: Financials | |
| SubSector: Banks - Diversified | |
| MarketCap: 252944 Millions | |
| Recent Price: 80.50 Smart Investing & Trading Score: 20 | |
| Day Percent Change: -0.457524% Day Change: -0.23 | |
| Week Change: -4.292% Year-to-date Change: 16.6% | |
| WFC Links: Profile News Message Board | |
| Charts:- Daily , Weekly | |
| Add WFC to Watchlist: View: Get Complete WFC Trend Analysis ➞ | |
 | PFE Pfizer Inc |
| Sector: Health Care | |
| SubSector: Drug Manufacturers - General | |
| MarketCap: 141456 Millions | |
| Recent Price: 27.08 Smart Investing & Trading Score: 100 | |
| Day Percent Change: -0.477766% Day Change: -0.18 | |
| Week Change: 12.4118% Year-to-date Change: 7.2% | |
| PFE Links: Profile News Message Board | |
| Charts:- Daily , Weekly | |
| Add PFE to Watchlist: View: Get Complete PFE Trend Analysis ➞ | |
 | GE GE Aerospace |
| Sector: Industrials | |
| SubSector: Aerospace & Defense | |
| MarketCap: 296106 Millions | |
| Recent Price: 299.45 Smart Investing & Trading Score: 70 | |
| Day Percent Change: -0.475273% Day Change: -1.7 | |
| Week Change: -0.28305% Year-to-date Change: 78.2% | |
| GE Links: Profile News Message Board | |
| Charts:- Daily , Weekly | |
| Add GE to Watchlist: View: Get Complete GE Trend Analysis ➞ | |
 | HD Home Depot, Inc |
| Sector: Services & Goods | |
| SubSector: Home Improvement Retail | |
| MarketCap: 417017 Millions | |
| Recent Price: 395.01 Smart Investing & Trading Score: 10 | |
| Day Percent Change: -0.506272% Day Change: -0.97 | |
| Week Change: -3.60202% Year-to-date Change: 3.0% | |
| HD Links: Profile News Message Board | |
| Charts:- Daily , Weekly | |
| Add HD to Watchlist: View: Get Complete HD Trend Analysis ➞ | |
 | GILD Gilead Sciences, Inc |
| Sector: Health Care | |
| SubSector: Drug Manufacturers - General | |
| MarketCap: 142755 Millions | |
| Recent Price: 110.56 Smart Investing & Trading Score: 0 | |
| Day Percent Change: -0.530814% Day Change: -1.07 | |
| Week Change: -2.73599% Year-to-date Change: 22.0% | |
| GILD Links: Profile News Message Board | |
| Charts:- Daily , Weekly | |
| Add GILD to Watchlist: View: Get Complete GILD Trend Analysis ➞ | |
 | V Visa Inc |
| Sector: Financials | |
| SubSector: Credit Services | |
| MarketCap: 661248 Millions | |
| Recent Price: 345.95 Smart Investing & Trading Score: 80 | |
| Day Percent Change: -0.540494% Day Change: -1.25 | |
| Week Change: 2.14657% Year-to-date Change: 10.6% | |
| V Links: Profile News Message Board | |
| Charts:- Daily , Weekly | |
| Add V to Watchlist: View: Get Complete V Trend Analysis ➞ | |
 | PEP PepsiCo Inc |
| Sector: Consumer Staples | |
| SubSector: Beverages - Non-Alcoholic | |
| MarketCap: 200419 Millions | |
| Recent Price: 142.31 Smart Investing & Trading Score: 70 | |
| Day Percent Change: -0.579852% Day Change: -1.2 | |
| Week Change: 0.0984737% Year-to-date Change: -3.4% | |
| PEP Links: Profile News Message Board | |
| Charts:- Daily , Weekly | |
| Add PEP to Watchlist: View: Get Complete PEP Trend Analysis ➞ | |
 | NEE NextEra Energy Inc |
| Sector: Utilities | |
| SubSector: Utilities - Regulated Electric | |
| MarketCap: 147620 Millions | |
| Recent Price: 78.18 Smart Investing & Trading Score: 100 | |
| Day Percent Change: -0.622855% Day Change: -0.92 | |
| Week Change: 5.89191% Year-to-date Change: 11.0% | |
| NEE Links: Profile News Message Board | |
| Charts:- Daily , Weekly | |
| Add NEE to Watchlist: View: Get Complete NEE Trend Analysis ➞ | |
 | XOM Exxon Mobil Corp |
| Sector: Energy | |
| SubSector: Oil & Gas Integrated | |
| MarketCap: 465674 Millions | |
| Recent Price: 111.29 Smart Investing & Trading Score: 20 | |
| Day Percent Change: -0.625056% Day Change: -0.43 | |
| Week Change: -2.8544% Year-to-date Change: 5.6% | |
| XOM Links: Profile News Message Board | |
| Charts:- Daily , Weekly | |
| Add XOM to Watchlist: View: Get Complete XOM Trend Analysis ➞ | |
 | CSCO Cisco Systems, Inc |
| Sector: Technology | |
| SubSector: Communication Equipment | |
| MarketCap: 264469 Millions | |
| Recent Price: 68.31 Smart Investing & Trading Score: 70 | |
| Day Percent Change: -0.644364% Day Change: -0.08 | |
| Week Change: 1.46613% Year-to-date Change: 17.8% | |
| CSCO Links: Profile News Message Board | |
| Charts:- Daily , Weekly | |
| Add CSCO to Watchlist: View: Get Complete CSCO Trend Analysis ➞ | |
 | DUK Duke Energy Corp |
| Sector: Utilities | |
| SubSector: Utilities - Regulated Electric | |
| MarketCap: 93789.3 Millions | |
| Recent Price: 121.57 Smart Investing & Trading Score: 10 | |
| Day Percent Change: -0.669989% Day Change: -1.07 | |
| Week Change: -1.67422% Year-to-date Change: 14.8% | |
| DUK Links: Profile News Message Board | |
| Charts:- Daily , Weekly | |
| Add DUK to Watchlist: View: Get Complete DUK Trend Analysis ➞ | |
 | LLY Lilly(Eli) & Co |
| Sector: Health Care | |
| SubSector: Drug Manufacturers - General | |
| MarketCap: 688273 Millions | |
| Recent Price: 819.85 Smart Investing & Trading Score: 100 | |
| Day Percent Change: -0.674808% Day Change: -5.2 | |
| Week Change: 10.5143% Year-to-date Change: 5.8% | |
| LLY Links: Profile News Message Board | |
| Charts:- Daily , Weekly | |
| Add LLY to Watchlist: View: Get Complete LLY Trend Analysis ➞ | |
 | MRK Merck & Co Inc |
| Sector: Health Care | |
| SubSector: Drug Manufacturers - General | |
| MarketCap: 211587 Millions | |
| Recent Price: 89.51 Smart Investing & Trading Score: 100 | |
| Day Percent Change: -0.687895% Day Change: -1.1 | |
| Week Change: 12.3509% Year-to-date Change: -8.0% | |
| MRK Links: Profile News Message Board | |
| Charts:- Daily , Weekly | |
| Add MRK to Watchlist: View: Get Complete MRK Trend Analysis ➞ | |
 | DIS Walt Disney Co |
| Sector: Technology | |
| SubSector: Entertainment | |
| MarketCap: 211994 Millions | |
| Recent Price: 112.14 Smart Investing & Trading Score: 0 | |
| Day Percent Change: -0.717131% Day Change: -0.38 | |
| Week Change: -1.13727% Year-to-date Change: 1.6% | |
| DIS Links: Profile News Message Board | |
| Charts:- Daily , Weekly | |
| Add DIS to Watchlist: View: Get Complete DIS Trend Analysis ➞ | |
 | MET Metlife Inc |
| Sector: Financials | |
| SubSector: Insurance - Life | |
| MarketCap: 52876.2 Millions | |
| Recent Price: 81.33 Smart Investing & Trading Score: 50 | |
| Day Percent Change: -0.732332% Day Change: -0.25 | |
| Week Change: 0.855655% Year-to-date Change: 1.6% | |
| MET Links: Profile News Message Board | |
| Charts:- Daily , Weekly | |
| Add MET to Watchlist: View: Get Complete MET Trend Analysis ➞ | |
 | NFLX Netflix Inc |
| Sector: Technology | |
| SubSector: Entertainment | |
| MarketCap: 528532 Millions | |
| Recent Price: 1162.30 Smart Investing & Trading Score: 10 | |
| Day Percent Change: -0.734478% Day Change: -11.9 | |
| Week Change: -3.45945% Year-to-date Change: 31.1% | |
| NFLX Links: Profile News Message Board | |
| Charts:- Daily , Weekly | |
| Add NFLX to Watchlist: View: Get Complete NFLX Trend Analysis ➞ | |
 | PG Procter & Gamble Co |
| Sector: Consumer Staples | |
| SubSector: Household & Personal Products | |
| MarketCap: 374826 Millions | |
| Recent Price: 152.05 Smart Investing & Trading Score: 20 | |
| Day Percent Change: -0.737694% Day Change: -1.13 | |
| Week Change: -0.24275% Year-to-date Change: -6.6% | |
| PG Links: Profile News Message Board | |
| Charts:- Daily , Weekly | |
| Add PG to Watchlist: View: Get Complete PG Trend Analysis ➞ | |
| For tabular summary view of above stock list: Summary View ➞ 0 - 25 , 25 - 50 , 50 - 75 , 75 - 100 , 100 - 125 | ||
| Click To Change The Sort Order: By Market Cap or Company Size Performance: Year-to-date, Week and Day | |
| Select Chart Type: | ||
|
Best Stocks Today 12Stocks.com |
� 2025 12Stocks.com Terms & Conditions Privacy Contact Us
All Information Provided Only For Education And Not To Be Used For Investing or Trading. See Terms & Conditions


One More Thing ... Get Best Stocks Delivered Daily!
Never Ever Miss A Move With Our Top Ten Stocks Lists
Find Best Stocks In Any Market - Bull or Bear Market
Take A Peek At Our Top Ten Stocks Lists: Daily, Weekly, Year-to-Date & Top Trends
Find Best Stocks In Any Market - Bull or Bear Market
Take A Peek At Our Top Ten Stocks Lists: Daily, Weekly, Year-to-Date & Top Trends
S&P 100 Stocks With Best Up Trends [0-bearish to 100-bullish]: Intel Corp[100], Caterpillar [100], Unitedhealth [100], Fedex Corp[100], NVIDIA Corp[100], CVS Health[100], General Dynamics[100], Johnson & Johnson[100], AMGEN [100], Ford Motor[100], Pfizer [100]
Best S&P 100 Stocks Year-to-Date:
Intel Corp[84.4708%], CVS Health[81.156%], GE Aerospace[78.2112%], Oracle Corp[75.3817%], Broadcom [46.567%], Citi [42.1898%], Advanced Micro[40.703%], Bank Of[39.805%], Caterpillar [38.0414%], Goldman Sachs[36.9027%], NVIDIA Corp[36.6279%] Best S&P 100 Stocks This Week:
Intel Corp[19.4747%], Danaher Corp[13.1354%], Pfizer [12.4118%], Merck & Co[12.3509%], Thermo Fisher[12.1709%], Lilly(Eli) & Co[10.5143%], Abbvie [7.53216%], Business[7.17303%], NVIDIA Corp[6.76386%], AMGEN [6.51099%], NextEra Energy[5.89191%] Best S&P 100 Stocks Daily:
Intel Corp[3.78408%], Advanced Micro[3.48759%], PayPal [3.40534%], Dow [2.77657%], Starbucks Corp[2.76066%], Adobe [2.27802%], Deere & Co[2.23364%], Caterpillar [2.02779%], 3M Co[1.79487%], Blackrock [1.70629%], Unitedhealth [1.55613%]