
 Login Sign Up


| |||||
 |  | ||||

| 12Stocks.com Market Intelligence |
Best Nasdaq Stocks
|
On this page, you will find the most comprehensive analysis of Nasdaq 100 stocks and ETFs - from latest trends to performances to charts ➞. First, here are the year-to-date (YTD) performances of the most requested Nasdaq stocks at 12Stocks.com (click stock for review):
| Intel Corp 84% | ||
| Baidu 70% | ||
| NVIDIA Corp 37% | ||
| Netflix 31% | ||
| Google 30% | ||
| Microsoft 24% | ||
| Gilead 22% | ||
| Expedia 18% | ||
| AMGEN 17% | ||
| Tesla 15% | ||
| Qualcomm 11% | ||
| Apple 6% | ||
| Biogen 4% | ||
| Costco 1% | ||
| Amazon.com 1% | ||
| Starbucks Corp -5% | ||
| Comcast Corp -17% | ||
| Nasdaq 100 Stocks Lists: Performances & Trends, Nasdaq 100 Stock Charts
Sort Nasdaq 100 stocks: Daily, Weekly, Year-to-Date, Market Cap & Trends. |
| 12Stocks.com Nasdaq Stocks Performances & Trends Daily Report | |||||||||
|
| 
The overall Smart Investing & Trading Score is 100 (0-bearish to 100-bullish) which puts Nasdaq index in short term bullish trend. The Smart Investing & Trading Score from previous trading session is 90 and an improvement of trend continues. | ||||||||
Here are the Smart Investing & Trading Scores of the most requested Nasdaq 100 stocks at 12Stocks.com (click stock name for detailed review):
|


| 12Stocks.com: Top Performing Nasdaq 100 Index Stocks | ||||||||||||||||||||||||||||||||||||||||||||||||
 The top performing Nasdaq 100 Index stocks year to date are
Now, more recently, over last week, the top performing Nasdaq 100 Index stocks on the move are


|
||||||||||||||||||||||||||||||||||||||||||||||||
| 12Stocks.com: Investing in Nasdaq 100 Index with Stocks | |
|
The following table helps investors and traders sort through current performance and trends (as measured by Smart Investing & Trading Score) of various
stocks in the Nasdaq 100 Index. Quick View: Move mouse or cursor over stock symbol (ticker) to view short-term technical chart and over stock name to view long term chart. Click on  to add stock symbol to your watchlist and to add stock symbol to your watchlist and  to view watchlist. Click on any ticker or stock name for detailed market intelligence report for that stock. to view watchlist. Click on any ticker or stock name for detailed market intelligence report for that stock. |
12Stocks.com Performance of Stocks in Nasdaq 100 Index
| Ticker | Stock Name | Watchlist | Category | Recent Price | Smart Investing & Trading Score | Change % | Weekly Change% |
| ABNB | Airbnb |   | Services & Goods | 121.49 | 0 | -0.68% | -1.29% |
| WBD | Warner Bros. | | Technology | 19.23 | 20 | -0.62% | -1.44% |
| TSLA | Tesla | | Services & Goods | 435.91 | 60 | -5.13% | -1.55% |
| DXCM | Dexcom | | Health Care | 66.44 | 10 | 0.54% | -1.57% |
| ROP | Roper | | Technology | 497.40 | 40 | -0.11% | -1.64% |
| BKNG | Booking | | Services & Goods | 5430.36 | 30 | 1.49% | -1.72% |
| CPRT | Copart | | Industrials | 44.57 | 10 | -1.15% | -1.81% |
| INTU | Intuit | | Technology | 681.86 | 20 | 0.35% | -1.86% |
| KDP | Keurig Dr | | Consumer Staples | 25.74 | 20 | 0.55% | -1.94% |
| CTSH | Cognizant | | Technology | 67.00 | 20 | 0.71% | -1.99% |
| CCEP | Coca-Cola Europacific | | Consumer Staples | 87.84 | 0 | -2.42% | -2.14% |
| KHC | Kraft Heinz | | Consumer Staples | 26.07 | 50 | -0.80% | -2.51% |
| QCOM | Qualcomm | | Technology | 168.84 | 90 | 1.41% | -2.71% |
| CDNS | Cadence Design | | Technology | 347.24 | 30 | -1.34% | -2.72% |
| GILD | Gilead | | Health Care | 110.56 | 0 | -0.53% | -2.74% |
| ADI | Analog Devices | | Technology | 241.67 | 10 | 1.00% | -2.79% |
| BKR | Baker Hughes | | Energy | 48.40 | 50 | 0.08% | -2.95% |
| COST | Costco | | Consumer Staples | 916.77 | 30 | -0.06% | -3.02% |
| NFLX | Netflix | | Technology | 1162.30 | 10 | -0.73% | -3.46% |
| TMUS | T-Mobile US | | Technology | 230.14 | 0 | -1.34% | -3.46% |
| PAYX | Paychex | | Technology | 123.42 | 0 | -0.48% | -3.78% |
| CMCSA | Comcast Corp | | Technology | 30.40 | 0 | -1.75% | -3.83% |
| WDAY | Workday | | Technology | 232.10 | 40 | -0.05% | -3.90% |
| MDLZ | Mondelez | | Consumer Staples | 61.78 | 0 | -2.20% | -4.05% |
| ON | ON Semiconductor | | Technology | 48.74 | 20 | 0.81% | -4.32% |
| META | Meta Platforms | | Technology | 727.06 | 30 | 1.36% | -4.42% |
| SQQQ | UltraPro | | Financials | 14.84 | 10 | -1.13% | -4.44% |
| DLTR | Dollar Tree | | Consumer Staples | 90.24 | 0 | -0.09% | -5.90% |
| TEAM | Atlassian | | Technology | 151.03 | 0 | 0.98% | -7.81% |
| MELI | MercadoLibre | | Services & Goods | 2246.60 | 0 | 3.20% | -10.53% |
| For chart view version of above stock list: Chart View ➞ 0 - 30 , 30 - 60 , 60 - 90 , 90 - 120 | ||
 | Click To Change The Sort Order: By Market Cap or Company Size Performance: Year-to-date, Week and Day |  |
|
Get the most comprehensive stock market coverage daily at 12Stocks.com ➞ Best Stocks Today ➞ Best Stocks Weekly ➞ Best Stocks Year-to-Date ➞ Best Stocks Trends ➞  Best Stocks Today 12Stocks.com Best Dow Stocks ➞ Best S&P 500 Stocks ➞ Best Tech Stocks ➞ Best Biotech Stocks ➞ |
| Detailed Overview of Nasdaq 100 Stocks |
| Nasdaq 100 Technical Overview, Leaders & Laggards, Top Nasdaq 100 ETF Funds & Detailed Nasdaq 100 Stocks List, Charts, Trends & More |
| Nasdaq 100: Technical Analysis, Trends & YTD Performance | |
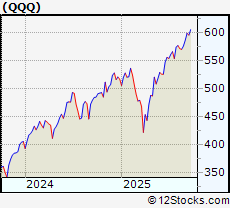
| Nasdaq 100 index as represented by
QQQ, an exchange-traded fund [ETF], holds basket of one hundred (mostly largecap) stocks from technology, biotech & retail sectors of the US stock market. The Nasdaq 100 index (contains stocks like Apple and Amgen) is up by 19.0275% and is currently outperforming the overall market by 4.2696% year-to-date. Below is a quick view of technical charts and trends: | |
 QQQ Weekly Chart |
|
| Long Term Trend: Very Good | |
| Medium Term Trend: Good | |
 QQQ Daily Chart |
|
| Short Term Trend: Very Good | |
| Overall Trend Score: 100 | |
| YTD Performance: 19.0275% | |
| **Trend Scores & Views Are Only For Educational Purposes And Not For Investing | |
| 12Stocks.com: Investing in Nasdaq 100 Index using Exchange Traded Funds | |
|
The following table shows list of key exchange traded funds (ETF) that
help investors track Nasdaq 100 index. The following list also includes leveraged ETF funds that track twice or thrice the daily returns of Nasdaq 100 indices. Short or inverse ETF funds move in the opposite direction to the index they track and are useful during market pullbacks or during bear markets. Quick View: Move mouse or cursor over ETF symbol (ticker) to view short-term technical chart and over ETF name to view long term chart. Click on ticker or stock name for detailed view. Click on to add stock symbol to your watchlist and to view watchlist. |
12Stocks.com List of ETFs that track Nasdaq 100 Index
| Ticker | ETF Name | Watchlist | Recent Price | Smart Investing & Trading Score | Change % | Week % | Year-to-date % |
| SQQQ | ProShares UltraPro Short QQQ -3x Shares | | 14.84 | 10 | -1.13324 | -4.44366 | -51.3663% |
| TQQQ | ProShares UltraPro QQQ 3x Shares | | 106.18 | 100 | 1.25977 | 4.70466 | 35.8162% |
| QQQ | Invesco QQQ Trust Series 1 | | 605.73 | 100 | 0.411106 | 1.6155 | 19.0275% |
| QID | ProShares UltraShort QQQ -2x Shares | | 21.16 | 0 | -0.797 | -2.93578 | -34.1753% |
| QYLD | Global X NASDAQ 100 Covered Call ETF | | 17.05 | 90 | 0.235156 | 0.887574 | 0.474973% |
| QLD | ProShares Ultra QQQ 2x Shares | | 139.64 | 100 | 0.808547 | 3.09339 | 29.7613% |
| QQQE | Direxion NASDAQ-100 Equal Weighted Index Shares | | 102.73 | 100 | 0.538266 | 1.83386 | 14.7481% |
| QQQX | Nuveen NASDAQ 100 Dynamic Overwrite Fund | | 27.58 | 80 | 0.436999 | 0.327392 | 7.36698% |
| QQEW | First Trust NASDAQ-100 Equal Weighted Index Fund | | 142.82 | 100 | 0.662532 | 1.99826 | 14.5428% |
| QTEC | First Trust NASDAQ-100 Technology Sector Index Fund | | 233.92 | 100 | 1.05845 | 2.93962 | 24.0218% |
| QQXT | First Trust Nasdaq-100 Ex-Technology Sector Index Fund | | 99.34 | 90 | 0.147085 | 0.955285 | 7.21494% |
| 12Stocks.com: Charts, Trends, Fundamental Data and Performances of Nasdaq 100 Stocks | |
|
We now take in-depth look at all Nasdaq 100 stocks including charts, multi-period performances and overall trends (as measured by Smart Investing & Trading Score). One can sort Nasdaq 100 stocks (click link to choose) by Daily, Weekly and by Year-to-Date performances. Also, one can sort by size of the company or by market capitalization. |
| Select Your Default Chart Type: | |||||
| |||||
| Click on stock symbol or name for detailed view. Click on to add stock symbol to your watchlist and to view watchlist. Quick View: Move mouse or cursor over "Daily" to quickly view daily technical stock chart and over "Weekly" to view weekly technical stock chart. | |||||

 | ABNB Airbnb Inc |
| Sector: Services & Goods | |
| SubSector: Travel Services | |
| MarketCap: 76940 Millions | |
| Recent Price: 121.49 Smart Investing & Trading Score: 0 | |
| Day Percent Change: -0.678548% Day Change: -1.02 | |
| Week Change: -1.29184% Year-to-date Change: -7.6% | |
| ABNB Links: Profile News Message Board | |
| Charts:- Daily , Weekly | |
| Add ABNB to Watchlist: View: Get Complete ABNB Trend Analysis ➞ | |
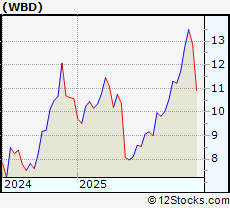 | WBD Warner Bros. Discovery Inc |
| Sector: Technology | |
| SubSector: Entertainment | |
| MarketCap: 29981.6 Millions | |
| Recent Price: 19.23 Smart Investing & Trading Score: 20 | |
| Day Percent Change: -0.62% Day Change: -0.12 | |
| Week Change: -1.44% Year-to-date Change: 84.2% | |
| WBD Links: Profile News Message Board | |
| Charts:- Daily , Weekly | |
| Add WBD to Watchlist: View: Get Complete WBD Trend Analysis ➞ | |
 | TSLA Tesla Inc |
| Sector: Services & Goods | |
| SubSector: Auto Manufacturers | |
| MarketCap: 1131620 Millions | |
| Recent Price: 435.91 Smart Investing & Trading Score: 60 | |
| Day Percent Change: -5.12558% Day Change: -18.23 | |
| Week Change: -1.55378% Year-to-date Change: 14.9% | |
| TSLA Links: Profile News Message Board | |
| Charts:- Daily , Weekly | |
| Add TSLA to Watchlist: View: Get Complete TSLA Trend Analysis ➞ | |
 | DXCM Dexcom Inc |
| Sector: Health Care | |
| SubSector: Medical Devices | |
| MarketCap: 31572.4 Millions | |
| Recent Price: 66.44 Smart Investing & Trading Score: 10 | |
| Day Percent Change: 0.544794% Day Change: -0.51 | |
| Week Change: -1.57037% Year-to-date Change: -15.4% | |
| DXCM Links: Profile News Message Board | |
| Charts:- Daily , Weekly | |
| Add DXCM to Watchlist: View: Get Complete DXCM Trend Analysis ➞ | |
 | ROP Roper Technologies Inc |
| Sector: Technology | |
| SubSector: Software - Application | |
| MarketCap: 55791.3 Millions | |
| Recent Price: 497.40 Smart Investing & Trading Score: 40 | |
| Day Percent Change: -0.114465% Day Change: -0.73 | |
| Week Change: -1.6374% Year-to-date Change: -2.8% | |
| ROP Links: Profile News Message Board | |
| Charts:- Daily , Weekly | |
| Add ROP to Watchlist: View: Get Complete ROP Trend Analysis ➞ | |
 | BKNG Booking Holdings Inc |
| Sector: Services & Goods | |
| SubSector: Travel Services | |
| MarketCap: 178442 Millions | |
| Recent Price: 5430.36 Smart Investing & Trading Score: 30 | |
| Day Percent Change: 1.49143% Day Change: 25.47 | |
| Week Change: -1.72361% Year-to-date Change: 10.7% | |
| BKNG Links: Profile News Message Board | |
| Charts:- Daily , Weekly | |
| Add BKNG to Watchlist: View: Get Complete BKNG Trend Analysis ➞ | |
 | CPRT Copart, Inc |
| Sector: Industrials | |
| SubSector: Specialty Business Services | |
| MarketCap: 46964.1 Millions | |
| Recent Price: 44.57 Smart Investing & Trading Score: 10 | |
| Day Percent Change: -1.15325% Day Change: -0.62 | |
| Week Change: -1.80657% Year-to-date Change: -20.9% | |
| CPRT Links: Profile News Message Board | |
| Charts:- Daily , Weekly | |
| Add CPRT to Watchlist: View: Get Complete CPRT Trend Analysis ➞ | |
 | INTU Intuit Inc |
| Sector: Technology | |
| SubSector: Software - Application | |
| MarketCap: 187586 Millions | |
| Recent Price: 681.86 Smart Investing & Trading Score: 20 | |
| Day Percent Change: 0.347314% Day Change: -3.88 | |
| Week Change: -1.86099% Year-to-date Change: 10.0% | |
| INTU Links: Profile News Message Board | |
| Charts:- Daily , Weekly | |
| Add INTU to Watchlist: View: Get Complete INTU Trend Analysis ➞ | |
 | KDP Keurig Dr Pepper Inc |
| Sector: Consumer Staples | |
| SubSector: Beverages - Non-Alcoholic | |
| MarketCap: 38919.2 Millions | |
| Recent Price: 25.74 Smart Investing & Trading Score: 20 | |
| Day Percent Change: 0.546875% Day Change: -0.05 | |
| Week Change: -1.94286% Year-to-date Change: -17.2% | |
| KDP Links: Profile News Message Board | |
| Charts:- Daily , Weekly | |
| Add KDP to Watchlist: View: Get Complete KDP Trend Analysis ➞ | |
 | CTSH Cognizant Technology Solutions Corp |
| Sector: Technology | |
| SubSector: Information Technology Services | |
| MarketCap: 35076.6 Millions | |
| Recent Price: 67.00 Smart Investing & Trading Score: 20 | |
| Day Percent Change: 0.706448% Day Change: 0.33 | |
| Week Change: -1.98947% Year-to-date Change: -11.7% | |
| CTSH Links: Profile News Message Board | |
| Charts:- Daily , Weekly | |
| Add CTSH to Watchlist: View: Get Complete CTSH Trend Analysis ➞ | |
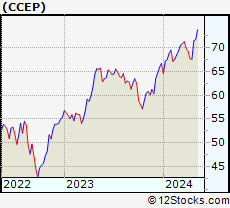 | CCEP Coca-Cola Europacific Partners Plc |
| Sector: Consumer Staples | |
| SubSector: Beverages - Non-Alcoholic | |
| MarketCap: 40954.2 Millions | |
| Recent Price: 87.84 Smart Investing & Trading Score: 0 | |
| Day Percent Change: -2.42168% Day Change: -2.24 | |
| Week Change: -2.13904% Year-to-date Change: 15.9% | |
| CCEP Links: Profile News Message Board | |
| Charts:- Daily , Weekly | |
| Add CCEP to Watchlist: View: Get Complete CCEP Trend Analysis ➞ | |
 | KHC Kraft Heinz Co |
| Sector: Consumer Staples | |
| SubSector: Packaged Foods | |
| MarketCap: 32300.4 Millions | |
| Recent Price: 26.07 Smart Investing & Trading Score: 50 | |
| Day Percent Change: -0.799087% Day Change: -0.27 | |
| Week Change: -2.50561% Year-to-date Change: -12.9% | |
| KHC Links: Profile News Message Board | |
| Charts:- Daily , Weekly | |
| Add KHC to Watchlist: View: Get Complete KHC Trend Analysis ➞ | |
 | QCOM Qualcomm, Inc |
| Sector: Technology | |
| SubSector: Semiconductors | |
| MarketCap: 172467 Millions | |
| Recent Price: 168.84 Smart Investing & Trading Score: 90 | |
| Day Percent Change: 1.4145% Day Change: 2.39 | |
| Week Change: -2.71103% Year-to-date Change: 11.2% | |
| QCOM Links: Profile News Message Board | |
| Charts:- Daily , Weekly | |
| Add QCOM to Watchlist: View: Get Complete QCOM Trend Analysis ➞ | |
 | CDNS Cadence Design Systems, Inc |
| Sector: Technology | |
| SubSector: Software - Application | |
| MarketCap: 95646.7 Millions | |
| Recent Price: 347.24 Smart Investing & Trading Score: 30 | |
| Day Percent Change: -1.34386% Day Change: -2.11 | |
| Week Change: -2.72299% Year-to-date Change: 16.7% | |
| CDNS Links: Profile News Message Board | |
| Charts:- Daily , Weekly | |
| Add CDNS to Watchlist: View: Get Complete CDNS Trend Analysis ➞ | |
 | GILD Gilead Sciences, Inc |
| Sector: Health Care | |
| SubSector: Drug Manufacturers - General | |
| MarketCap: 142755 Millions | |
| Recent Price: 110.56 Smart Investing & Trading Score: 0 | |
| Day Percent Change: -0.530814% Day Change: -1.07 | |
| Week Change: -2.73599% Year-to-date Change: 22.0% | |
| GILD Links: Profile News Message Board | |
| Charts:- Daily , Weekly | |
| Add GILD to Watchlist: View: Get Complete GILD Trend Analysis ➞ | |
 | ADI Analog Devices Inc |
| Sector: Technology | |
| SubSector: Semiconductors | |
| MarketCap: 121547 Millions | |
| Recent Price: 241.67 Smart Investing & Trading Score: 10 | |
| Day Percent Change: 0.99883% Day Change: 3.56 | |
| Week Change: -2.79152% Year-to-date Change: 15.4% | |
| ADI Links: Profile News Message Board | |
| Charts:- Daily , Weekly | |
| Add ADI to Watchlist: View: Get Complete ADI Trend Analysis ➞ | |
 | BKR Baker Hughes Co |
| Sector: Energy | |
| SubSector: Oil & Gas Equipment & Services | |
| MarketCap: 44936.4 Millions | |
| Recent Price: 48.40 Smart Investing & Trading Score: 50 | |
| Day Percent Change: 0.082713% Day Change: 0.08 | |
| Week Change: -2.94766% Year-to-date Change: 18.4% | |
| BKR Links: Profile News Message Board | |
| Charts:- Daily , Weekly | |
| Add BKR to Watchlist: View: Get Complete BKR Trend Analysis ➞ | |
 | COST Costco Wholesale Corp |
| Sector: Consumer Staples | |
| SubSector: Discount Stores | |
| MarketCap: 427281 Millions | |
| Recent Price: 916.77 Smart Investing & Trading Score: 30 | |
| Day Percent Change: -0.0621362% Day Change: 0.44 | |
| Week Change: -3.01501% Year-to-date Change: 1.1% | |
| COST Links: Profile News Message Board | |
| Charts:- Daily , Weekly | |
| Add COST to Watchlist: View: Get Complete COST Trend Analysis ➞ | |
 | NFLX Netflix Inc |
| Sector: Technology | |
| SubSector: Entertainment | |
| MarketCap: 528532 Millions | |
| Recent Price: 1162.30 Smart Investing & Trading Score: 10 | |
| Day Percent Change: -0.734478% Day Change: -11.9 | |
| Week Change: -3.45945% Year-to-date Change: 31.1% | |
| NFLX Links: Profile News Message Board | |
| Charts:- Daily , Weekly | |
| Add NFLX to Watchlist: View: Get Complete NFLX Trend Analysis ➞ | |
 | TMUS T-Mobile US Inc |
| Sector: Technology | |
| SubSector: Telecom Services | |
| MarketCap: 284461 Millions | |
| Recent Price: 230.14 Smart Investing & Trading Score: 0 | |
| Day Percent Change: -1.33756% Day Change: -2.58 | |
| Week Change: -3.46477% Year-to-date Change: 5.6% | |
| TMUS Links: Profile News Message Board | |
| Charts:- Daily , Weekly | |
| Add TMUS to Watchlist: View: Get Complete TMUS Trend Analysis ➞ | |
 | PAYX Paychex Inc |
| Sector: Technology | |
| SubSector: Software - Application | |
| MarketCap: 48791.4 Millions | |
| Recent Price: 123.42 Smart Investing & Trading Score: 0 | |
| Day Percent Change: -0.475768% Day Change: -0.7 | |
| Week Change: -3.78109% Year-to-date Change: -9.0% | |
| PAYX Links: Profile News Message Board | |
| Charts:- Daily , Weekly | |
| Add PAYX to Watchlist: View: Get Complete PAYX Trend Analysis ➞ | |
 | CMCSA Comcast Corp |
| Sector: Technology | |
| SubSector: Telecom Services | |
| MarketCap: 125203 Millions | |
| Recent Price: 30.40 Smart Investing & Trading Score: 0 | |
| Day Percent Change: -1.74531% Day Change: -0.22 | |
| Week Change: -3.8279% Year-to-date Change: -16.6% | |
| CMCSA Links: Profile News Message Board | |
| Charts:- Daily , Weekly | |
| Add CMCSA to Watchlist: View: Get Complete CMCSA Trend Analysis ➞ | |
 | WDAY Workday Inc |
| Sector: Technology | |
| SubSector: Software - Application | |
| MarketCap: 61698.4 Millions | |
| Recent Price: 232.10 Smart Investing & Trading Score: 40 | |
| Day Percent Change: -0.0473709% Day Change: 0.81 | |
| Week Change: -3.89632% Year-to-date Change: -7.8% | |
| WDAY Links: Profile News Message Board | |
| Charts:- Daily , Weekly | |
| Add WDAY to Watchlist: View: Get Complete WDAY Trend Analysis ➞ | |
 | MDLZ Mondelez International Inc |
| Sector: Consumer Staples | |
| SubSector: Confectioners | |
| MarketCap: 79888.2 Millions | |
| Recent Price: 61.78 Smart Investing & Trading Score: 0 | |
| Day Percent Change: -2.20041% Day Change: -1.1 | |
| Week Change: -4.05342% Year-to-date Change: 5.3% | |
| MDLZ Links: Profile News Message Board | |
| Charts:- Daily , Weekly | |
| Add MDLZ to Watchlist: View: Get Complete MDLZ Trend Analysis ➞ | |
 | ON ON Semiconductor Corp |
| Sector: Technology | |
| SubSector: Semiconductors | |
| MarketCap: 20082.7 Millions | |
| Recent Price: 48.74 Smart Investing & Trading Score: 20 | |
| Day Percent Change: 0.806618% Day Change: 0.22 | |
| Week Change: -4.31881% Year-to-date Change: -21.0% | |
| ON Links: Profile News Message Board | |
| Charts:- Daily , Weekly | |
| Add ON to Watchlist: View: Get Complete ON Trend Analysis ➞ | |
 | META Meta Platforms Inc |
| Sector: Technology | |
| SubSector: Internet Content & Information | |
| MarketCap: 1890130 Millions | |
| Recent Price: 727.06 Smart Investing & Trading Score: 30 | |
| Day Percent Change: 1.35501% Day Change: 9.27 | |
| Week Change: -4.41722% Year-to-date Change: 21.5% | |
| META Links: Profile News Message Board | |
| Charts:- Daily , Weekly | |
| Add META to Watchlist: View: Get Complete META Trend Analysis ➞ | |
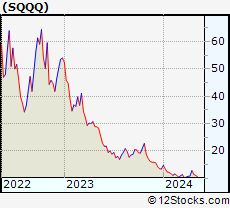 | SQQQ ProShares UltraPro Short QQQ -3x Shares |
| Sector: Financials | |
| SubSector: Exchange Traded Fund | |
| MarketCap: Millions | |
| Recent Price: 14.84 Smart Investing & Trading Score: 10 | |
| Day Percent Change: -1.13324% Day Change: -0.16 | |
| Week Change: -4.44366% Year-to-date Change: -51.4% | |
| SQQQ Links: Profile News Message Board | |
| Charts:- Daily , Weekly | |
| Add SQQQ to Watchlist: View: Get Complete SQQQ Trend Analysis ➞ | |
 | DLTR Dollar Tree Inc |
| Sector: Consumer Staples | |
| SubSector: Discount Stores | |
| MarketCap: 20625.2 Millions | |
| Recent Price: 90.24 Smart Investing & Trading Score: 0 | |
| Day Percent Change: -0.088574% Day Change: -0.21 | |
| Week Change: -5.90198% Year-to-date Change: 18.0% | |
| DLTR Links: Profile News Message Board | |
| Charts:- Daily , Weekly | |
| Add DLTR to Watchlist: View: Get Complete DLTR Trend Analysis ➞ | |
 | TEAM Atlassian Corporation |
| Sector: Technology | |
| SubSector: Software - Application | |
| MarketCap: 45234.3 Millions | |
| Recent Price: 151.03 Smart Investing & Trading Score: 0 | |
| Day Percent Change: 0.976132% Day Change: 1.25 | |
| Week Change: -7.81298% Year-to-date Change: -37.7% | |
| TEAM Links: Profile News Message Board | |
| Charts:- Daily , Weekly | |
| Add TEAM to Watchlist: View: Get Complete TEAM Trend Analysis ➞ | |
 | MELI MercadoLibre Inc |
| Sector: Services & Goods | |
| SubSector: Internet Retail | |
| MarketCap: 122560 Millions | |
| Recent Price: 2246.60 Smart Investing & Trading Score: 0 | |
| Day Percent Change: 3.20133% Day Change: 62.28 | |
| Week Change: -10.5286% Year-to-date Change: 27.3% | |
| MELI Links: Profile News Message Board | |
| Charts:- Daily , Weekly | |
| Add MELI to Watchlist: View: Get Complete MELI Trend Analysis ➞ | |
| For tabular summary view of above stock list: Summary View ➞ 0 - 30 , 30 - 60 , 60 - 90 , 90 - 120 | ||
| Click To Change The Sort Order: By Market Cap or Company Size Performance: Year-to-date, Week and Day | |
| Select Chart Type: | ||
|
Best Stocks Today 12Stocks.com |
© 2025 12Stocks.com Terms & Conditions Privacy Contact Us
All Information Provided Only For Education And Not To Be Used For Investing or Trading. See Terms & Conditions


One More Thing ... Get Best Stocks Delivered Daily!
Never Ever Miss A Move With Our Top Ten Stocks Lists
Find Best Stocks In Any Market - Bull or Bear Market
Take A Peek At Our Top Ten Stocks Lists: Daily, Weekly, Year-to-Date & Top Trends
Find Best Stocks In Any Market - Bull or Bear Market
Take A Peek At Our Top Ten Stocks Lists: Daily, Weekly, Year-to-Date & Top Trends
Nasdaq 100 Stocks With Best Up Trends [0-bearish to 100-bullish]: Intel Corp[100], Lam Research[100], Applied Materials[100], ASML Holding[100], Ross Stores[100], Constellation Energy[100], UltraPro[100], Palo Alto[100], KLA Corp[100], NVIDIA Corp[100], Micron [100]
Best Nasdaq 100 Stocks Year-to-Date:
Micron [110.87%], Lam Research[103.976%], Intel Corp[84.4708%], Warner Bros.[84.2%], KLA Corp[79.7904%], Zscaler [69.3163%], DoorDash [58.3182%], Idexx [55.03%], ASML Holding[48.1837%], Constellation Energy[47.8225%], Broadcom [46.567%] Best Nasdaq 100 Stocks This Week:
Electronic Arts[20.1076%], Intel Corp[19.4747%], Lam Research[14.5184%], Micron [13.6232%], Biogen [12.7697%], Astrazeneca [11.0138%], Applied Materials[11.0008%], Datadog [10.9834%], Moderna [9.62133%], ASML Holding[8.78936%], Trade Desk[8.57691%] Best Nasdaq 100 Stocks Daily:
Intel Corp[3.78408%], Advanced Micro[3.48759%], PayPal [3.40534%], MercadoLibre [3.20133%], Trade Desk[3.18329%], Microchip [3.15083%], Lam Research[2.91337%], Moderna [2.78986%], Marvell [2.76553%], Starbucks Corp[2.76066%], Applied Materials[2.69128%]