
 Login Sign Up


| |||||
 |  | ||||

| 12Stocks.com Market Intelligence |
Best Nasdaq Stocks
|
On this page, you will find the most comprehensive analysis of Nasdaq 100 stocks and ETFs - from latest trends to performances to charts ➞. First, here are the year-to-date (YTD) performances of the most requested Nasdaq stocks at 12Stocks.com (click stock for review):
| Intel Corp 94% | ||
| Baidu 58% | ||
| NVIDIA Corp 58% | ||
| Expedia 27% | ||
| Microsoft 25% | ||
| Google 19% | ||
| Netflix 18% | ||
| Gilead 15% | ||
| Biogen 10% | ||
| Apple 10% | ||
| Tesla 9% | ||
| AMGEN 6% | ||
| Qualcomm -0% | ||
| Costco -6% | ||
| Amazon.com -6% | ||
| Comcast Corp -7% | ||
| Starbucks Corp -19% | ||
| Nasdaq 100 Stocks Lists: Performances & Trends, Nasdaq 100 Stock Charts
Sort Nasdaq 100 stocks: Daily, Weekly, Year-to-Date, Market Cap & Trends. |
| 12Stocks.com Nasdaq Stocks Performances & Trends Daily Report | |||||||||
|
| 
The overall Smart Investing & Trading Score is 100 (0-bearish to 100-bullish) which puts Nasdaq index in short term bullish trend. The Smart Investing & Trading Score from previous trading session is 90 and an improvement of trend continues. | ||||||||
Here are the Smart Investing & Trading Scores of the most requested Nasdaq 100 stocks at 12Stocks.com (click stock name for detailed review):
|


| 12Stocks.com: Top Performing Nasdaq 100 Index Stocks | ||||||||||||||||||||||||||||||||||||||||||||||||
 The top performing Nasdaq 100 Index stocks year to date are
Now, more recently, over last week, the top performing Nasdaq 100 Index stocks on the move are


|
||||||||||||||||||||||||||||||||||||||||||||||||
| 12Stocks.com: Investing in Nasdaq 100 Index with Stocks | |
|
The following table helps investors and traders sort through current performance and trends (as measured by Smart Investing & Trading Score) of various
stocks in the Nasdaq 100 Index. Quick View: Move mouse or cursor over stock symbol (ticker) to view short-term technical chart and over stock name to view long term chart. Click on  to add stock symbol to your watchlist and to add stock symbol to your watchlist and  to view watchlist. Click on any ticker or stock name for detailed market intelligence report for that stock. to view watchlist. Click on any ticker or stock name for detailed market intelligence report for that stock. |
12Stocks.com Performance of Stocks in Nasdaq 100 Index
| Ticker | Stock Name | Watchlist | Category | Recent Price | Smart Investing & Trading Score | Change % | YTD Change% |
| DLTR | Dollar Tree |   | Consumer Staples | 90.25 | 0 | 0.01 | 23.04% |
| ANSS | ANSYS | | Technology | 374.30 | 50 | 0.00 | 11.38% |
| CPRT | Copart | | Industrials | 44.56 | 10 | -0.02 | -23.08% |
| MSFT | Microsoft | | Technology | 515.47 | 60 | -0.05 | 24.67% |
| WDAY | Workday | | Technology | 232.10 | 40 | -0.05 | -7.84% |
| COST | Costco | | Consumer Staples | 916.12 | 30 | -0.07 | -6.15% |
| ADSK | Autodesk | | Technology | 320.63 | 60 | -0.09 | 2.98% |
| CSCO | Cisco | | Technology | 68.25 | 70 | -0.09 | 14.06% |
| INTU | Intuit | | Technology | 681.18 | 20 | -0.10 | 13.60% |
| ROST | Ross Stores | | Services & Goods | 155.98 | 100 | -0.12 | 4.23% |
| CTSH | Cognizant | | Technology | 66.91 | 20 | -0.13 | -18.42% |
| CTAS | Cintas | | Industrials | 202.62 | 50 | -0.14 | 1.40% |
| PAYX | Paychex | | Technology | 123.24 | 0 | -0.15 | -14.75% |
| PCAR | Paccar | | Industrials | 98.91 | 50 | -0.17 | -10.21% |
| LRCX | Lam Research | | Technology | 146.73 | 100 | -0.18 | 82.03% |
| SBUX | Starbucks Corp | | Services & Goods | 86.55 | 80 | -0.20 | -18.62% |
| SIRI | Sirius XM | | Technology | 22.60 | 30 | -0.26 | 5.98% |
| TMUS | T-Mobile US | | Technology | 229.48 | 0 | -0.29 | -0.80% |
| ABNB | Airbnb | | Services & Goods | 121.12 | 0 | -0.30 | -7.66% |
| AMD | Advanced Micro | | Technology | 169.18 | 90 | -0.32 | 45.91% |
| MRNA | Moderna | | Health Care | 28.27 | 90 | -0.35 | -28.29% |
| GILD | Gilead | | Health Care | 110.14 | 0 | -0.38 | 14.92% |
| ADP | Automatic Data | | Technology | 288.78 | 0 | -0.38 | -3.71% |
| SQQQ | UltraPro | | Financials | 14.77 | 10 | -0.47 | -47.74% |
| SNPS | Synopsys | | Technology | 468.89 | 20 | -0.48 | -10.77% |
| VRSK | Verisk Analytics | | Industrials | 246.22 | 30 | -0.49 | -14.08% |
| CRWD | Crowdstrike | | Technology | 496.80 | 80 | -0.63 | 43.03% |
| NFLX | Netflix | | Technology | 1155.12 | 10 | -0.64 | 18.26% |
| DDOG | Datadog | | Technology | 151.57 | 100 | -0.74 | 5.53% |
| ADBE | Adobe | | Technology | 348.79 | 50 | -0.77 | -20.27% |
| For chart view version of above stock list: Chart View ➞ 0 - 30 , 30 - 60 , 60 - 90 , 90 - 120 | ||
 | Click To Change The Sort Order: By Market Cap or Company Size Performance: Year-to-date, Week and Day |  |
|
Get the most comprehensive stock market coverage daily at 12Stocks.com ➞ Best Stocks Today ➞ Best Stocks Weekly ➞ Best Stocks Year-to-Date ➞ Best Stocks Trends ➞  Best Stocks Today 12Stocks.com Best Dow Stocks ➞ Best S&P 500 Stocks ➞ Best Tech Stocks ➞ Best Biotech Stocks ➞ |
| Detailed Overview of Nasdaq 100 Stocks |
| Nasdaq 100 Technical Overview, Leaders & Laggards, Top Nasdaq 100 ETF Funds & Detailed Nasdaq 100 Stocks List, Charts, Trends & More |
| Nasdaq 100: Technical Analysis, Trends & YTD Performance | |
| Nasdaq 100 index as represented by
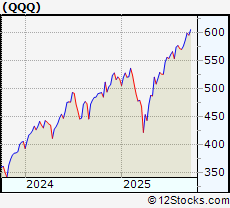
QQQ, an exchange-traded fund [ETF], holds basket of one hundred (mostly largecap) stocks from technology, biotech & retail sectors of the US stock market. The Nasdaq 100 index (contains stocks like Apple and Amgen) is up by 16.55% and is currently outperforming the overall market by 5.02% year-to-date. Below is a quick view of technical charts and trends: | |
 QQQ Weekly Chart |
|
| Long Term Trend: Very Good | |
| Medium Term Trend: Good | |
 QQQ Daily Chart |
|
| Short Term Trend: Very Good | |
| Overall Trend Score: 100 | |
| YTD Performance: 16.55% | |
| **Trend Scores & Views Are Only For Educational Purposes And Not For Investing | |
| 12Stocks.com: Investing in Nasdaq 100 Index using Exchange Traded Funds | |
|
The following table shows list of key exchange traded funds (ETF) that
help investors track Nasdaq 100 index. The following list also includes leveraged ETF funds that track twice or thrice the daily returns of Nasdaq 100 indices. Short or inverse ETF funds move in the opposite direction to the index they track and are useful during market pullbacks or during bear markets. Quick View: Move mouse or cursor over ETF symbol (ticker) to view short-term technical chart and over ETF name to view long term chart. Click on ticker or stock name for detailed view. Click on to add stock symbol to your watchlist and to view watchlist. |
12Stocks.com List of ETFs that track Nasdaq 100 Index
| Ticker | ETF Name | Watchlist | Recent Price | Smart Investing & Trading Score | Change % | Week % | Year-to-date % |
| QID | ProShares UltraShort QQQ -2x Shares | | 21.16 | 0 | -0.797 | -2.93578 | -34.1753% |
| SQQQ | ProShares UltraPro Short QQQ -3x Shares | | 14.77 | 10 | -0.47 | -5.02 | -47.74% |
| TQQQ | ProShares UltraPro QQQ 3x Shares | | 106.73 | 100 | 0.56 | 5.41 | 29.77% |
| QYLD | Global X NASDAQ 100 Covered Call ETF | | 17.05 | 90 | 0.235156 | 0.887574 | 0.474973% |
| QQQ | Invesco QQQ Trust Series 1 | | 607.12 | 100 | 0.23 | 1.87 | 16.55% |
| QLD | ProShares Ultra QQQ 2x Shares | | 139.64 | 100 | 0.808547 | 3.09339 | 29.7613% |
| QQQE | Direxion NASDAQ-100 Equal Weighted Index Shares | | 102.73 | 100 | 0.538266 | 1.83386 | 14.7481% |
| QQQX | Nuveen NASDAQ 100 Dynamic Overwrite Fund | | 27.58 | 80 | 0.436999 | 0.327392 | 7.36698% |
| QQEW | First Trust NASDAQ-100 Equal Weighted Index Fund | | 142.82 | 100 | 0.662532 | 1.99826 | 14.5428% |
| QTEC | First Trust NASDAQ-100 Technology Sector Index Fund | | 233.92 | 100 | 1.05845 | 2.93962 | 24.0218% |
| QQXT | First Trust Nasdaq-100 Ex-Technology Sector Index Fund | | 99.34 | 90 | 0.147085 | 0.955285 | 7.21494% |
| 12Stocks.com: Charts, Trends, Fundamental Data and Performances of Nasdaq 100 Stocks | |
|
We now take in-depth look at all Nasdaq 100 stocks including charts, multi-period performances and overall trends (as measured by Smart Investing & Trading Score). One can sort Nasdaq 100 stocks (click link to choose) by Daily, Weekly and by Year-to-Date performances. Also, one can sort by size of the company or by market capitalization. |
| Select Your Default Chart Type: | |||||
| |||||
| Click on stock symbol or name for detailed view. Click on to add stock symbol to your watchlist and to view watchlist. Quick View: Move mouse or cursor over "Daily" to quickly view daily technical stock chart and over "Weekly" to view weekly technical stock chart. | |||||

 | DLTR Dollar Tree Inc |
| Sector: Consumer Staples | |
| SubSector: Discount Stores | |
| MarketCap: 20625.2 Millions | |
| Recent Price: 90.25 Smart Investing & Trading Score: 0 | |
| Day Percent Change: 0.01% Day Change: 0.01 | |
| Week Change: -5.06% Year-to-date Change: 23.0% | |
| DLTR Links: Profile News Message Board | |
| Charts:- Daily , Weekly | |
| Add DLTR to Watchlist: View: Get Complete DLTR Trend Analysis ➞ | |
 | ANSS ANSYS, Inc. |
| Sector: Technology | |
| SubSector: Application Software | |
| MarketCap: 19497.4 Millions | |
| Recent Price: 374.30 Smart Investing & Trading Score: 50 | |
| Day Percent Change: 0% Day Change: -9999 | |
| Week Change: 2.02524% Year-to-date Change: 11.4% | |
| ANSS Links: Profile News Message Board | |
| Charts:- Daily , Weekly | |
| Add ANSS to Watchlist: View: Get Complete ANSS Trend Analysis ➞ | |
 | CPRT Copart, Inc |
| Sector: Industrials | |
| SubSector: Specialty Business Services | |
| MarketCap: 46964.1 Millions | |
| Recent Price: 44.56 Smart Investing & Trading Score: 10 | |
| Day Percent Change: -0.02% Day Change: -0.01 | |
| Week Change: -0.69% Year-to-date Change: -23.1% | |
| CPRT Links: Profile News Message Board | |
| Charts:- Daily , Weekly | |
| Add CPRT to Watchlist: View: Get Complete CPRT Trend Analysis ➞ | |
 | MSFT Microsoft Corporation |
| Sector: Technology | |
| SubSector: Software - Infrastructure | |
| MarketCap: 3679420 Millions | |
| Recent Price: 515.47 Smart Investing & Trading Score: 60 | |
| Day Percent Change: -0.05% Day Change: -0.27 | |
| Week Change: 0.78% Year-to-date Change: 24.7% | |
| MSFT Links: Profile News Message Board | |
| Charts:- Daily , Weekly | |
| Add MSFT to Watchlist: View: Get Complete MSFT Trend Analysis ➞ | |
 | WDAY Workday Inc |
| Sector: Technology | |
| SubSector: Software - Application | |
| MarketCap: 61698.4 Millions | |
| Recent Price: 232.10 Smart Investing & Trading Score: 40 | |
| Day Percent Change: -0.0473709% Day Change: 0.81 | |
| Week Change: -3.89632% Year-to-date Change: -7.8% | |
| WDAY Links: Profile News Message Board | |
| Charts:- Daily , Weekly | |
| Add WDAY to Watchlist: View: Get Complete WDAY Trend Analysis ➞ | |
 | COST Costco Wholesale Corp |
| Sector: Consumer Staples | |
| SubSector: Discount Stores | |
| MarketCap: 427281 Millions | |
| Recent Price: 916.12 Smart Investing & Trading Score: 30 | |
| Day Percent Change: -0.07% Day Change: -0.65 | |
| Week Change: 0.02% Year-to-date Change: -6.2% | |
| COST Links: Profile News Message Board | |
| Charts:- Daily , Weekly | |
| Add COST to Watchlist: View: Get Complete COST Trend Analysis ➞ | |
 | ADSK Autodesk Inc |
| Sector: Technology | |
| SubSector: Software - Application | |
| MarketCap: 69516.8 Millions | |
| Recent Price: 320.63 Smart Investing & Trading Score: 60 | |
| Day Percent Change: -0.09% Day Change: -0.28 | |
| Week Change: -0.7% Year-to-date Change: 3.0% | |
| ADSK Links: Profile News Message Board | |
| Charts:- Daily , Weekly | |
| Add ADSK to Watchlist: View: Get Complete ADSK Trend Analysis ➞ | |
 | CSCO Cisco Systems, Inc |
| Sector: Technology | |
| SubSector: Communication Equipment | |
| MarketCap: 264469 Millions | |
| Recent Price: 68.25 Smart Investing & Trading Score: 70 | |
| Day Percent Change: -0.09% Day Change: -0.06 | |
| Week Change: 1.53% Year-to-date Change: 14.1% | |
| CSCO Links: Profile News Message Board | |
| Charts:- Daily , Weekly | |
| Add CSCO to Watchlist: View: Get Complete CSCO Trend Analysis ➞ | |
 | INTU Intuit Inc |
| Sector: Technology | |
| SubSector: Software - Application | |
| MarketCap: 187586 Millions | |
| Recent Price: 681.18 Smart Investing & Trading Score: 20 | |
| Day Percent Change: -0.1% Day Change: -0.68 | |
| Week Change: -2.45% Year-to-date Change: 13.6% | |
| INTU Links: Profile News Message Board | |
| Charts:- Daily , Weekly | |
| Add INTU to Watchlist: View: Get Complete INTU Trend Analysis ➞ | |
 | ROST Ross Stores, Inc |
| Sector: Services & Goods | |
| SubSector: Apparel Retail | |
| MarketCap: 49371.3 Millions | |
| Recent Price: 155.98 Smart Investing & Trading Score: 100 | |
| Day Percent Change: -0.12% Day Change: -0.19 | |
| Week Change: 2.94% Year-to-date Change: 4.2% | |
| ROST Links: Profile News Message Board | |
| Charts:- Daily , Weekly | |
| Add ROST to Watchlist: View: Get Complete ROST Trend Analysis ➞ | |
 | CTSH Cognizant Technology Solutions Corp |
| Sector: Technology | |
| SubSector: Information Technology Services | |
| MarketCap: 35076.6 Millions | |
| Recent Price: 66.91 Smart Investing & Trading Score: 20 | |
| Day Percent Change: -0.13% Day Change: -0.09 | |
| Week Change: -0.1% Year-to-date Change: -18.4% | |
| CTSH Links: Profile News Message Board | |
| Charts:- Daily , Weekly | |
| Add CTSH to Watchlist: View: Get Complete CTSH Trend Analysis ➞ | |
 | CTAS Cintas Corporation |
| Sector: Industrials | |
| SubSector: Specialty Business Services | |
| MarketCap: 82409 Millions | |
| Recent Price: 202.62 Smart Investing & Trading Score: 50 | |
| Day Percent Change: -0.14% Day Change: -0.29 | |
| Week Change: -0.79% Year-to-date Change: 1.4% | |
| CTAS Links: Profile News Message Board | |
| Charts:- Daily , Weekly | |
| Add CTAS to Watchlist: View: Get Complete CTAS Trend Analysis ➞ | |
 | PAYX Paychex Inc |
| Sector: Technology | |
| SubSector: Software - Application | |
| MarketCap: 48791.4 Millions | |
| Recent Price: 123.24 Smart Investing & Trading Score: 0 | |
| Day Percent Change: -0.15% Day Change: -0.18 | |
| Week Change: -3.88% Year-to-date Change: -14.8% | |
| PAYX Links: Profile News Message Board | |
| Charts:- Daily , Weekly | |
| Add PAYX to Watchlist: View: Get Complete PAYX Trend Analysis ➞ | |
 | PCAR Paccar Inc |
| Sector: Industrials | |
| SubSector: Farm & Heavy Construction Machinery | |
| MarketCap: 52011.5 Millions | |
| Recent Price: 98.91 Smart Investing & Trading Score: 50 | |
| Day Percent Change: -0.17% Day Change: -0.17 | |
| Week Change: -1.58% Year-to-date Change: -10.2% | |
| PCAR Links: Profile News Message Board | |
| Charts:- Daily , Weekly | |
| Add PCAR to Watchlist: View: Get Complete PCAR Trend Analysis ➞ | |
 | LRCX Lam Research Corp |
| Sector: Technology | |
| SubSector: Semiconductor Equipment & Materials | |
| MarketCap: 130296 Millions | |
| Recent Price: 146.73 Smart Investing & Trading Score: 100 | |
| Day Percent Change: -0.18% Day Change: -0.26 | |
| Week Change: 14.34% Year-to-date Change: 82.0% | |
| LRCX Links: Profile News Message Board | |
| Charts:- Daily , Weekly | |
| Add LRCX to Watchlist: View: Get Complete LRCX Trend Analysis ➞ | |
 | SBUX Starbucks Corp |
| Sector: Services & Goods | |
| SubSector: Restaurants | |
| MarketCap: 97108.3 Millions | |
| Recent Price: 86.55 Smart Investing & Trading Score: 80 | |
| Day Percent Change: -0.2% Day Change: -0.17 | |
| Week Change: 3.79% Year-to-date Change: -18.6% | |
| SBUX Links: Profile News Message Board | |
| Charts:- Daily , Weekly | |
| Add SBUX to Watchlist: View: Get Complete SBUX Trend Analysis ➞ | |
 | SIRI Sirius XM Holdings Inc |
| Sector: Technology | |
| SubSector: Entertainment | |
| MarketCap: 8101.98 Millions | |
| Recent Price: 22.60 Smart Investing & Trading Score: 30 | |
| Day Percent Change: -0.264784% Day Change: 0.07 | |
| Week Change: 0.088574% Year-to-date Change: 6.0% | |
| SIRI Links: Profile News Message Board | |
| Charts:- Daily , Weekly | |
| Add SIRI to Watchlist: View: Get Complete SIRI Trend Analysis ➞ | |
 | TMUS T-Mobile US Inc |
| Sector: Technology | |
| SubSector: Telecom Services | |
| MarketCap: 284461 Millions | |
| Recent Price: 229.48 Smart Investing & Trading Score: 0 | |
| Day Percent Change: -0.29% Day Change: -0.66 | |
| Week Change: -3.36% Year-to-date Change: -0.8% | |
| TMUS Links: Profile News Message Board | |
| Charts:- Daily , Weekly | |
| Add TMUS to Watchlist: View: Get Complete TMUS Trend Analysis ➞ | |
 | ABNB Airbnb Inc |
| Sector: Services & Goods | |
| SubSector: Travel Services | |
| MarketCap: 76940 Millions | |
| Recent Price: 121.12 Smart Investing & Trading Score: 0 | |
| Day Percent Change: -0.3% Day Change: -0.37 | |
| Week Change: -2.09% Year-to-date Change: -7.7% | |
| ABNB Links: Profile News Message Board | |
| Charts:- Daily , Weekly | |
| Add ABNB to Watchlist: View: Get Complete ABNB Trend Analysis ➞ | |
 | AMD Advanced Micro Devices Inc |
| Sector: Technology | |
| SubSector: Semiconductors | |
| MarketCap: 245277 Millions | |
| Recent Price: 169.18 Smart Investing & Trading Score: 90 | |
| Day Percent Change: -0.32% Day Change: -0.55 | |
| Week Change: 6.1% Year-to-date Change: 45.9% | |
| AMD Links: Profile News Message Board | |
| Charts:- Daily , Weekly | |
| Add AMD to Watchlist: View: Get Complete AMD Trend Analysis ➞ | |
 | MRNA Moderna Inc |
| Sector: Health Care | |
| SubSector: Biotechnology | |
| MarketCap: 9781.46 Millions | |
| Recent Price: 28.27 Smart Investing & Trading Score: 90 | |
| Day Percent Change: -0.35% Day Change: -0.1 | |
| Week Change: 15.43% Year-to-date Change: -28.3% | |
| MRNA Links: Profile News Message Board | |
| Charts:- Daily , Weekly | |
| Add MRNA to Watchlist: View: Get Complete MRNA Trend Analysis ➞ | |
 | GILD Gilead Sciences, Inc |
| Sector: Health Care | |
| SubSector: Drug Manufacturers - General | |
| MarketCap: 142755 Millions | |
| Recent Price: 110.14 Smart Investing & Trading Score: 0 | |
| Day Percent Change: -0.38% Day Change: -0.42 | |
| Week Change: -1.75% Year-to-date Change: 14.9% | |
| GILD Links: Profile News Message Board | |
| Charts:- Daily , Weekly | |
| Add GILD to Watchlist: View: Get Complete GILD Trend Analysis ➞ | |
 | ADP Automatic Data Processing Inc |
| Sector: Technology | |
| SubSector: Software - Application | |
| MarketCap: 119881 Millions | |
| Recent Price: 288.78 Smart Investing & Trading Score: 0 | |
| Day Percent Change: -0.38% Day Change: -1.09 | |
| Week Change: -0.95% Year-to-date Change: -3.7% | |
| ADP Links: Profile News Message Board | |
| Charts:- Daily , Weekly | |
| Add ADP to Watchlist: View: Get Complete ADP Trend Analysis ➞ | |
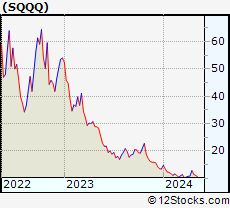 | SQQQ ProShares UltraPro Short QQQ -3x Shares |
| Sector: Financials | |
| SubSector: Exchange Traded Fund | |
| MarketCap: Millions | |
| Recent Price: 14.77 Smart Investing & Trading Score: 10 | |
| Day Percent Change: -0.47% Day Change: -0.07 | |
| Week Change: -5.02% Year-to-date Change: -47.7% | |
| SQQQ Links: Profile News Message Board | |
| Charts:- Daily , Weekly | |
| Add SQQQ to Watchlist: View: Get Complete SQQQ Trend Analysis ➞ | |
 | SNPS Synopsys, Inc |
| Sector: Technology | |
| SubSector: Software - Infrastructure | |
| MarketCap: 110682 Millions | |
| Recent Price: 468.89 Smart Investing & Trading Score: 20 | |
| Day Percent Change: -0.48% Day Change: -2.25 | |
| Week Change: -3.87% Year-to-date Change: -10.8% | |
| SNPS Links: Profile News Message Board | |
| Charts:- Daily , Weekly | |
| Add SNPS to Watchlist: View: Get Complete SNPS Trend Analysis ➞ | |
 | VRSK Verisk Analytics Inc |
| Sector: Industrials | |
| SubSector: Consulting Services | |
| MarketCap: 37766.4 Millions | |
| Recent Price: 246.22 Smart Investing & Trading Score: 30 | |
| Day Percent Change: -0.49% Day Change: -1.21 | |
| Week Change: -0.34% Year-to-date Change: -14.1% | |
| VRSK Links: Profile News Message Board | |
| Charts:- Daily , Weekly | |
| Add VRSK to Watchlist: View: Get Complete VRSK Trend Analysis ➞ | |
 | CRWD Crowdstrike Holdings Inc |
| Sector: Technology | |
| SubSector: Software - Infrastructure | |
| MarketCap: 104806 Millions | |
| Recent Price: 496.80 Smart Investing & Trading Score: 80 | |
| Day Percent Change: -0.632051% Day Change: -3.35 | |
| Week Change: 4.29744% Year-to-date Change: 43.0% | |
| CRWD Links: Profile News Message Board | |
| Charts:- Daily , Weekly | |
| Add CRWD to Watchlist: View: Get Complete CRWD Trend Analysis ➞ | |
 | NFLX Netflix Inc |
| Sector: Technology | |
| SubSector: Entertainment | |
| MarketCap: 528532 Millions | |
| Recent Price: 1155.12 Smart Investing & Trading Score: 10 | |
| Day Percent Change: -0.64% Day Change: -7.41 | |
| Week Change: -4.58% Year-to-date Change: 18.3% | |
| NFLX Links: Profile News Message Board | |
| Charts:- Daily , Weekly | |
| Add NFLX to Watchlist: View: Get Complete NFLX Trend Analysis ➞ | |
 | DDOG Datadog Inc |
| Sector: Technology | |
| SubSector: Software - Application | |
| MarketCap: 47457.2 Millions | |
| Recent Price: 151.57 Smart Investing & Trading Score: 100 | |
| Day Percent Change: -0.740013% Day Change: -0.63 | |
| Week Change: 10.9834% Year-to-date Change: 5.5% | |
| DDOG Links: Profile News Message Board | |
| Charts:- Daily , Weekly | |
| Add DDOG to Watchlist: View: Get Complete DDOG Trend Analysis ➞ | |
 | ADBE Adobe Inc |
| Sector: Technology | |
| SubSector: Software - Application | |
| MarketCap: 148033 Millions | |
| Recent Price: 348.79 Smart Investing & Trading Score: 50 | |
| Day Percent Change: -0.77% Day Change: -2.69 | |
| Week Change: -3.21% Year-to-date Change: -20.3% | |
| ADBE Links: Profile News Message Board | |
| Charts:- Daily , Weekly | |
| Add ADBE to Watchlist: View: Get Complete ADBE Trend Analysis ➞ | |
| For tabular summary view of above stock list: Summary View ➞ 0 - 30 , 30 - 60 , 60 - 90 , 90 - 120 | ||
| Click To Change The Sort Order: By Market Cap or Company Size Performance: Year-to-date, Week and Day | |
| Select Chart Type: | ||
|
Best Stocks Today 12Stocks.com |
© 2025 12Stocks.com Terms & Conditions Privacy Contact Us
All Information Provided Only For Education And Not To Be Used For Investing or Trading. See Terms & Conditions


One More Thing ... Get Best Stocks Delivered Daily!
Never Ever Miss A Move With Our Top Ten Stocks Lists
Find Best Stocks In Any Market - Bull or Bear Market
Take A Peek At Our Top Ten Stocks Lists: Daily, Weekly, Year-to-Date & Top Trends
Find Best Stocks In Any Market - Bull or Bear Market
Take A Peek At Our Top Ten Stocks Lists: Daily, Weekly, Year-to-Date & Top Trends
Nasdaq 100 Stocks With Best Up Trends [0-bearish to 100-bullish]: ASML Holding[100], Micron [100], Constellation Energy[100], Biogen [100], Intel Corp[100], Palo Alto[100], First Trust[100], PDD [100], Regeneron [100], UltraPro[100], Monster Beverage[100]
Best Nasdaq 100 Stocks Year-to-Date:
Micron [106.55%], Intel Corp[94.34%], Warner Bros.[87.36%], Lam Research[82.03%], Zscaler [69.3163%], Electronic Arts[64.1%], DoorDash [58.3182%], NVIDIA Corp[57.97%], Broadcom [55.82%], KLA Corp[53.17%], Idexx [51.51%] Best Nasdaq 100 Stocks This Week:
Micron [19.56%], Moderna [15.43%], Biogen [14.82%], Lam Research[14.34%], Astrazeneca [11.0138%], Datadog [10.9834%], Constellation Energy[10.17%], AMGEN [9.15%], Illumina [9%], ASML Holding[8.78936%], Trade Desk[8.57691%] Best Nasdaq 100 Stocks Daily:
Microchip [3.66%], Trade Desk[3.18329%], Marvell [2.76553%], ASML Holding[2.68123%], GlobalFoundries [2.49%], Micron [2.33%], Constellation Energy[2.1%], ON Semiconductor[2.09%], Warner Bros.[1.66%], Biogen [1.6%], MongoDB [1.48042%]