
 Login Sign Up


| |||||
 |  | ||||

| 12Stocks.com Market Intelligence |
Best Nasdaq Stocks
|
On this page, you will find the most comprehensive analysis of Nasdaq 100 stocks and ETFs - from latest trends to performances to charts ➞. First, here are the year-to-date (YTD) performances of the most requested Nasdaq stocks at 12Stocks.com (click stock for review):
| Baidu 64% | ||
| Intel Corp 51% | ||
| Netflix 36% | ||
| Google 33% | ||
| NVIDIA Corp 27% | ||
| Gilead 25% | ||
| Microsoft 22% | ||
| Expedia 20% | ||
| Qualcomm 11% | ||
| Tesla 10% | ||
| AMGEN 8% | ||
| Costco 5% | ||
| Amazon.com 5% | ||
| Apple -2% | ||
| Biogen -4% | ||
| Starbucks Corp -8% | ||
| Comcast Corp -13% | ||
| Nasdaq 100 Stocks Lists: Performances & Trends, Nasdaq 100 Stock Charts
Sort Nasdaq 100 stocks: Daily, Weekly, Year-to-Date, Market Cap & Trends. |
| 12Stocks.com Nasdaq Stocks Performances & Trends Daily Report | |||||||||
|
| 
The overall Smart Investing & Trading Score is 100 (0-bearish to 100-bullish) which puts Nasdaq index in short term bullish trend. The Smart Investing & Trading Score from previous trading session is 60 and an improvement of trend continues. | ||||||||
Here are the Smart Investing & Trading Scores of the most requested Nasdaq 100 stocks at 12Stocks.com (click stock name for detailed review):
|


| 12Stocks.com: Top Performing Nasdaq 100 Index Stocks | ||||||||||||||||||||||||||||||||||||||||||||||||
 The top performing Nasdaq 100 Index stocks year to date are
Now, more recently, over last week, the top performing Nasdaq 100 Index stocks on the move are


|
||||||||||||||||||||||||||||||||||||||||||||||||
| 12Stocks.com: Investing in Nasdaq 100 Index with Stocks | |
|
The following table helps investors and traders sort through current performance and trends (as measured by Smart Investing & Trading Score) of various
stocks in the Nasdaq 100 Index. Quick View: Move mouse or cursor over stock symbol (ticker) to view short-term technical chart and over stock name to view long term chart. Click on  to add stock symbol to your watchlist and to add stock symbol to your watchlist and  to view watchlist. Click on any ticker or stock name for detailed market intelligence report for that stock. to view watchlist. Click on any ticker or stock name for detailed market intelligence report for that stock. |
12Stocks.com Performance of Stocks in Nasdaq 100 Index
| Ticker | Stock Name | Watchlist | Category | Recent Price | Smart Investing & Trading Score | Change % | YTD Change% |
| INTC | Intel Corp |   | Technology | 30.57 | 100 | 22.77 | 51.19% |
| CRWD | Crowdstrike | | Technology | 504.00 | 90 | 13.13 | 45.10% |
| SNPS | Synopsys | | Technology | 480.11 | 40 | 12.86 | -0.55% |
| AMAT | Applied Materials | | Technology | 189.76 | 90 | 6.53 | 16.40% |
| ASML | ASML Holding | | Technology | 927.80 | 100 | 6.37 | 33.46% |
| KLAC | KLA Corp | | Technology | 1046.69 | 100 | 5.74 | 65.18% |
| MU | Micron | | Technology | 168.90 | 100 | 5.57 | 93.84% |
| CDNS | Cadence Design | | Technology | 364.88 | 90 | 5.07 | 22.58% |
| MRVL | Marvell | | Technology | 74.23 | 80 | 4.58 | -34.47% |
| ZS | Zscaler | | Technology | 291.11 | 80 | 4.17 | 60.25% |
| ON | ON Semiconductor | | Technology | 51.83 | 80 | 4.08 | -16.01% |
| LULU | Lululemon Athletica | | Services & Goods | 169.76 | 60 | 3.84 | -54.40% |
| LRCX | Lam Research | | Technology | 126.32 | 100 | 3.63 | 75.34% |
| NVDA | NVIDIA Corp | | Technology | 176.24 | 70 | 3.49 | 27.44% |
| GFS | GlobalFoundries | | Technology | 33.27 | 10 | 3.42 | -19.70% |
| DASH | DoorDash | | Services & Goods | 268.07 | 90 | 3.40 | 57.09% |
| WBD | Warner Bros. | | Technology | 18.52 | 20 | 2.95 | 77.39% |
| TQQQ | UltraPro | | Financials | 100.98 | 100 | 2.70 | 29.16% |
| IDXX | Idexx | | Health Care | 655.51 | 90 | 2.29 | 60.33% |
| REGN | Regeneron | | Health Care | 598.71 | 100 | 2.26 | -16.06% |
| ILMN | Illumina | | Health Care | 103.03 | 90 | 2.14 | -21.31% |
| NXPI | NXP Semiconductors | | Technology | 226.51 | 50 | 2.08 | 10.90% |
| CSX | CSX Corp | | Industrials | 33.43 | 80 | 2.01 | 4.81% |
| DDOG | Datadog | | Technology | 136.81 | 50 | 1.92 | -4.75% |
| INTU | Intuit | | Technology | 674.96 | 70 | 1.85 | 8.89% |
| ABNB | Airbnb | | Services & Goods | 125.47 | 50 | 1.84 | -4.57% |
| MRNA | Moderna | | Health Care | 25.45 | 80 | 1.80 | -39.40% |
| QCOM | Qualcomm | | Technology | 168.13 | 100 | 1.74 | 10.68% |
| BKR | Baker Hughes | | Energy | 47.28 | 100 | 1.72 | 15.65% |
| CSGP | Costar | | Financials | 89.26 | 50 | 1.58 | 26.02% |
| For chart view version of above stock list: Chart View ➞ 0 - 30 , 30 - 60 , 60 - 90 , 90 - 120 | ||
 | Click To Change The Sort Order: By Market Cap or Company Size Performance: Year-to-date, Week and Day |  |
|
Get the most comprehensive stock market coverage daily at 12Stocks.com ➞ Best Stocks Today ➞ Best Stocks Weekly ➞ Best Stocks Year-to-Date ➞ Best Stocks Trends ➞  Best Stocks Today 12Stocks.com Best Dow Stocks ➞ Best S&P 500 Stocks ➞ Best Tech Stocks ➞ Best Biotech Stocks ➞ |
| Detailed Overview of Nasdaq 100 Stocks |
| Nasdaq 100 Technical Overview, Leaders & Laggards, Top Nasdaq 100 ETF Funds & Detailed Nasdaq 100 Stocks List, Charts, Trends & More |
| Nasdaq 100: Technical Analysis, Trends & YTD Performance | |
| Nasdaq 100 index as represented by
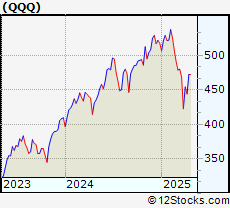
QQQ, an exchange-traded fund [ETF], holds basket of one hundred (mostly largecap) stocks from technology, biotech & retail sectors of the US stock market. The Nasdaq 100 index (contains stocks like Apple and Amgen) is up by 16.982% and is currently outperforming the overall market by 3.1219% year-to-date. Below is a quick view of technical charts and trends: | |
 QQQ Weekly Chart |
|
| Long Term Trend: Very Good | |
| Medium Term Trend: Good | |
 QQQ Daily Chart |
|
| Short Term Trend: Very Good | |
| Overall Trend Score: 100 | |
| YTD Performance: 16.982% | |
| **Trend Scores & Views Are Only For Educational Purposes And Not For Investing | |
| 12Stocks.com: Investing in Nasdaq 100 Index using Exchange Traded Funds | |
|
The following table shows list of key exchange traded funds (ETF) that
help investors track Nasdaq 100 index. The following list also includes leveraged ETF funds that track twice or thrice the daily returns of Nasdaq 100 indices. Short or inverse ETF funds move in the opposite direction to the index they track and are useful during market pullbacks or during bear markets. Quick View: Move mouse or cursor over ETF symbol (ticker) to view short-term technical chart and over ETF name to view long term chart. Click on ticker or stock name for detailed view. Click on to add stock symbol to your watchlist and to view watchlist. |
12Stocks.com List of ETFs that track Nasdaq 100 Index
| Ticker | ETF Name | Watchlist | Recent Price | Smart Investing & Trading Score | Change % | Week % | Year-to-date % |
| SQQQ | ProShares UltraPro Short QQQ -3x Shares | | 15.86 | 10 | -2.69939 | -6.97947 | -48.0232% |
| TQQQ | ProShares UltraPro QQQ 3x Shares | | 100.98 | 100 | 2.69501 | 7.43696 | 29.1636% |
| QQQ | Invesco QQQ Trust Series 1 | | 595.32 | 100 | 0.901695 | 2.51765 | 16.982% |
| QID | ProShares UltraShort QQQ -2x Shares | | 22.14 | 10 | -1.77462 | -4.61008 | -31.1267% |
| QYLD | Global X NASDAQ 100 Covered Call ETF | | 17.01 | 90 | -0.0587544 | 0.770142 | 0.239254% |
| QLD | ProShares Ultra QQQ 2x Shares | | 134.96 | 100 | 1.84892 | 4.97006 | 25.4124% |
| QTEC | First Trust NASDAQ-100 Technology Sector Index Fund | | 227.42 | 100 | 2.59395 | 5.39927 | 20.5756% |
| QQQE | Direxion NASDAQ-100 Equal Weighted Index Shares | | 100.88 | 100 | 1.12269 | 3.20205 | 12.6817% |
| QQQX | Nuveen NASDAQ 100 Dynamic Overwrite Fund | | 27.02 | 40 | -0.258398 | -1.24269 | 5.18694% |
| QQEW | First Trust NASDAQ-100 Equal Weighted Index Fund | | 140.05 | 100 | 1.18489 | 3.21321 | 12.3213% |
| QQXT | First Trust Nasdaq-100 Ex-Technology Sector Index Fund | | 98.26 | 20 | 0.0910665 | 0.659423 | 6.04868% |
| 12Stocks.com: Charts, Trends, Fundamental Data and Performances of Nasdaq 100 Stocks | |
|
We now take in-depth look at all Nasdaq 100 stocks including charts, multi-period performances and overall trends (as measured by Smart Investing & Trading Score). One can sort Nasdaq 100 stocks (click link to choose) by Daily, Weekly and by Year-to-Date performances. Also, one can sort by size of the company or by market capitalization. |
| Select Your Default Chart Type: | |||||
| |||||
| Click on stock symbol or name for detailed view. Click on to add stock symbol to your watchlist and to view watchlist. Quick View: Move mouse or cursor over "Daily" to quickly view daily technical stock chart and over "Weekly" to view weekly technical stock chart. | |||||

 | INTC Intel Corp |
| Sector: Technology | |
| SubSector: Semiconductors | |
| MarketCap: 107193 Millions | |
| Recent Price: 30.57 Smart Investing & Trading Score: 100 | |
| Day Percent Change: 22.7711% Day Change: 5.63 | |
| Week Change: 23.4154% Year-to-date Change: 51.2% | |
| INTC Links: Profile News Message Board | |
| Charts:- Daily , Weekly | |
| Add INTC to Watchlist: View: Get Complete INTC Trend Analysis ➞ | |
 | CRWD Crowdstrike Holdings Inc |
| Sector: Technology | |
| SubSector: Software - Infrastructure | |
| MarketCap: 104806 Millions | |
| Recent Price: 504.00 Smart Investing & Trading Score: 90 | |
| Day Percent Change: 13.1313% Day Change: 57.6 | |
| Week Change: 18.6245% Year-to-date Change: 45.1% | |
| CRWD Links: Profile News Message Board | |
| Charts:- Daily , Weekly | |
| Add CRWD to Watchlist: View: Get Complete CRWD Trend Analysis ➞ | |
 | SNPS Synopsys, Inc |
| Sector: Technology | |
| SubSector: Software - Infrastructure | |
| MarketCap: 110682 Millions | |
| Recent Price: 480.11 Smart Investing & Trading Score: 40 | |
| Day Percent Change: 12.8608% Day Change: 55.76 | |
| Week Change: 23.8099% Year-to-date Change: -0.5% | |
| SNPS Links: Profile News Message Board | |
| Charts:- Daily , Weekly | |
| Add SNPS to Watchlist: View: Get Complete SNPS Trend Analysis ➞ | |
 | AMAT Applied Materials Inc |
| Sector: Technology | |
| SubSector: Semiconductor Equipment & Materials | |
| MarketCap: 129654 Millions | |
| Recent Price: 189.76 Smart Investing & Trading Score: 90 | |
| Day Percent Change: 6.52894% Day Change: 11.53 | |
| Week Change: 16.118% Year-to-date Change: 16.4% | |
| AMAT Links: Profile News Message Board | |
| Charts:- Daily , Weekly | |
| Add AMAT to Watchlist: View: Get Complete AMAT Trend Analysis ➞ | |
 | ASML ASML Holding NV |
| Sector: Technology | |
| SubSector: Semiconductor Equipment & Materials | |
| MarketCap: 307427 Millions | |
| Recent Price: 927.80 Smart Investing & Trading Score: 100 | |
| Day Percent Change: 6.36615% Day Change: 56.63 | |
| Week Change: 16.9781% Year-to-date Change: 33.5% | |
| ASML Links: Profile News Message Board | |
| Charts:- Daily , Weekly | |
| Add ASML to Watchlist: View: Get Complete ASML Trend Analysis ➞ | |
 | KLAC KLA Corp |
| Sector: Technology | |
| SubSector: Semiconductor Equipment & Materials | |
| MarketCap: 119437 Millions | |
| Recent Price: 1046.69 Smart Investing & Trading Score: 100 | |
| Day Percent Change: 5.74015% Day Change: 65.31 | |
| Week Change: 12.2299% Year-to-date Change: 65.2% | |
| KLAC Links: Profile News Message Board | |
| Charts:- Daily , Weekly | |
| Add KLAC to Watchlist: View: Get Complete KLAC Trend Analysis ➞ | |
 | MU Micron Technology Inc |
| Sector: Technology | |
| SubSector: Semiconductors | |
| MarketCap: 147019 Millions | |
| Recent Price: 168.90 Smart Investing & Trading Score: 100 | |
| Day Percent Change: 5.56972% Day Change: 8.72 | |
| Week Change: 20.6436% Year-to-date Change: 93.8% | |
| MU Links: Profile News Message Board | |
| Charts:- Daily , Weekly | |
| Add MU to Watchlist: View: Get Complete MU Trend Analysis ➞ | |
 | CDNS Cadence Design Systems, Inc |
| Sector: Technology | |
| SubSector: Software - Application | |
| MarketCap: 95646.7 Millions | |
| Recent Price: 364.88 Smart Investing & Trading Score: 90 | |
| Day Percent Change: 5.07098% Day Change: 17.68 | |
| Week Change: 7.78365% Year-to-date Change: 22.6% | |
| CDNS Links: Profile News Message Board | |
| Charts:- Daily , Weekly | |
| Add CDNS to Watchlist: View: Get Complete CDNS Trend Analysis ➞ | |
 | MRVL Marvell Technology Inc |
| Sector: Technology | |
| SubSector: Semiconductors | |
| MarketCap: 54596.8 Millions | |
| Recent Price: 74.23 Smart Investing & Trading Score: 80 | |
| Day Percent Change: 4.57875% Day Change: 3.68 | |
| Week Change: 10.6424% Year-to-date Change: -34.5% | |
| MRVL Links: Profile News Message Board | |
| Charts:- Daily , Weekly | |
| Add MRVL to Watchlist: View: Get Complete MRVL Trend Analysis ➞ | |
 | ZS Zscaler Inc |
| Sector: Technology | |
| SubSector: Software - Infrastructure | |
| MarketCap: 42691.8 Millions | |
| Recent Price: 291.11 Smart Investing & Trading Score: 80 | |
| Day Percent Change: 4.16875% Day Change: 11.25 | |
| Week Change: 4.4191% Year-to-date Change: 60.2% | |
| ZS Links: Profile News Message Board | |
| Charts:- Daily , Weekly | |
| Add ZS to Watchlist: View: Get Complete ZS Trend Analysis ➞ | |
 | ON ON Semiconductor Corp |
| Sector: Technology | |
| SubSector: Semiconductors | |
| MarketCap: 20082.7 Millions | |
| Recent Price: 51.83 Smart Investing & Trading Score: 80 | |
| Day Percent Change: 4.07631% Day Change: 2.35 | |
| Week Change: 7.68751% Year-to-date Change: -16.0% | |
| ON Links: Profile News Message Board | |
| Charts:- Daily , Weekly | |
| Add ON to Watchlist: View: Get Complete ON Trend Analysis ➞ | |
 | LULU Lululemon Athletica inc |
| Sector: Services & Goods | |
| SubSector: Apparel Retail | |
| MarketCap: 20756.9 Millions | |
| Recent Price: 169.76 Smart Investing & Trading Score: 60 | |
| Day Percent Change: 3.84145% Day Change: 5.75 | |
| Week Change: 3.57535% Year-to-date Change: -54.4% | |
| LULU Links: Profile News Message Board | |
| Charts:- Daily , Weekly | |
| Add LULU to Watchlist: View: Get Complete LULU Trend Analysis ➞ | |
 | LRCX Lam Research Corp |
| Sector: Technology | |
| SubSector: Semiconductor Equipment & Materials | |
| MarketCap: 130296 Millions | |
| Recent Price: 126.32 Smart Investing & Trading Score: 100 | |
| Day Percent Change: 3.62592% Day Change: 5.65 | |
| Week Change: 17.6602% Year-to-date Change: 75.3% | |
| LRCX Links: Profile News Message Board | |
| Charts:- Daily , Weekly | |
| Add LRCX to Watchlist: View: Get Complete LRCX Trend Analysis ➞ | |
 | NVDA NVIDIA Corp |
| Sector: Technology | |
| SubSector: Semiconductors | |
| MarketCap: 4058590 Millions | |
| Recent Price: 176.24 Smart Investing & Trading Score: 70 | |
| Day Percent Change: 3.49404% Day Change: 6.62 | |
| Week Change: -0.614673% Year-to-date Change: 27.4% | |
| NVDA Links: Profile News Message Board | |
| Charts:- Daily , Weekly | |
| Add NVDA to Watchlist: View: Get Complete NVDA Trend Analysis ➞ | |
 | GFS GlobalFoundries Inc |
| Sector: Technology | |
| SubSector: Semiconductors | |
| MarketCap: 18406.5 Millions | |
| Recent Price: 33.27 Smart Investing & Trading Score: 10 | |
| Day Percent Change: 3.42% Day Change: 1.1 | |
| Week Change: 5.15% Year-to-date Change: -19.7% | |
| GFS Links: Profile News Message Board | |
| Charts:- Daily , Weekly | |
| Add GFS to Watchlist: View: Get Complete GFS Trend Analysis ➞ | |
 | DASH DoorDash Inc |
| Sector: Services & Goods | |
| SubSector: Internet Retail | |
| MarketCap: 105453 Millions | |
| Recent Price: 268.07 Smart Investing & Trading Score: 90 | |
| Day Percent Change: 3.40212% Day Change: 7.23 | |
| Week Change: 4.13316% Year-to-date Change: 57.1% | |
| DASH Links: Profile News Message Board | |
| Charts:- Daily , Weekly | |
| Add DASH to Watchlist: View: Get Complete DASH Trend Analysis ➞ | |
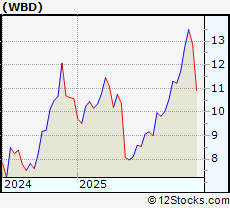 | WBD Warner Bros. Discovery Inc |
| Sector: Technology | |
| SubSector: Entertainment | |
| MarketCap: 29981.6 Millions | |
| Recent Price: 18.52 Smart Investing & Trading Score: 20 | |
| Day Percent Change: 2.95% Day Change: 0.53 | |
| Week Change: -1.85% Year-to-date Change: 77.4% | |
| WBD Links: Profile News Message Board | |
| Charts:- Daily , Weekly | |
| Add WBD to Watchlist: View: Get Complete WBD Trend Analysis ➞ | |
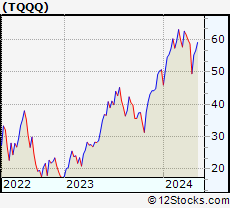 | TQQQ ProShares UltraPro QQQ 3x Shares |
| Sector: Financials | |
| SubSector: Exchange Traded Fund | |
| MarketCap: Millions | |
| Recent Price: 100.98 Smart Investing & Trading Score: 100 | |
| Day Percent Change: 2.69501% Day Change: 3.42 | |
| Week Change: 7.43696% Year-to-date Change: 29.2% | |
| TQQQ Links: Profile News Message Board | |
| Charts:- Daily , Weekly | |
| Add TQQQ to Watchlist: View: Get Complete TQQQ Trend Analysis ➞ | |
 | IDXX Idexx Laboratories, Inc |
| Sector: Health Care | |
| SubSector: Diagnostics & Research | |
| MarketCap: 51442.2 Millions | |
| Recent Price: 655.51 Smart Investing & Trading Score: 90 | |
| Day Percent Change: 2.28599% Day Change: 15.18 | |
| Week Change: 2.75257% Year-to-date Change: 60.3% | |
| IDXX Links: Profile News Message Board | |
| Charts:- Daily , Weekly | |
| Add IDXX to Watchlist: View: Get Complete IDXX Trend Analysis ➞ | |
 | REGN Regeneron Pharmaceuticals, Inc |
| Sector: Health Care | |
| SubSector: Biotechnology | |
| MarketCap: 60771.1 Millions | |
| Recent Price: 598.71 Smart Investing & Trading Score: 100 | |
| Day Percent Change: 2.25619% Day Change: 11.41 | |
| Week Change: 7.71459% Year-to-date Change: -16.1% | |
| REGN Links: Profile News Message Board | |
| Charts:- Daily , Weekly | |
| Add REGN to Watchlist: View: Get Complete REGN Trend Analysis ➞ | |
 | ILMN Illumina Inc |
| Sector: Health Care | |
| SubSector: Diagnostics & Research | |
| MarketCap: 15205.5 Millions | |
| Recent Price: 103.03 Smart Investing & Trading Score: 90 | |
| Day Percent Change: 2.14137% Day Change: 2.46 | |
| Week Change: 7.89611% Year-to-date Change: -21.3% | |
| ILMN Links: Profile News Message Board | |
| Charts:- Daily , Weekly | |
| Add ILMN to Watchlist: View: Get Complete ILMN Trend Analysis ➞ | |
 | NXPI NXP Semiconductors NV |
| Sector: Technology | |
| SubSector: Semiconductors | |
| MarketCap: 57164.5 Millions | |
| Recent Price: 226.51 Smart Investing & Trading Score: 50 | |
| Day Percent Change: 2.08211% Day Change: 4.57 | |
| Week Change: 3.29715% Year-to-date Change: 10.9% | |
| NXPI Links: Profile News Message Board | |
| Charts:- Daily , Weekly | |
| Add NXPI to Watchlist: View: Get Complete NXPI Trend Analysis ➞ | |
 | CSX CSX Corp |
| Sector: Industrials | |
| SubSector: Railroads | |
| MarketCap: 60644.9 Millions | |
| Recent Price: 33.43 Smart Investing & Trading Score: 80 | |
| Day Percent Change: 2.01404% Day Change: 0.74 | |
| Week Change: 4.30577% Year-to-date Change: 4.8% | |
| CSX Links: Profile News Message Board | |
| Charts:- Daily , Weekly | |
| Add CSX to Watchlist: View: Get Complete CSX Trend Analysis ➞ | |
 | DDOG Datadog Inc |
| Sector: Technology | |
| SubSector: Software - Application | |
| MarketCap: 47457.2 Millions | |
| Recent Price: 136.81 Smart Investing & Trading Score: 50 | |
| Day Percent Change: 1.92207% Day Change: 2.91 | |
| Week Change: -1.66751% Year-to-date Change: -4.7% | |
| DDOG Links: Profile News Message Board | |
| Charts:- Daily , Weekly | |
| Add DDOG to Watchlist: View: Get Complete DDOG Trend Analysis ➞ | |
 | INTU Intuit Inc |
| Sector: Technology | |
| SubSector: Software - Application | |
| MarketCap: 187586 Millions | |
| Recent Price: 674.96 Smart Investing & Trading Score: 70 | |
| Day Percent Change: 1.85308% Day Change: 18.11 | |
| Week Change: 2.84948% Year-to-date Change: 8.9% | |
| INTU Links: Profile News Message Board | |
| Charts:- Daily , Weekly | |
| Add INTU to Watchlist: View: Get Complete INTU Trend Analysis ➞ | |
 | ABNB Airbnb Inc |
| Sector: Services & Goods | |
| SubSector: Travel Services | |
| MarketCap: 76940 Millions | |
| Recent Price: 125.47 Smart Investing & Trading Score: 50 | |
| Day Percent Change: 1.84253% Day Change: 2.01 | |
| Week Change: 1.66923% Year-to-date Change: -4.6% | |
| ABNB Links: Profile News Message Board | |
| Charts:- Daily , Weekly | |
| Add ABNB to Watchlist: View: Get Complete ABNB Trend Analysis ➞ | |
 | MRNA Moderna Inc |
| Sector: Health Care | |
| SubSector: Biotechnology | |
| MarketCap: 9781.46 Millions | |
| Recent Price: 25.45 Smart Investing & Trading Score: 80 | |
| Day Percent Change: 1.8% Day Change: 0.81 | |
| Week Change: 4.68943% Year-to-date Change: -39.4% | |
| MRNA Links: Profile News Message Board | |
| Charts:- Daily , Weekly | |
| Add MRNA to Watchlist: View: Get Complete MRNA Trend Analysis ➞ | |
 | QCOM Qualcomm, Inc |
| Sector: Technology | |
| SubSector: Semiconductors | |
| MarketCap: 172467 Millions | |
| Recent Price: 168.13 Smart Investing & Trading Score: 100 | |
| Day Percent Change: 1.73666% Day Change: 1.62 | |
| Week Change: 5.7754% Year-to-date Change: 10.7% | |
| QCOM Links: Profile News Message Board | |
| Charts:- Daily , Weekly | |
| Add QCOM to Watchlist: View: Get Complete QCOM Trend Analysis ➞ | |
 | BKR Baker Hughes Co |
| Sector: Energy | |
| SubSector: Oil & Gas Equipment & Services | |
| MarketCap: 44936.4 Millions | |
| Recent Price: 47.28 Smart Investing & Trading Score: 100 | |
| Day Percent Change: 1.72117% Day Change: 0.71 | |
| Week Change: 0.767263% Year-to-date Change: 15.6% | |
| BKR Links: Profile News Message Board | |
| Charts:- Daily , Weekly | |
| Add BKR to Watchlist: View: Get Complete BKR Trend Analysis ➞ | |
 | CSGP Costar Group, Inc |
| Sector: Financials | |
| SubSector: Real Estate Services | |
| MarketCap: 37899.8 Millions | |
| Recent Price: 89.26 Smart Investing & Trading Score: 50 | |
| Day Percent Change: 1.58188% Day Change: 1.12 | |
| Week Change: 3.4299% Year-to-date Change: 26.0% | |
| CSGP Links: Profile News Message Board | |
| Charts:- Daily , Weekly | |
| Add CSGP to Watchlist: View: Get Complete CSGP Trend Analysis ➞ | |
| For tabular summary view of above stock list: Summary View ➞ 0 - 30 , 30 - 60 , 60 - 90 , 90 - 120 | ||
| Click To Change The Sort Order: By Market Cap or Company Size Performance: Year-to-date, Week and Day | |
| Select Chart Type: | ||
|
Best Stocks Today 12Stocks.com |
© 2025 12Stocks.com Terms & Conditions Privacy Contact Us
All Information Provided Only For Education And Not To Be Used For Investing or Trading. See Terms & Conditions


One More Thing ... Get Best Stocks Delivered Daily!
Never Ever Miss A Move With Our Top Ten Stocks Lists
Find Best Stocks In Any Market - Bull or Bear Market
Take A Peek At Our Top Ten Stocks Lists: Daily, Weekly, Year-to-Date & Top Trends
Find Best Stocks In Any Market - Bull or Bear Market
Take A Peek At Our Top Ten Stocks Lists: Daily, Weekly, Year-to-Date & Top Trends
Nasdaq 100 Stocks With Best Up Trends [0-bearish to 100-bullish]: Intel Corp[100], ASML Holding[100], KLA Corp[100], Micron [100], Lam Research[100], UltraPro[100], Regeneron [100], Qualcomm [100], Baker Hughes[100], Palo Alto[100], First Trust[100]
Best Nasdaq 100 Stocks Year-to-Date:
Micron [93.8396%], Warner Bros.[77.39%], Lam Research[75.3402%], KLA Corp[65.1816%], Idexx [60.3302%], Zscaler [60.2499%], DoorDash [57.0876%], Intel Corp[51.1869%], Broadcom [49.6745%], Crowdstrike [45.1028%], MercadoLibre [40.3042%] Best Nasdaq 100 Stocks This Week:
Splunk [38.7643%], Synopsys [23.8099%], Intel Corp[23.4154%], Micron [20.6436%], Tesla [19.7217%], Crowdstrike [18.6245%], Lam Research[17.6602%], ASML Holding[16.9781%], Applied Materials[16.118%], KLA Corp[12.2299%], Marvell [10.6424%] Best Nasdaq 100 Stocks Daily:
Intel Corp[22.7711%], Crowdstrike [13.1313%], Synopsys [12.8608%], Applied Materials[6.52894%], ASML Holding[6.36615%], KLA Corp[5.74015%], Micron [5.56972%], Cadence Design[5.07098%], Marvell [4.57875%], Zscaler [4.16875%], ON Semiconductor[4.07631%]