
 Login Sign Up


| |||||
 |  | ||||

| 12Stocks.com Market Intelligence |
Best MidCap Stocks
|
| In a hurry? Mid Cap Stocks Lists: Performance Trends Table, Stock Charts
Sort midcap stocks: Daily, Weekly, Year-to-Date, Market Cap & Trends. Filter midcap stocks list by sector: Show all, Tech, Finance, Energy, Staples, Retail, Industrial, Materials, Utilities and HealthCare Filter midcap stocks list by size:All MidCap Large Mid-Range Small |
| 12Stocks.com Mid Cap Stocks Performances & Trends Daily | |||||||||
|
|  The overall Smart Investing & Trading Score is 38 (0-bearish to 100-bullish) which puts Mid Cap index in short term bearish to neutral trend. The Smart Investing & Trading Score from previous trading session is 7 and hence an improvement of trend.
| ||||||||
Here are the Smart Investing & Trading Scores of the most requested mid cap stocks at 12Stocks.com (click stock name for detailed review):
|


| 12Stocks.com: Top Performing Mid Cap Index Stocks | ||||||||||||||||||||||||||||||||||||||||||||||||
 The top performing Mid Cap Index stocks year to date are
Now, more recently, over last week, the top performing Mid Cap Index stocks on the move are


|
||||||||||||||||||||||||||||||||||||||||||||||||
| 12Stocks.com: Investing in Midcap Index with Stocks | |
|
The following table helps investors and traders sort through current performance and trends (as measured by Smart Investing & Trading Score) of various
stocks in the Midcap Index. Quick View: Move mouse or cursor over stock symbol (ticker) to view short-term technical chart and over stock name to view long term chart. Click on  to add stock symbol to your watchlist and to add stock symbol to your watchlist and  to view watchlist. Click on any ticker or stock name for detailed market intelligence report for that stock. to view watchlist. Click on any ticker or stock name for detailed market intelligence report for that stock. |
12Stocks.com Performance of Stocks in Midcap Index
| Ticker | Stock Name | Watchlist | Category | Recent Price | Smart Investing & Trading Score | Change % | YTD Change% |
| CUBE | CubeSmart |   | Financials | 41.51 | 25 | 1.74% | -10.44% |
| LNC | Loln National | | Financials | 26.84 | 5 | -3.07% | -0.48% |
| TFSL | TFS Financial | | Financials | 12.98 | 100 | 2.20% | -11.64% |
| CMA | Comerica | | Financials | 51.59 | 68 | 0.74% | -7.56% |
| RGA | Reinsurance | | Financials | 192.19 | 85 | 0.66% | 18.79% |
| ORI | Old Republic | | Financials | 30.69 | 90 | 1.35% | 4.39% |
| VIRT | Virtu Financial | | Financials | 22.02 | 85 | 0.16% | 8.71% |
| REXR | Rexford Industrial | | Financials | 43.55 | 20 | 2.74% | -22.37% |
| FAF | First American | | Financials | 54.11 | 10 | 1.69% | -16.03% |
| LPLA | LPL Financial | | Financials | 269.65 | 78 | 1.57% | 18.47% |
| KMPR | Kemper | | Financials | 57.49 | 8 | -1.71% | 18.12% |
| EGP | East Properties | | Financials | 159.12 | 25 | 1.44% | -13.31% |
| JEF | Jefferies Financial | | Financials | 44.04 | 51 | 1.90% | 8.98% |
| FR | First Industrial | | Financials | 46.87 | 32 | 1.85% | -11.01% |
| CUZ | Cousins Properties | | Financials | 23.61 | 86 | 3.01% | -3.04% |
| STAG | STAG Industrial | | Financials | 35.26 | 25 | 1.28% | -10.20% |
| HR | Realty | | Financials | 14.71 | 100 | 1.34% | -14.65% |
| AXS | AXIS Capital | | Financials | 65.20 | 100 | 5.26% | 17.75% |
| THG | Hanover Insurance | | Financials | 129.00 | 100 | -1.64% | 6.24% |
| BRX | Brixmor Property | | Financials | 22.60 | 70 | 1.85% | -2.88% |
| CFR | Cullen/Frost Bankers | | Financials | 106.47 | 35 | 1.13% | -1.86% |
| RLI | RLI | | Financials | 143.17 | 37 | -0.06% | 7.55% |
| STWD | Starwood Property | | Financials | 19.34 | 28 | 1.18% | -7.97% |
| HLI | Houlihan Lokey | | Financials | 130.34 | 90 | 2.36% | 8.70% |
| HIW | Highwoods Properties | | Financials | 26.68 | 81 | 3.05% | 16.20% |
| For chart view version of above stock list: Chart View ➞ 0 - 25 , 25 - 50 , 50 - 75 , 75 - 100 , 100 - 125 , 125 - 150 , 150 - 175 | ||
 | Click To Change The Sort Order: By Market Cap or Company Size Performance: Year-to-date, Week and Day |  |
|
Get the most comprehensive stock market coverage daily at 12Stocks.com ➞ Best Stocks Today ➞ Best Stocks Weekly ➞ Best Stocks Year-to-Date ➞ Best Stocks Trends ➞  Best Stocks Today 12Stocks.com Best Nasdaq Stocks ➞ Best S&P 500 Stocks ➞ Best Tech Stocks ➞ Best Biotech Stocks ➞ |
| Detailed Overview of Midcap Stocks |
| Midcap Technical Overview, Leaders & Laggards, Top Midcap ETF Funds & Detailed Midcap Stocks List, Charts, Trends & More |
| Midcap: Technical Analysis, Trends & YTD Performance | |
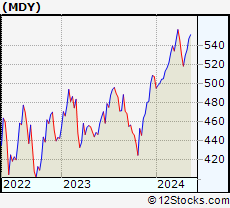
| MidCap segment as represented by
MDY, an exchange-traded fund [ETF], holds basket of about four hundred midcap stocks from across all major sectors of the US stock market. The midcap index (contains stocks like Green Mountain Coffee Roasters and Tractor Supply Company) is up by 4.52% and is currently underperforming the overall market by -1.07% year-to-date. Below is a quick view of technical charts and trends: | |
 MDY Weekly Chart |
|
| Long Term Trend: Not Good | |
| Medium Term Trend: Not Good | |
 MDY Daily Chart |
|
| Short Term Trend: Deteriorating | |
| Overall Trend Score: 38 | |
| YTD Performance: 4.52% | |
| **Trend Scores & Views Are Only For Educational Purposes And Not For Investing | |
| 12Stocks.com: Investing in Midcap Index using Exchange Traded Funds | |
|
The following table shows list of key exchange traded funds (ETF) that
help investors track Midcap index. The following list also includes leveraged ETF funds that track twice or thrice the daily returns of Midcap indices. Short or inverse ETF funds move in the opposite direction to the index they track and are useful during market pullbacks or during bear markets. Quick View: Move mouse or cursor over ETF symbol (ticker) to view short-term technical chart and over ETF name to view long term chart. Click on ticker or stock name for detailed view. Click on to add stock symbol to your watchlist and to view watchlist. |
12Stocks.com List of ETFs that track Midcap Index
| Ticker | ETF Name | Watchlist | Recent Price | Smart Investing & Trading Score | Change % | Week % | Year-to-date % |
| IJH | iShares Core S&P Mid-Cap | | 57.97 | 38 | 1.42 | 0.26 | 4.58% |
| IWR | iShares Russell Mid-Cap | | 80.25 | 17 | 0.98 | -0.33 | 3.25% |
| MDY | SPDR S&P MidCap 400 ETF | | 530.30 | 38 | 1.36 | 0.17 | 4.52% |
| IWP | iShares Russell Mid-Cap Growth | | 108.26 | 17 | 0.74 | -0.66 | 3.64% |
| IWS | iShares Russell Mid-Cap Value | | 119.90 | 38 | 0.95 | -0.08 | 3.1% |
| IJK | iShares S&P Mid-Cap 400 Growth | | 87.00 | 30 | 1.36 | -0.01 | 9.81% |
| IJJ | iShares S&P Mid-Cap 400 Value | | 112.79 | 25 | 1.36 | 0.5 | -1.1% |
| MVV | ProShares Ultra MidCap400 | | 61.44 | 17 | 2.47 | 0.02 | 6.13% |
| MZZ | ProShares UltraShort MidCap400 | | 11.80 | 53 | -1.34 | 1.03 | -6.13% |
| XMLV | PowerShares S&P MidCap Low Volatil ETF | | 55.20 | 40 | 0.91 | 1.01 | 3.8% |
| UMDD | ProShares UltraPro MidCap400 | | 23.87 | 10 | 3.14 | -0.38 | 6.94% |
| SMDD | ProShares UltraPro Short MidCap400 | | 11.78 | 78 | -3.32 | -0.42 | -12.51% |
| MYY | ProShares Short MidCap400 | | 20.89 | 70 | -0.54 | 0.49 | -2.63% |
| 12Stocks.com: Charts, Trends, Fundamental Data and Performances of MidCap Stocks | |
|
We now take in-depth look at all MidCap stocks including charts, multi-period performances and overall trends (as measured by Smart Investing & Trading Score). One can sort MidCap stocks (click link to choose) by Daily, Weekly and by Year-to-Date performances. Also, one can sort by size of the company or by market capitalization. |
| Select Your Default Chart Type: | |||||
| |||||
| Click on stock symbol or name for detailed view. Click on to add stock symbol to your watchlist and to view watchlist. Quick View: Move mouse or cursor over "Daily" to quickly view daily technical stock chart and over "Weekly" to view weekly technical stock chart. | |||||

 | CUBE CubeSmart |
| Sector: Financials | |
| SubSector: REIT - Industrial | |
| MarketCap: 4562.99 Millions | |
| Recent Price: 41.51 Smart Investing & Trading Score: 25 | |
| Day Percent Change: 1.74% Day Change: 0.71 | |
| Week Change: 1.84% Year-to-date Change: -10.4% | |
| CUBE Links: Profile News Message Board | |
| Charts:- Daily , Weekly | |
| Add CUBE to Watchlist: View: Get Complete CUBE Trend Analysis ➞ | |
 | LNC Lincoln National Corporation |
| Sector: Financials | |
| SubSector: Life Insurance | |
| MarketCap: 4545.26 Millions | |
| Recent Price: 26.84 Smart Investing & Trading Score: 5 | |
| Day Percent Change: -3.07% Day Change: -0.85 | |
| Week Change: -3.49% Year-to-date Change: -0.5% | |
| LNC Links: Profile News Message Board | |
| Charts:- Daily , Weekly | |
| Add LNC to Watchlist: View: Get Complete LNC Trend Analysis ➞ | |
 | TFSL TFS Financial Corporation |
| Sector: Financials | |
| SubSector: Regional - Midwest Banks | |
| MarketCap: 4539.1 Millions | |
| Recent Price: 12.98 Smart Investing & Trading Score: 100 | |
| Day Percent Change: 2.20% Day Change: 0.28 | |
| Week Change: 6.39% Year-to-date Change: -11.6% | |
| TFSL Links: Profile News Message Board | |
| Charts:- Daily , Weekly | |
| Add TFSL to Watchlist: View: Get Complete TFSL Trend Analysis ➞ | |
 | CMA Comerica Incorporated |
| Sector: Financials | |
| SubSector: Money Center Banks | |
| MarketCap: 4449.49 Millions | |
| Recent Price: 51.59 Smart Investing & Trading Score: 68 | |
| Day Percent Change: 0.74% Day Change: 0.38 | |
| Week Change: -0.92% Year-to-date Change: -7.6% | |
| CMA Links: Profile News Message Board | |
| Charts:- Daily , Weekly | |
| Add CMA to Watchlist: View: Get Complete CMA Trend Analysis ➞ | |
 | RGA Reinsurance Group of America, Incorporated |
| Sector: Financials | |
| SubSector: Life Insurance | |
| MarketCap: 4423.36 Millions | |
| Recent Price: 192.19 Smart Investing & Trading Score: 85 | |
| Day Percent Change: 0.66% Day Change: 1.27 | |
| Week Change: 1.8% Year-to-date Change: 18.8% | |
| RGA Links: Profile News Message Board | |
| Charts:- Daily , Weekly | |
| Add RGA to Watchlist: View: Get Complete RGA Trend Analysis ➞ | |
 | ORI Old Republic International Corporation |
| Sector: Financials | |
| SubSector: Property & Casualty Insurance | |
| MarketCap: 4420.92 Millions | |
| Recent Price: 30.69 Smart Investing & Trading Score: 90 | |
| Day Percent Change: 1.35% Day Change: 0.41 | |
| Week Change: 1.86% Year-to-date Change: 4.4% | |
| ORI Links: Profile News Message Board | |
| Charts:- Daily , Weekly | |
| Add ORI to Watchlist: View: Get Complete ORI Trend Analysis ➞ | |
 | VIRT Virtu Financial, Inc. |
| Sector: Financials | |
| SubSector: Investment Brokerage - National | |
| MarketCap: 4305.15 Millions | |
| Recent Price: 22.02 Smart Investing & Trading Score: 85 | |
| Day Percent Change: 0.16% Day Change: 0.04 | |
| Week Change: 0.02% Year-to-date Change: 8.7% | |
| VIRT Links: Profile News Message Board | |
| Charts:- Daily , Weekly | |
| Add VIRT to Watchlist: View: Get Complete VIRT Trend Analysis ➞ | |
 | REXR Rexford Industrial Realty, Inc. |
| Sector: Financials | |
| SubSector: REIT - Industrial | |
| MarketCap: 4185.99 Millions | |
| Recent Price: 43.55 Smart Investing & Trading Score: 20 | |
| Day Percent Change: 2.74% Day Change: 1.16 | |
| Week Change: 0.81% Year-to-date Change: -22.4% | |
| REXR Links: Profile News Message Board | |
| Charts:- Daily , Weekly | |
| Add REXR to Watchlist: View: Get Complete REXR Trend Analysis ➞ | |
 | FAF First American Financial Corporation |
| Sector: Financials | |
| SubSector: Property & Casualty Insurance | |
| MarketCap: 4163.82 Millions | |
| Recent Price: 54.11 Smart Investing & Trading Score: 10 | |
| Day Percent Change: 1.69% Day Change: 0.90 | |
| Week Change: -0.2% Year-to-date Change: -16.0% | |
| FAF Links: Profile News Message Board | |
| Charts:- Daily , Weekly | |
| Add FAF to Watchlist: View: Get Complete FAF Trend Analysis ➞ | |
 | LPLA LPL Financial Holdings Inc. |
| Sector: Financials | |
| SubSector: Investment Brokerage - National | |
| MarketCap: 4104.65 Millions | |
| Recent Price: 269.65 Smart Investing & Trading Score: 78 | |
| Day Percent Change: 1.57% Day Change: 4.16 | |
| Week Change: 1.25% Year-to-date Change: 18.5% | |
| LPLA Links: Profile News Message Board | |
| Charts:- Daily , Weekly | |
| Add LPLA to Watchlist: View: Get Complete LPLA Trend Analysis ➞ | |
 | KMPR Kemper Corporation |
| Sector: Financials | |
| SubSector: Property & Casualty Insurance | |
| MarketCap: 4035.12 Millions | |
| Recent Price: 57.49 Smart Investing & Trading Score: 8 | |
| Day Percent Change: -1.71% Day Change: -1.00 | |
| Week Change: 0.1% Year-to-date Change: 18.1% | |
| KMPR Links: Profile News Message Board | |
| Charts:- Daily , Weekly | |
| Add KMPR to Watchlist: View: Get Complete KMPR Trend Analysis ➞ | |
 | EGP EastGroup Properties, Inc. |
| Sector: Financials | |
| SubSector: REIT - Industrial | |
| MarketCap: 4034.29 Millions | |
| Recent Price: 159.12 Smart Investing & Trading Score: 25 | |
| Day Percent Change: 1.44% Day Change: 2.26 | |
| Week Change: 2.05% Year-to-date Change: -13.3% | |
| EGP Links: Profile News Message Board | |
| Charts:- Daily , Weekly | |
| Add EGP to Watchlist: View: Get Complete EGP Trend Analysis ➞ | |
 | JEF Jefferies Financial Group Inc. |
| Sector: Financials | |
| SubSector: Investment Brokerage - Regional | |
| MarketCap: 3987.15 Millions | |
| Recent Price: 44.04 Smart Investing & Trading Score: 51 | |
| Day Percent Change: 1.90% Day Change: 0.82 | |
| Week Change: 1.1% Year-to-date Change: 9.0% | |
| JEF Links: Profile News Message Board | |
| Charts:- Daily , Weekly | |
| Add JEF to Watchlist: View: Get Complete JEF Trend Analysis ➞ | |
 | FR First Industrial Realty Trust, Inc. |
| Sector: Financials | |
| SubSector: REIT - Industrial | |
| MarketCap: 3883.39 Millions | |
| Recent Price: 46.87 Smart Investing & Trading Score: 32 | |
| Day Percent Change: 1.85% Day Change: 0.85 | |
| Week Change: 1.89% Year-to-date Change: -11.0% | |
| FR Links: Profile News Message Board | |
| Charts:- Daily , Weekly | |
| Add FR to Watchlist: View: Get Complete FR Trend Analysis ➞ | |
 | CUZ Cousins Properties Incorporated |
| Sector: Financials | |
| SubSector: REIT - Diversified | |
| MarketCap: 3828.13 Millions | |
| Recent Price: 23.61 Smart Investing & Trading Score: 86 | |
| Day Percent Change: 3.01% Day Change: 0.69 | |
| Week Change: 3.28% Year-to-date Change: -3.0% | |
| CUZ Links: Profile News Message Board | |
| Charts:- Daily , Weekly | |
| Add CUZ to Watchlist: View: Get Complete CUZ Trend Analysis ➞ | |
 | STAG STAG Industrial, Inc. |
| Sector: Financials | |
| SubSector: REIT - Industrial | |
| MarketCap: 3767.49 Millions | |
| Recent Price: 35.26 Smart Investing & Trading Score: 25 | |
| Day Percent Change: 1.28% Day Change: 0.45 | |
| Week Change: 2.25% Year-to-date Change: -10.2% | |
| STAG Links: Profile News Message Board | |
| Charts:- Daily , Weekly | |
| Add STAG to Watchlist: View: Get Complete STAG Trend Analysis ➞ | |
 | HR Healthcare Realty Trust Incorporated |
| Sector: Financials | |
| SubSector: REIT - Healthcare Facilities | |
| MarketCap: 3718.84 Millions | |
| Recent Price: 14.71 Smart Investing & Trading Score: 100 | |
| Day Percent Change: 1.34% Day Change: 0.20 | |
| Week Change: 4% Year-to-date Change: -14.7% | |
| HR Links: Profile News Message Board | |
| Charts:- Daily , Weekly | |
| Add HR to Watchlist: View: Get Complete HR Trend Analysis ➞ | |
 | AXS AXIS Capital Holdings Limited |
| Sector: Financials | |
| SubSector: Property & Casualty Insurance | |
| MarketCap: 3709.12 Millions | |
| Recent Price: 65.20 Smart Investing & Trading Score: 100 | |
| Day Percent Change: 5.26% Day Change: 3.26 | |
| Week Change: 7.52% Year-to-date Change: 17.8% | |
| AXS Links: Profile News Message Board | |
| Charts:- Daily , Weekly | |
| Add AXS to Watchlist: View: Get Complete AXS Trend Analysis ➞ | |
 | THG The Hanover Insurance Group, Inc. |
| Sector: Financials | |
| SubSector: Property & Casualty Insurance | |
| MarketCap: 3677.92 Millions | |
| Recent Price: 129.00 Smart Investing & Trading Score: 100 | |
| Day Percent Change: -1.64% Day Change: -2.15 | |
| Week Change: -0.46% Year-to-date Change: 6.2% | |
| THG Links: Profile News Message Board | |
| Charts:- Daily , Weekly | |
| Add THG to Watchlist: View: Get Complete THG Trend Analysis ➞ | |
 | BRX Brixmor Property Group Inc. |
| Sector: Financials | |
| SubSector: REIT - Retail | |
| MarketCap: 3561.54 Millions | |
| Recent Price: 22.60 Smart Investing & Trading Score: 70 | |
| Day Percent Change: 1.85% Day Change: 0.41 | |
| Week Change: 4.05% Year-to-date Change: -2.9% | |
| BRX Links: Profile News Message Board | |
| Charts:- Daily , Weekly | |
| Add BRX to Watchlist: View: Get Complete BRX Trend Analysis ➞ | |
 | CFR Cullen/Frost Bankers, Inc. |
| Sector: Financials | |
| SubSector: Regional - Southwest Banks | |
| MarketCap: 3536.75 Millions | |
| Recent Price: 106.47 Smart Investing & Trading Score: 35 | |
| Day Percent Change: 1.13% Day Change: 1.18 | |
| Week Change: -0.56% Year-to-date Change: -1.9% | |
| CFR Links: Profile News Message Board | |
| Charts:- Daily , Weekly | |
| Add CFR to Watchlist: View: Get Complete CFR Trend Analysis ➞ | |
 | RLI RLI Corp. |
| Sector: Financials | |
| SubSector: Property & Casualty Insurance | |
| MarketCap: 3534.92 Millions | |
| Recent Price: 143.17 Smart Investing & Trading Score: 37 | |
| Day Percent Change: -0.06% Day Change: -0.08 | |
| Week Change: -0.68% Year-to-date Change: 7.6% | |
| RLI Links: Profile News Message Board | |
| Charts:- Daily , Weekly | |
| Add RLI to Watchlist: View: Get Complete RLI Trend Analysis ➞ | |
 | STWD Starwood Property Trust, Inc. |
| Sector: Financials | |
| SubSector: Mortgage Investment | |
| MarketCap: 3447.09 Millions | |
| Recent Price: 19.34 Smart Investing & Trading Score: 28 | |
| Day Percent Change: 1.18% Day Change: 0.22 | |
| Week Change: -0.79% Year-to-date Change: -8.0% | |
| STWD Links: Profile News Message Board | |
| Charts:- Daily , Weekly | |
| Add STWD to Watchlist: View: Get Complete STWD Trend Analysis ➞ | |
 | HLI Houlihan Lokey, Inc. |
| Sector: Financials | |
| SubSector: Investment Brokerage - National | |
| MarketCap: 3352.65 Millions | |
| Recent Price: 130.34 Smart Investing & Trading Score: 90 | |
| Day Percent Change: 2.36% Day Change: 3.00 | |
| Week Change: 2.87% Year-to-date Change: 8.7% | |
| HLI Links: Profile News Message Board | |
| Charts:- Daily , Weekly | |
| Add HLI to Watchlist: View: Get Complete HLI Trend Analysis ➞ | |
 | HIW Highwoods Properties, Inc. |
| Sector: Financials | |
| SubSector: REIT - Office | |
| MarketCap: 3227.46 Millions | |
| Recent Price: 26.68 Smart Investing & Trading Score: 81 | |
| Day Percent Change: 3.05% Day Change: 0.79 | |
| Week Change: 3.89% Year-to-date Change: 16.2% | |
| HIW Links: Profile News Message Board | |
| Charts:- Daily , Weekly | |
| Add HIW to Watchlist: View: Get Complete HIW Trend Analysis ➞ | |
| For tabular summary view of above stock list: Summary View ➞ 0 - 25 , 25 - 50 , 50 - 75 , 75 - 100 , 100 - 125 , 125 - 150 , 150 - 175 | ||
| Click To Change The Sort Order: By Market Cap or Company Size Performance: Year-to-date, Week and Day | |
| Select Chart Type: | ||
|
Best Stocks Today 12Stocks.com |
© 2024 12Stocks.com Terms & Conditions Privacy Contact Us
All Information Provided Only For Education And Not To Be Used For Investing or Trading. See Terms & Conditions


One More Thing ... Get Best Stocks Delivered Daily!
Never Ever Miss A Move With Our Top Ten Stocks Lists
Find Best Stocks In Any Market - Bull or Bear Market
Take A Peek At Our Top Ten Stocks Lists: Daily, Weekly, Year-to-Date & Top Trends
Find Best Stocks In Any Market - Bull or Bear Market
Take A Peek At Our Top Ten Stocks Lists: Daily, Weekly, Year-to-Date & Top Trends
Midcap Stocks With Best Up Trends [0-bearish to 100-bullish]: Avis Budget[100], Valmont Industries[100], C.H. Robinson[100], BorgWarner [100], Kellogg [100], WestRock [100], WESCO [100], Cognex [100], Ventas [100], Markel [100], AXIS Capital[100]
Best Midcap Stocks Year-to-Date:
Vistra Energy[108.71%], AppLovin [80.75%], ShockWave Medical[73.42%], EMCOR [65.11%], Constellation Energy[58.62%], CAVA [56.54%], Spotify [56.04%], Tenet [55.64%], Natera [50.06%], Wingstop [49.11%], NRG Energy[46.13%] Best Midcap Stocks This Week:
Olaplex [24.63%], Tenet [22.36%], Bio-Techne [19%], C.H. Robinson[18.31%], Pinterest [18.26%], Garmin [15.3%], Avis Budget[15.25%], Hertz Global[14.82%], Valmont Industries[14.48%], Brookfield Renewable[14.24%], Wayfair [13.67%] Best Midcap Stocks Daily:
Avis Budget[22.54%], Olaplex [19.29%], Wayfair [17.00%], Valmont Industries[15.74%], C.H. Robinson[15.24%], Hertz Global[13.53%], Aptiv [12.37%], GameStop [11.87%], NovoCure [10.68%], Coinbase Global[10.36%], IAC/InterActiveCorp [9.97%]