
 Login Sign Up


| |||||
 |  | ||||

| 12Stocks.com Market Intelligence |
Best Latin America Stocks
|
|
| Quick Read: Top Latin America Stocks By Performances & Trends: Daily, Weekly, Year-to-Date, Market Cap (Size) & Technical Trends | |||
| Best Latin America Views: Quick Browse View, Summary & Slide Show | |||
| 12Stocks.com Latin America Stocks Performances & Trends Daily | |||||||||
|
|  The overall market intelligence score is 80 (0-bearish to 100-bullish) which puts Latin America index in short term neutral to bullish trend. The market intelligence score from previous trading session is 70 and hence an improvement of trend.
| ||||||||
| Here are the market intelligence trend scores of the most requested Latin America stocks at 12Stocks.com (click stock name for detailed review): | |
| Scroll down this page for most comprehensive review of Latin America stocks by performance, trends, technical analysis, charts, fund plays & more | |


| 12Stocks.com: Top Performing Latin America Index Stocks | ||||||||||||||||||||||||||||||||||||||||||||||||
 The top performing Latin America Index stocks year to date are
Now, more recently, over last week, the top performing Latin America Index stocks on the move are


|
||||||||||||||||||||||||||||||||||||||||||||||||
| 12Stocks.com: Investing in Latin America Index with Stocks | |
|
The following table helps investors and traders sort through current performance and trends (as measured by market intelligence score) of various
stocks in the Latin America Index. Quick View: Move mouse or cursor over stock symbol (ticker) to view short-term technical chart and over stock name to view long term chart. Click on  to add stock symbol to your watchlist and to add stock symbol to your watchlist and  to view watchlist. Click on any ticker or stock name for detailed market intelligence report for that stock. to view watchlist. Click on any ticker or stock name for detailed market intelligence report for that stock. |
12Stocks.com Performance of Stocks in Latin America Index
| Ticker | Stock Name | Watchlist | Category | Recent Price | Market Intelligence Score | Change % | Weekly Change% |
| ZYME | Zymeworks |   | Health Care | 14.81 | 40 | 0.49% | 0.63% |
| NFGC | New Found | | Materials | 1.95 | 70 | 3.25% | 0.63% |
| TRP | TC Energy | | Energy | 52.06 | 50 | -0.67% | 0.59% |
| XENE | Xenon | | Health Care | 38.71 | 80 | 1.43% | 0.58% |
| CVE | Cenovus Energy | | Energy | 16.61 | 60 | 1.54% | 0.53% |
| VLRS | Controladora Vuela | | Transports | 6.16 | 70 | -1.51% | 0.51% |
| ABEV | Ambev S.A | | Consumer Staples | 2.24 | 40 | 0.00% | 0.46% |
| TV | Grupo Televisa | | Services & Goods | 2.79 | 100 | -0.42% | 0.43% |
| CIGI | Colliers | | Financials | 165.35 | 80 | 0.02% | 0.39% |
| UGP | Ultrapar Participacoes | | Energy | 3.65 | 70 | -0.30% | 0.31% |
| PSLV | Sprott Physical | | Financials | 13.48 | 80 | 0.70% | 0.31% |
| BUR | Burcon Nutrascience | | Health Care | 14.00 | 0 | -1.59% | 0.15% |
| SU | Suncor Energy | | Energy | 41.30 | 60 | 1.14% | 0.13% |
| TGS | Transportadora de | | Utilities | 27.16 | 10 | 3.27% | 0.11% |
| FTS | Fortis | | Utilities | 49.74 | 50 | -0.16% | 0.08% |
| WPM | Wheaton Precious | | Materials | 100.42 | 100 | 1.19% | 0.07% |
| OR | Osisko Gold | | Materials | 32.16 | 100 | 1.46% | 0.07% |
| PHYS | Sprott Physical | | Financials | 26.52 | 100 | -0.31% | 0.00% |
| EPIX | ESSA Pharma | | Health Care | 0.24 | 0 | -0.52% | 0.00% |
| BNS | Bank of Nova Scotia | | Financials | 62.46 | 100 | -0.18% | -0.05% |
| AUPH | Aurinia | | Health Care | 11.99 | 100 | 0.58% | -0.08% |
| CEF | Sprott Physical | | Financials | 32.23 | 80 | -0.06% | -0.13% |
| BHC | Bausch Health | | Health Care | 7.42 | 50 | -1.06% | -0.13% |
| CIO | City Office | | Financials | 6.93 | 80 | 0.00% | -0.14% |
| PBR | Petroleo Brasileiro | | Energy | 12.38 | 60 | 0.57% | -0.16% |
| To view more stocks, click on Next / Previous arrows or select different range: 0 - 25 , 25 - 50 , 50 - 75 , 75 - 100 , 100 - 125 , 125 - 150 , 150 - 175 , 175 - 200 , 200 - 225 | ||
 | Click To Change The Sort Order: By Market Cap or Company Size Performance: Year-to-date, Week and Day |  |
| Detailed Overview Of Latin America Stocks |
| Latin America Technical Overview, Leaders & Laggards, Top Latin America ETF Funds & Detailed Latin America Stocks List, Charts, Trends & More |
| Latin America: Technical Analysis, Trends & YTD Performance | |
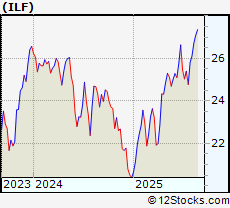
 ILF Weekly Chart |
|
| Long Term Trend: Very Good | |
| Medium Term Trend: Very Good | |
 ILF Daily Chart |
|
| Short Term Trend: Very Good | |
| Overall Trend Score: 80 | |
| YTD Performance: 21.12% | |
| **Trend Scores & Views Are Only For Educational Purposes And Not For Investing | |
| 12Stocks.com: Investing in Latin America Index using Exchange Traded Funds | |
|
The following table shows list of key exchange traded funds (ETF) that
help investors play Latin America stock market. For detailed view, check out our ETF Funds section of our website. Quick View: Move mouse or cursor over ETF symbol (ticker) to view short-term technical chart and over ETF name to view long term chart. Click on ticker or stock name for detailed view. Click on to add stock symbol to your watchlist and to view watchlist. |
12Stocks.com List of ETFs that track Latin America Index
| Ticker | ETF Name | Watchlist | Recent Price | Market Intelligence Score | Change % | Week % | Year-to-date % |
| ILF | Latin America 40 | | 27.17 | 80 | 0.67 | 0.26 | 21.12% |
| EWC | Canada | | 48.79 | 100 | 1.57 | 1.59 | 17.28% |
| FLN | Latin America AlphaDEX | | 20.48 | 100 | 0.31 | -0.55 | 33.28% |
| EWZ | Brazil | | 29.50 | 70 | 3.33 | 1.35 | 14.93% |
| EWW | Mexico | | 61.94 | 100 | 2 | 2.35 | 30.49% |
| ARGT | Argentina | | 80.15 | 30 | 0.48 | -2.82 | -1.29% |
| EWZS | Brazil Small-Cap | | 13.40 | 90 | -0.6 | -2.06 | 35.19% |
| BRF | Brazil Small-Cap | | 15.65 | 90 | -0.22 | -2.19 | 32.59% |
| BZQ | Short Brazil | | 10.00 | 30 | -0.06 | 1.69 | -39.37% |
| BRZU | Brazil Bull 3X | | 67.10 | 80 | -0.12 | -1.98 | 45.21% |
| 12Stocks.com: Charts, Trends, Fundamental Data and Performances of Latin America Stocks | |
|
We now take in-depth look at all Latin America stocks including charts, multi-period performances and overall trends (as measured by market intelligence score). One can sort Latin America stocks (click link to choose) by Daily, Weekly and by Year-to-Date performances. Also, one can sort by size of the company or by market capitalization. |
| Select Your Default Chart Type: | |||||
| |||||
| Click on stock symbol or name for detailed view. Click on to add stock symbol to your watchlist and to view watchlist. Quick View: Move mouse or cursor over "Daily" to quickly view daily technical stock chart and over "Weekly" to view weekly technical stock chart. | |||||

 | ZYME Zymeworks Inc. |
| Sector: Health Care | |
| SubSector: Biotechnology | |
| MarketCap: 1373.55 Millions | |
| Recent Price: 14.81 Market Intelligence Score: 40 | |
| Day Percent Change: 0.49% Day Change: 0.07 | |
| Week Change: 0.63% Year-to-date Change: -1.7% | |
| ZYME Links: Profile News Message Board | |
| Charts:- Daily , Weekly | |
| Add ZYME to Watchlist: View: Get Complete ZYME Trend Analysis ➞ | |
 | NFGC New Found Gold Corp. |
| Sector: Materials | |
| SubSector: Gold | |
| MarketCap: 868 Millions | |
| Recent Price: 1.95 Market Intelligence Score: 70 | |
| Day Percent Change: 3.25% Day Change: 0.05 | |
| Week Change: 0.63% Year-to-date Change: -12.6% | |
| NFGC Links: Profile News Message Board | |
| Charts:- Daily , Weekly | |
| Add NFGC to Watchlist: View: Get Complete NFGC Trend Analysis ➞ | |
 | TRP TC Energy Corporation |
| Sector: Energy | |
| SubSector: Oil & Gas Pipelines | |
| MarketCap: 44071.1 Millions | |
| Recent Price: 52.06 Market Intelligence Score: 50 | |
| Day Percent Change: -0.67% Day Change: -0.35 | |
| Week Change: 0.59% Year-to-date Change: 13.5% | |
| TRP Links: Profile News Message Board | |
| Charts:- Daily , Weekly | |
| Add TRP to Watchlist: View: Get Complete TRP Trend Analysis ➞ | |
 | XENE Xenon Pharmaceuticals Inc. |
| Sector: Health Care | |
| SubSector: Biotechnology | |
| MarketCap: 388.585 Millions | |
| Recent Price: 38.71 Market Intelligence Score: 80 | |
| Day Percent Change: 1.43% Day Change: 0.54 | |
| Week Change: 0.58% Year-to-date Change: -2.6% | |
| XENE Links: Profile News Message Board | |
| Charts:- Daily , Weekly | |
| Add XENE to Watchlist: View: Get Complete XENE Trend Analysis ➞ | |
 | CVE Cenovus Energy Inc. |
| Sector: Energy | |
| SubSector: Oil & Gas Drilling & Exploration | |
| MarketCap: 2369.29 Millions | |
| Recent Price: 16.61 Market Intelligence Score: 60 | |
| Day Percent Change: 1.54% Day Change: 0.23 | |
| Week Change: 0.53% Year-to-date Change: 2.4% | |
| CVE Links: Profile News Message Board | |
| Charts:- Daily , Weekly | |
| Add CVE to Watchlist: View: Get Complete CVE Trend Analysis ➞ | |
 | VLRS Controladora Vuela Compania de Aviacion, S.A.B. de C.V. |
| Sector: Transports | |
| SubSector: Major Airlines | |
| MarketCap: 382 Millions | |
| Recent Price: 6.16 Market Intelligence Score: 70 | |
| Day Percent Change: -1.51% Day Change: -0.09 | |
| Week Change: 0.51% Year-to-date Change: -21.1% | |
| VLRS Links: Profile News Message Board | |
| Charts:- Daily , Weekly | |
| Add VLRS to Watchlist: View: Get Complete VLRS Trend Analysis ➞ | |
 | ABEV Ambev S.A. |
| Sector: Consumer Staples | |
| SubSector: Beverages - Brewers | |
| MarketCap: 37753.5 Millions | |
| Recent Price: 2.24 Market Intelligence Score: 40 | |
| Day Percent Change: 0% Day Change: 0 | |
| Week Change: 0.46% Year-to-date Change: 21.9% | |
| ABEV Links: Profile News Message Board | |
| Charts:- Daily , Weekly | |
| Add ABEV to Watchlist: View: Get Complete ABEV Trend Analysis ➞ | |
 | TV Grupo Televisa, S.A.B. |
| Sector: Services & Goods | |
| SubSector: Broadcasting - TV | |
| MarketCap: 3740.43 Millions | |
| Recent Price: 2.79 Market Intelligence Score: 100 | |
| Day Percent Change: -0.42% Day Change: -0.01 | |
| Week Change: 0.43% Year-to-date Change: 47.2% | |
| TV Links: Profile News Message Board | |
| Charts:- Daily , Weekly | |
| Add TV to Watchlist: View: Get Complete TV Trend Analysis ➞ | |
 | CIGI Colliers International Group Inc. |
| Sector: Financials | |
| SubSector: Property Management | |
| MarketCap: 1928.42 Millions | |
| Recent Price: 165.35 Market Intelligence Score: 80 | |
| Day Percent Change: 0.02% Day Change: 0.03 | |
| Week Change: 0.39% Year-to-date Change: 19.8% | |
| CIGI Links: Profile News Message Board | |
| Charts:- Daily , Weekly | |
| Add CIGI to Watchlist: View: Get Complete CIGI Trend Analysis ➞ | |
 | UGP Ultrapar Participacoes S.A. |
| Sector: Energy | |
| SubSector: Oil & Gas Refining & Marketing | |
| MarketCap: 3473.54 Millions | |
| Recent Price: 3.65 Market Intelligence Score: 70 | |
| Day Percent Change: -0.3% Day Change: -0.01 | |
| Week Change: 0.31% Year-to-date Change: 28.2% | |
| UGP Links: Profile News Message Board | |
| Charts:- Daily , Weekly | |
| Add UGP to Watchlist: View: Get Complete UGP Trend Analysis ➞ | |
 | PSLV Sprott Physical Silver Trust |
| Sector: Financials | |
| SubSector: Exchange Traded Fund | |
| MarketCap: 765.851 Millions | |
| Recent Price: 13.48 Market Intelligence Score: 80 | |
| Day Percent Change: 0.7% Day Change: 0.09 | |
| Week Change: 0.31% Year-to-date Change: 34.0% | |
| PSLV Links: Profile News Message Board | |
| Charts:- Daily , Weekly | |
| Add PSLV to Watchlist: View: Get Complete PSLV Trend Analysis ➞ | |
 | BUR Burcon Nutrascience Corporation |
| Sector: Health Care | |
| SubSector: Biotechnology | |
| MarketCap: 0 Millions | |
| Recent Price: 14.00 Market Intelligence Score: 0 | |
| Day Percent Change: -1.59% Day Change: -0.22 | |
| Week Change: 0.15% Year-to-date Change: 7.2% | |
| BUR Links: Profile News Message Board | |
| Charts:- Daily , Weekly | |
| Add BUR to Watchlist: View: Get Complete BUR Trend Analysis ➞ | |
 | SU Suncor Energy Inc. |
| Sector: Energy | |
| SubSector: Independent Oil & Gas | |
| MarketCap: 21550.6 Millions | |
| Recent Price: 41.30 Market Intelligence Score: 60 | |
| Day Percent Change: 1.14% Day Change: 0.44 | |
| Week Change: 0.13% Year-to-date Change: 11.9% | |
| SU Links: Profile News Message Board | |
| Charts:- Daily , Weekly | |
| Add SU to Watchlist: View: Get Complete SU Trend Analysis ➞ | |
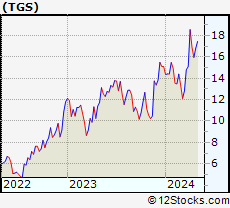 | TGS Transportadora de Gas del Sur S.A. |
| Sector: Utilities | |
| SubSector: Gas Utilities | |
| MarketCap: 514.177 Millions | |
| Recent Price: 27.16 Market Intelligence Score: 10 | |
| Day Percent Change: 3.27% Day Change: 0.89 | |
| Week Change: 0.11% Year-to-date Change: -3.9% | |
| TGS Links: Profile News Message Board | |
| Charts:- Daily , Weekly | |
| Add TGS to Watchlist: View: Get Complete TGS Trend Analysis ➞ | |
 | FTS Fortis Inc. |
| Sector: Utilities | |
| SubSector: Electric Utilities | |
| MarketCap: 14741.8 Millions | |
| Recent Price: 49.74 Market Intelligence Score: 50 | |
| Day Percent Change: -0.16% Day Change: -0.08 | |
| Week Change: 0.08% Year-to-date Change: 24.5% | |
| FTS Links: Profile News Message Board | |
| Charts:- Daily , Weekly | |
| Add FTS to Watchlist: View: Get Complete FTS Trend Analysis ➞ | |
 | WPM Wheaton Precious Metals Corp. |
| Sector: Materials | |
| SubSector: Silver | |
| MarketCap: 11349.6 Millions | |
| Recent Price: 100.42 Market Intelligence Score: 100 | |
| Day Percent Change: 1.19% Day Change: 1.11 | |
| Week Change: 0.07% Year-to-date Change: 68.5% | |
| WPM Links: Profile News Message Board | |
| Charts:- Daily , Weekly | |
| Add WPM to Watchlist: View: Get Complete WPM Trend Analysis ➞ | |
 | OR Osisko Gold Royalties Ltd |
| Sector: Materials | |
| SubSector: Gold | |
| MarketCap: 1025.99 Millions | |
| Recent Price: 32.16 Market Intelligence Score: 100 | |
| Day Percent Change: 1.46% Day Change: 0.44 | |
| Week Change: 0.07% Year-to-date Change: 70.1% | |
| OR Links: Profile News Message Board | |
| Charts:- Daily , Weekly | |
| Add OR to Watchlist: View: Get Complete OR Trend Analysis ➞ | |
 | PHYS Sprott Physical Gold Trust |
| Sector: Financials | |
| SubSector: Exchange Traded Fund | |
| MarketCap: 2365.21 Millions | |
| Recent Price: 26.52 Market Intelligence Score: 100 | |
| Day Percent Change: -0.31% Day Change: -0.08 | |
| Week Change: 0% Year-to-date Change: 27.2% | |
| PHYS Links: Profile News Message Board | |
| Charts:- Daily , Weekly | |
| Add PHYS to Watchlist: View: Get Complete PHYS Trend Analysis ➞ | |
 | EPIX ESSA Pharma Inc. |
| Sector: Health Care | |
| SubSector: Biotechnology | |
| MarketCap: 70.5785 Millions | |
| Recent Price: 0.24 Market Intelligence Score: 0 | |
| Day Percent Change: -0.52% Day Change: -0.01 | |
| Week Change: 0% Year-to-date Change: 7.3% | |
| EPIX Links: Profile News Message Board | |
| Charts:- Daily , Weekly | |
| Add EPIX to Watchlist: View: Get Complete EPIX Trend Analysis ➞ | |
 | BNS The Bank of Nova Scotia |
| Sector: Financials | |
| SubSector: Money Center Banks | |
| MarketCap: 48742.1 Millions | |
| Recent Price: 62.46 Market Intelligence Score: 100 | |
| Day Percent Change: -0.18% Day Change: -0.1 | |
| Week Change: -0.05% Year-to-date Change: 10.2% | |
| BNS Links: Profile News Message Board | |
| Charts:- Daily , Weekly | |
| Add BNS to Watchlist: View: Get Complete BNS Trend Analysis ➞ | |
 | AUPH Aurinia Pharmaceuticals Inc. |
| Sector: Health Care | |
| SubSector: Biotechnology | |
| MarketCap: 1319.75 Millions | |
| Recent Price: 11.99 Market Intelligence Score: 100 | |
| Day Percent Change: 0.58% Day Change: 0.07 | |
| Week Change: -0.08% Year-to-date Change: 34.5% | |
| AUPH Links: Profile News Message Board | |
| Charts:- Daily , Weekly | |
| Add AUPH to Watchlist: View: Get Complete AUPH Trend Analysis ➞ | |
 | CEF Sprott Physical Gold and Silver Trust |
| Sector: Financials | |
| SubSector: Asset Management | |
| MarketCap: 2485.33 Millions | |
| Recent Price: 32.23 Market Intelligence Score: 80 | |
| Day Percent Change: -0.06% Day Change: -0.02 | |
| Week Change: -0.13% Year-to-date Change: 30.2% | |
| CEF Links: Profile News Message Board | |
| Charts:- Daily , Weekly | |
| Add CEF to Watchlist: View: Get Complete CEF Trend Analysis ➞ | |
 | BHC Bausch Health Companies Inc. |
| Sector: Health Care | |
| SubSector: Drug Delivery | |
| MarketCap: 5485.3 Millions | |
| Recent Price: 7.42 Market Intelligence Score: 50 | |
| Day Percent Change: -1.06% Day Change: -0.08 | |
| Week Change: -0.13% Year-to-date Change: -7.0% | |
| BHC Links: Profile News Message Board | |
| Charts:- Daily , Weekly | |
| Add BHC to Watchlist: View: Get Complete BHC Trend Analysis ➞ | |
 | CIO City Office REIT, Inc. |
| Sector: Financials | |
| SubSector: REIT - Office | |
| MarketCap: 478.566 Millions | |
| Recent Price: 6.93 Market Intelligence Score: 80 | |
| Day Percent Change: 0% Day Change: 0 | |
| Week Change: -0.14% Year-to-date Change: 33.2% | |
| CIO Links: Profile News Message Board | |
| Charts:- Daily , Weekly | |
| Add CIO to Watchlist: View: Get Complete CIO Trend Analysis ➞ | |
 | PBR Petroleo Brasileiro S.A. - Petrobras |
| Sector: Energy | |
| SubSector: Oil & Gas Drilling & Exploration | |
| MarketCap: 38939.2 Millions | |
| Recent Price: 12.38 Market Intelligence Score: 60 | |
| Day Percent Change: 0.57% Day Change: 0.07 | |
| Week Change: -0.16% Year-to-date Change: -8.4% | |
| PBR Links: Profile News Message Board | |
| Charts:- Daily , Weekly | |
| Add PBR to Watchlist: View: Get Complete PBR Trend Analysis ➞ | |
| To view more stocks, click on Next / Previous arrows or select different range: 0 - 25 , 25 - 50 , 50 - 75 , 75 - 100 , 100 - 125 , 125 - 150 , 150 - 175 , 175 - 200 , 200 - 225 | ||
| Click To Change The Sort Order: By Market Cap or Company Size Performance: Year-to-date, Week and Day | |
| Select Chart Type: | ||
 Best Stocks Today 12Stocks.com |
© 2025 12Stocks.com Terms & Conditions Privacy Contact Us
All Information Provided Only For Education And Not To Be Used For Investing or Trading. See Terms & Conditions


One More Thing ... Get Best Stocks Delivered Daily!
Never Ever Miss A Move With Our Top Ten Stocks Lists
Find Best Stocks In Any Market - Bull or Bear Market
Take A Peek At Our Top Ten Stocks Lists: Daily, Weekly, Year-to-Date & Top Trends
Find Best Stocks In Any Market - Bull or Bear Market
Take A Peek At Our Top Ten Stocks Lists: Daily, Weekly, Year-to-Date & Top Trends
Latin America Stocks With Best Up Trends [0-bearish to 100-bullish]: IAMGOLD [100], New Gold[100], SSR Mining[100], Hudbay Minerals[100], Grupo Aeroportuario[100], TELUS [100], Baytex Energy[100], Franco-Nevada [100], CEMEX S.A.B.[100], Osisko Gold[100], Agnico Eagle[100]
Best Latin America Stocks Year-to-Date:
Dominion Diamond[207.43%], Gold Royalty[161.16%], SSR Mining[143.1%], New Gold[119.35%], Kinross Gold[111.46%], Vasta Platform[109.75%], Celestica [96.47%], Sandstorm Gold[95.03%], Inter & Co[86.91%], StoneCo [86.07%], NovaGold Resources[78.68%] Best Latin America Stocks This Week:
Dominion Diamond[33.17%], Nu [13.82%], Alamos Gold[9.37%], Novadaq [8%], New Gold[6.67%], Mercer [5.9%], BRF S.A[5.85%], Trilogy Metals[5.77%], IAMGOLD [5.75%], McEwen Mining[5.39%], SSR Mining[5.22%] Best Latin America Stocks Daily:
Dominion Diamond[28.83%], Bioceres Crop[8.89%], Gold Royalty[6.76%], Cronos [5.79%], Vision Marine[5.23%], Algoma Steel[5.05%], Alamos Gold[4.79%], Tilray [4.72%], Vox Royalty[4.72%], OrganiGram [4.67%], Braskem S.A[4.48%]