
 Login Sign Up


| |||||
 |  | ||||

| 12Stocks.com Market Intelligence |
Best Latin America Stocks
|
|
| Quick Read: Top Latin America Stocks By Performances & Trends: Daily, Weekly, Year-to-Date, Market Cap (Size) & Technical Trends | |||
| Best Latin America Views: Quick Browse View, Summary & Slide Show | |||
| 12Stocks.com Latin America Stocks Performances & Trends Daily | |||||||||
|
|  The overall market intelligence score is 10 (0-bearish to 100-bullish) which puts Latin America index in short term bearish trend. The market intelligence score from previous trading session is 32 and hence a deterioration of trend.
| ||||||||
| Here are the market intelligence trend scores of the most requested Latin America stocks at 12Stocks.com (click stock name for detailed review): | |
| Scroll down this page for most comprehensive review of Latin America stocks by performance, trends, technical analysis, charts, fund plays & more | |


| 12Stocks.com: Top Performing Latin America Index Stocks | ||||||||||||||||||||||||||||||||||||||||||||||||
 The top performing Latin America Index stocks year to date are
Now, more recently, over last week, the top performing Latin America Index stocks on the move are


|
||||||||||||||||||||||||||||||||||||||||||||||||
| 12Stocks.com: Investing in Latin America Index with Stocks | |
|
The following table helps investors and traders sort through current performance and trends (as measured by market intelligence score) of various
stocks in the Latin America Index. Quick View: Move mouse or cursor over stock symbol (ticker) to view short-term technical chart and over stock name to view long term chart. Click on  to add stock symbol to your watchlist and to add stock symbol to your watchlist and  to view watchlist. Click on any ticker or stock name for detailed market intelligence report for that stock. to view watchlist. Click on any ticker or stock name for detailed market intelligence report for that stock. |
12Stocks.com Performance of Stocks in Latin America Index
| Ticker | Stock Name | Watchlist | Category | Recent Price | Market Intelligence Score | Change % | Weekly Change% |
| CNQ | Canadian Natural |   | Energy | 76.61 | 46 | -0.40% | 0.07% |
| MGA | Magna | | Services & Goods | 48.37 | 25 | -1.71% | 0.06% |
| MELI | MercadoLibre | | Services & Goods | 1356.91 | 10 | -0.96% | 0.04% |
| NFGC | New Found | | Materials | 3.68 | 61 | -2.90% | 0.00% |
| VSTA | Vasta Platform | | Consumer Staples | 3.75 | 35 | -1.32% | 0.00% |
| SIM | Grupo Simec | | Materials | 31.00 | 40 | 0.00% | 0.00% |
| PDS | Precision Drilling | | Energy | 66.79 | 36 | -1.59% | -0.04% |
| NVEI | Nuvei | | Technology | 32.05 | 68 | -0.05% | -0.06% |
| CX | CEMEX S.A.B. | | Industrials | 7.99 | 25 | -1.66% | -0.06% |
| SA | Seabridge Gold | | Materials | 15.31 | 68 | 0.96% | -0.10% |
| VIV | Telefonica Brasil | | Technology | 9.34 | 35 | -0.85% | -0.11% |
| CAE | CAE | | Industrials | 18.60 | 8 | -2.72% | -0.16% |
| BBDO | Banco Bradesco | | Financials | 2.33 | 27 | 0.00% | -0.21% |
| SLF | Sun Life | | Financials | 51.00 | 45 | -1.35% | -0.22% |
| VTMX | Vesta Financials | | Financials | 35.16 | 17 | -1.73% | -0.23% |
| BMO | Bank of Montreal | | Financials | 91.89 | 20 | -1.02% | -0.27% |
| ASAI | Sendas Distribuidora | | Consumer Staples | 12.86 | 7 | -1.76% | -0.31% |
| GIL | Gildan Activewear | | Consumer Staples | 35.07 | 61 | -1.60% | -0.37% |
| SUZ | Suzano S.A | | Consumer Staples | 11.74 | 36 | 0.04% | -0.38% |
| ARCO | Arcos Dorados | | Services & Goods | 10.85 | 32 | -0.78% | -0.50% |
| MOGO | Mogo | | Financials | 1.83 | 41 | -1.61% | -0.54% |
| EDSA | Edesa Biotech | | Health Care | 4.44 | 48 | 3.26% | -0.67% |
| GTE | Gran Tierra | | Energy | 8.11 | 71 | -1.82% | -0.73% |
| ONCY | Oncolytics Biotech | | Health Care | 1.04 | 30 | -1.42% | -0.95% |
| IMAX | IMAX | | Services & Goods | 16.97 | 63 | -3.94% | -0.96% |
| To view more stocks, click on Next / Previous arrows or select different range: 0 - 25 , 25 - 50 , 50 - 75 , 75 - 100 , 100 - 125 , 125 - 150 , 150 - 175 , 175 - 200 | ||
 | Click To Change The Sort Order: By Market Cap or Company Size Performance: Year-to-date, Week and Day |  |
| Detailed Overview Of Latin America Stocks |
| Latin America Technical Overview, Leaders & Laggards, Top Latin America ETF Funds & Detailed Latin America Stocks List, Charts, Trends & More |
| Latin America: Technical Analysis, Trends & YTD Performance | |
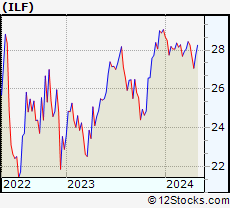
 ILF Weekly Chart |
|
| Long Term Trend: Not Good | |
| Medium Term Trend: Not Good | |
 ILF Daily Chart |
|
| Short Term Trend: Not Good | |
| Overall Trend Score: 10 | |
| YTD Performance: -6.88% | |
| **Trend Scores & Views Are Only For Educational Purposes And Not For Investing | |
| 12Stocks.com: Investing in Latin America Index using Exchange Traded Funds | |
|
The following table shows list of key exchange traded funds (ETF) that
help investors play Latin America stock market. For detailed view, check out our ETF Funds section of our website. Quick View: Move mouse or cursor over ETF symbol (ticker) to view short-term technical chart and over ETF name to view long term chart. Click on ticker or stock name for detailed view. Click on to add stock symbol to your watchlist and to view watchlist. |
12Stocks.com List of ETFs that track Latin America Index
| Ticker | ETF Name | Watchlist | Recent Price | Market Intelligence Score | Change % | Week % | Year-to-date % |
| ILF | Latin America 40 | | 27.06 | 10 | -0.92 | -0.04 | -6.88% |
| EWC | Canada | | 37.15 | 38 | -0.56 | 0.11 | 1.28% |
| EWZ | Brazil | | 30.77 | 17 | -0.71 | 0.1 | -11.99% |
| EWW | Mexico | | 64.96 | 10 | -1.23 | 0.11 | -4.26% |
| 12Stocks.com: Charts, Trends, Fundamental Data and Performances of Latin America Stocks | |
|
We now take in-depth look at all Latin America stocks including charts, multi-period performances and overall trends (as measured by market intelligence score). One can sort Latin America stocks (click link to choose) by Daily, Weekly and by Year-to-Date performances. Also, one can sort by size of the company or by market capitalization. |
| Select Your Default Chart Type: | |||||
| |||||
| Click on stock symbol or name for detailed view. Click on to add stock symbol to your watchlist and to view watchlist. Quick View: Move mouse or cursor over "Daily" to quickly view daily technical stock chart and over "Weekly" to view weekly technical stock chart. | |||||

 | CNQ Canadian Natural Resources Limited |
| Sector: Energy | |
| SubSector: Independent Oil & Gas | |
| MarketCap: 11925.2 Millions | |
| Recent Price: 76.61 Market Intelligence Score: 46 | |
| Day Percent Change: -0.40% Day Change: -0.30 | |
| Week Change: 0.07% Year-to-date Change: 16.9% | |
| CNQ Links: Profile News Message Board | |
| Charts:- Daily , Weekly | |
| Add CNQ to Watchlist: View: Get Complete CNQ Trend Analysis ➞ | |
 | MGA Magna International Inc. |
| Sector: Services & Goods | |
| SubSector: Auto Parts Wholesale | |
| MarketCap: 8967.3 Millions | |
| Recent Price: 48.37 Market Intelligence Score: 25 | |
| Day Percent Change: -1.71% Day Change: -0.84 | |
| Week Change: 0.06% Year-to-date Change: -18.1% | |
| MGA Links: Profile News Message Board | |
| Charts:- Daily , Weekly | |
| Add MGA to Watchlist: View: Get Complete MGA Trend Analysis ➞ | |
 | MELI MercadoLibre, Inc. |
| Sector: Services & Goods | |
| SubSector: Catalog & Mail Order Houses | |
| MarketCap: 24695.5 Millions | |
| Recent Price: 1356.91 Market Intelligence Score: 10 | |
| Day Percent Change: -0.96% Day Change: -13.09 | |
| Week Change: 0.04% Year-to-date Change: -13.7% | |
| MELI Links: Profile News Message Board | |
| Charts:- Daily , Weekly | |
| Add MELI to Watchlist: View: Get Complete MELI Trend Analysis ➞ | |
 | NFGC New Found Gold Corp. |
| Sector: Materials | |
| SubSector: Gold | |
| MarketCap: 868 Millions | |
| Recent Price: 3.68 Market Intelligence Score: 61 | |
| Day Percent Change: -2.90% Day Change: -0.11 | |
| Week Change: 0% Year-to-date Change: 4.6% | |
| NFGC Links: Profile News Message Board | |
| Charts:- Daily , Weekly | |
| Add NFGC to Watchlist: View: Get Complete NFGC Trend Analysis ➞ | |
 | VSTA Vasta Platform Limited |
| Sector: Consumer Staples | |
| SubSector: Education & Training Services | |
| MarketCap: 12747 Millions | |
| Recent Price: 3.75 Market Intelligence Score: 35 | |
| Day Percent Change: -1.32% Day Change: -0.05 | |
| Week Change: 0% Year-to-date Change: -14.8% | |
| VSTA Links: Profile News Message Board | |
| Charts:- Daily , Weekly | |
| Add VSTA to Watchlist: View: Get Complete VSTA Trend Analysis ➞ | |
 | SIM Grupo Simec, S.A.B. de C.V. |
| Sector: Materials | |
| SubSector: Steel & Iron | |
| MarketCap: 1418.28 Millions | |
| Recent Price: 31.00 Market Intelligence Score: 40 | |
| Day Percent Change: 0.00% Day Change: 0.00 | |
| Week Change: 0% Year-to-date Change: -0.6% | |
| SIM Links: Profile News Message Board | |
| Charts:- Daily , Weekly | |
| Add SIM to Watchlist: View: Get Complete SIM Trend Analysis ➞ | |
 | PDS Precision Drilling Corporation |
| Sector: Energy | |
| SubSector: Oil & Gas Equipment & Services | |
| MarketCap: 103.461 Millions | |
| Recent Price: 66.79 Market Intelligence Score: 36 | |
| Day Percent Change: -1.59% Day Change: -1.08 | |
| Week Change: -0.04% Year-to-date Change: 23.0% | |
| PDS Links: Profile News Message Board | |
| Charts:- Daily , Weekly | |
| Add PDS to Watchlist: View: Get Complete PDS Trend Analysis ➞ | |
 | NVEI Nuvei Corporation |
| Sector: Technology | |
| SubSector: Software - Infrastructure | |
| MarketCap: 5490 Millions | |
| Recent Price: 32.05 Market Intelligence Score: 68 | |
| Day Percent Change: -0.05% Day Change: -0.02 | |
| Week Change: -0.06% Year-to-date Change: 22.0% | |
| NVEI Links: Profile News Message Board | |
| Charts:- Daily , Weekly | |
| Add NVEI to Watchlist: View: Get Complete NVEI Trend Analysis ➞ | |
 | CX CEMEX, S.A.B. de C.V. |
| Sector: Industrials | |
| SubSector: Cement | |
| MarketCap: 2948.23 Millions | |
| Recent Price: 7.99 Market Intelligence Score: 25 | |
| Day Percent Change: -1.66% Day Change: -0.13 | |
| Week Change: -0.06% Year-to-date Change: 3.0% | |
| CX Links: Profile News Message Board | |
| Charts:- Daily , Weekly | |
| Add CX to Watchlist: View: Get Complete CX Trend Analysis ➞ | |
 | SA Seabridge Gold Inc. |
| Sector: Materials | |
| SubSector: Gold | |
| MarketCap: 565.419 Millions | |
| Recent Price: 15.31 Market Intelligence Score: 68 | |
| Day Percent Change: 0.96% Day Change: 0.14 | |
| Week Change: -0.1% Year-to-date Change: 26.2% | |
| SA Links: Profile News Message Board | |
| Charts:- Daily , Weekly | |
| Add SA to Watchlist: View: Get Complete SA Trend Analysis ➞ | |
 | VIV Telefonica Brasil S.A. |
| Sector: Technology | |
| SubSector: Wireless Communications | |
| MarketCap: 19611.1 Millions | |
| Recent Price: 9.34 Market Intelligence Score: 35 | |
| Day Percent Change: -0.85% Day Change: -0.08 | |
| Week Change: -0.11% Year-to-date Change: -14.6% | |
| VIV Links: Profile News Message Board | |
| Charts:- Daily , Weekly | |
| Add VIV to Watchlist: View: Get Complete VIV Trend Analysis ➞ | |
 | CAE CAE Inc. |
| Sector: Industrials | |
| SubSector: Aerospace/Defense Products & Services | |
| MarketCap: 3739.61 Millions | |
| Recent Price: 18.60 Market Intelligence Score: 8 | |
| Day Percent Change: -2.72% Day Change: -0.52 | |
| Week Change: -0.16% Year-to-date Change: -13.9% | |
| CAE Links: Profile News Message Board | |
| Charts:- Daily , Weekly | |
| Add CAE to Watchlist: View: Get Complete CAE Trend Analysis ➞ | |
 | BBDO Banco Bradesco S.A. |
| Sector: Financials | |
| SubSector: Foreign Regional Banks | |
| MarketCap: 27711.4 Millions | |
| Recent Price: 2.33 Market Intelligence Score: 27 | |
| Day Percent Change: 0.00% Day Change: 0.00 | |
| Week Change: -0.21% Year-to-date Change: -26.9% | |
| BBDO Links: Profile News Message Board | |
| Charts:- Daily , Weekly | |
| Add BBDO to Watchlist: View: Get Complete BBDO Trend Analysis ➞ | |
 | SLF Sun Life Financial Inc. |
| Sector: Financials | |
| SubSector: Property & Casualty Insurance | |
| MarketCap: 17722 Millions | |
| Recent Price: 51.00 Market Intelligence Score: 45 | |
| Day Percent Change: -1.35% Day Change: -0.70 | |
| Week Change: -0.22% Year-to-date Change: -1.7% | |
| SLF Links: Profile News Message Board | |
| Charts:- Daily , Weekly | |
| Add SLF to Watchlist: View: Get Complete SLF Trend Analysis ➞ | |
 | VTMX Vesta Financials Corp SAB de CV |
| Sector: Financials | |
| SubSector: REIT - Industrial | |
| MarketCap: 2270 Millions | |
| Recent Price: 35.16 Market Intelligence Score: 17 | |
| Day Percent Change: -1.73% Day Change: -0.62 | |
| Week Change: -0.23% Year-to-date Change: -11.6% | |
| VTMX Links: Profile News Message Board | |
| Charts:- Daily , Weekly | |
| Add VTMX to Watchlist: View: Get Complete VTMX Trend Analysis ➞ | |
 | BMO Bank of Montreal |
| Sector: Financials | |
| SubSector: Money Center Banks | |
| MarketCap: 32830.2 Millions | |
| Recent Price: 91.89 Market Intelligence Score: 20 | |
| Day Percent Change: -1.02% Day Change: -0.95 | |
| Week Change: -0.27% Year-to-date Change: -7.1% | |
| BMO Links: Profile News Message Board | |
| Charts:- Daily , Weekly | |
| Add BMO to Watchlist: View: Get Complete BMO Trend Analysis ➞ | |
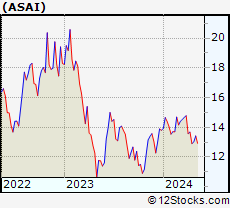 | ASAI Sendas Distribuidora S.A. |
| Sector: Consumer Staples | |
| SubSector: Grocery Stores | |
| MarketCap: 3790 Millions | |
| Recent Price: 12.86 Market Intelligence Score: 7 | |
| Day Percent Change: -1.76% Day Change: -0.23 | |
| Week Change: -0.31% Year-to-date Change: -6.8% | |
| ASAI Links: Profile News Message Board | |
| Charts:- Daily , Weekly | |
| Add ASAI to Watchlist: View: Get Complete ASAI Trend Analysis ➞ | |
 | GIL Gildan Activewear Inc. |
| Sector: Consumer Staples | |
| SubSector: Textile - Apparel Clothing | |
| MarketCap: 2411.65 Millions | |
| Recent Price: 35.07 Market Intelligence Score: 61 | |
| Day Percent Change: -1.60% Day Change: -0.57 | |
| Week Change: -0.37% Year-to-date Change: 6.1% | |
| GIL Links: Profile News Message Board | |
| Charts:- Daily , Weekly | |
| Add GIL to Watchlist: View: Get Complete GIL Trend Analysis ➞ | |
 | SUZ Suzano S.A. |
| Sector: Consumer Staples | |
| SubSector: Paper & Paper Products | |
| MarketCap: 7042.93 Millions | |
| Recent Price: 11.74 Market Intelligence Score: 36 | |
| Day Percent Change: 0.04% Day Change: 0.00 | |
| Week Change: -0.38% Year-to-date Change: 3.4% | |
| SUZ Links: Profile News Message Board | |
| Charts:- Daily , Weekly | |
| Add SUZ to Watchlist: View: Get Complete SUZ Trend Analysis ➞ | |
 | ARCO Arcos Dorados Holdings Inc. |
| Sector: Services & Goods | |
| SubSector: Restaurants | |
| MarketCap: 778.87 Millions | |
| Recent Price: 10.85 Market Intelligence Score: 32 | |
| Day Percent Change: -0.78% Day Change: -0.08 | |
| Week Change: -0.5% Year-to-date Change: -14.5% | |
| ARCO Links: Profile News Message Board | |
| Charts:- Daily , Weekly | |
| Add ARCO to Watchlist: View: Get Complete ARCO Trend Analysis ➞ | |
 | MOGO Mogo Inc. |
| Sector: Financials | |
| SubSector: Credit Services | |
| MarketCap: 21.9208 Millions | |
| Recent Price: 1.83 Market Intelligence Score: 41 | |
| Day Percent Change: -1.61% Day Change: -0.03 | |
| Week Change: -0.54% Year-to-date Change: -1.1% | |
| MOGO Links: Profile News Message Board | |
| Charts:- Daily , Weekly | |
| Add MOGO to Watchlist: View: Get Complete MOGO Trend Analysis ➞ | |
 | EDSA Edesa Biotech, Inc. |
| Sector: Health Care | |
| SubSector: Biotechnology | |
| MarketCap: 19.6785 Millions | |
| Recent Price: 4.44 Market Intelligence Score: 48 | |
| Day Percent Change: 3.26% Day Change: 0.14 | |
| Week Change: -0.67% Year-to-date Change: -4.3% | |
| EDSA Links: Profile News Message Board | |
| Charts:- Daily , Weekly | |
| Add EDSA to Watchlist: View: Get Complete EDSA Trend Analysis ➞ | |
 | GTE Gran Tierra Energy Inc. |
| Sector: Energy | |
| SubSector: Independent Oil & Gas | |
| MarketCap: 87.0593 Millions | |
| Recent Price: 8.11 Market Intelligence Score: 71 | |
| Day Percent Change: -1.82% Day Change: -0.15 | |
| Week Change: -0.73% Year-to-date Change: 43.8% | |
| GTE Links: Profile News Message Board | |
| Charts:- Daily , Weekly | |
| Add GTE to Watchlist: View: Get Complete GTE Trend Analysis ➞ | |
 | ONCY Oncolytics Biotech Inc. |
| Sector: Health Care | |
| SubSector: Biotechnology | |
| MarketCap: 57.3785 Millions | |
| Recent Price: 1.04 Market Intelligence Score: 30 | |
| Day Percent Change: -1.42% Day Change: -0.01 | |
| Week Change: -0.95% Year-to-date Change: -23.0% | |
| ONCY Links: Profile News Message Board | |
| Charts:- Daily , Weekly | |
| Add ONCY to Watchlist: View: Get Complete ONCY Trend Analysis ➞ | |
 | IMAX IMAX Corporation |
| Sector: Services & Goods | |
| SubSector: Entertainment - Diversified | |
| MarketCap: 874.237 Millions | |
| Recent Price: 16.97 Market Intelligence Score: 63 | |
| Day Percent Change: -3.94% Day Change: -0.70 | |
| Week Change: -0.96% Year-to-date Change: 13.0% | |
| IMAX Links: Profile News Message Board | |
| Charts:- Daily , Weekly | |
| Add IMAX to Watchlist: View: Get Complete IMAX Trend Analysis ➞ | |
| To view more stocks, click on Next / Previous arrows or select different range: 0 - 25 , 25 - 50 , 50 - 75 , 75 - 100 , 100 - 125 , 125 - 150 , 150 - 175 , 175 - 200 | ||
| Click To Change The Sort Order: By Market Cap or Company Size Performance: Year-to-date, Week and Day | |
| Select Chart Type: | ||
 Best Stocks Today 12Stocks.com |
© 2024 12Stocks.com Terms & Conditions Privacy Contact Us
All Information Provided Only For Education And Not To Be Used For Investing or Trading. See Terms & Conditions


One More Thing ... Get Best Stocks Delivered Daily!
Never Ever Miss A Move With Our Top Ten Stocks Lists
Find Best Stocks In Any Market - Bull or Bear Market
Take A Peek At Our Top Ten Stocks Lists: Daily, Weekly, Year-to-Date & Top Trends
Find Best Stocks In Any Market - Bull or Bear Market
Take A Peek At Our Top Ten Stocks Lists: Daily, Weekly, Year-to-Date & Top Trends
Latin America Stocks With Best Up Trends [0-bearish to 100-bullish]: SilverCrest Metals[100], Grupo Aeroportuario[100], Descartes Systems[100], Mercer [100], Hudbay Minerals[95], Controladora Vuela[95], Grupo Aeroportuario[93], SunOpta [93], Despegar.com [90], BRF S.A[88], Agnico Eagle[88]
Best Latin America Stocks Year-to-Date:
Aurora Cannabis[1348.97%], Fusion [123.13%], Canopy Growth[75.83%], Banco Macro[75.09%], Grupo Financiero[73.76%], D-Wave Quantum[68.68%], Banco BBVA[67%], McEwen Mining[56.59%], Celestica [53.35%], OrganiGram [47.33%], IAMGOLD [45.65%] Best Latin America Stocks This Week:
Canopy Growth[13.16%], Grupo Aeroportuario[12.96%], SunOpta [10.91%], Central Puerto[10.62%], Celestica [10.24%], Grupo Aeroportuario[10.07%], Despegar.com [8.84%], Afya [7.53%], Aurora Cannabis[6.81%], Vitru [6.49%], Mercer [6.39%] Best Latin America Stocks Daily:
Teck Resources[6.10%], Ambipar Emergency[5.31%], Hudbay Minerals[3.81%], Methanex [3.80%], Afya [3.52%], McEwen Mining[3.39%], Grupo Financiero[3.20%], Banco BBVA[2.66%], Banco Macro[2.59%], IAMGOLD [2.36%], SilverCrest Metals[2.33%]