
 Login Sign Up


| |||||
 |  | ||||

| 12Stocks.com Market Intelligence |
Best Latin America Stocks
|
|
| Quick Read: Top Latin America Stocks By Performances & Trends: Daily, Weekly, Year-to-Date, Market Cap (Size) & Technical Trends | |||
| Best Latin America Views: Quick Browse View, Summary & Slide Show | |||
| 12Stocks.com Latin America Stocks Performances & Trends Daily | |||||||||
|
|  The overall market intelligence score is 42 (0-bearish to 100-bullish) which puts Latin America index in short term neutral trend. The market intelligence score from previous trading session is 32 and hence an improvement of trend.
| ||||||||
| Here are the market intelligence trend scores of the most requested Latin America stocks at 12Stocks.com (click stock name for detailed review): | |
| Scroll down this page for most comprehensive review of Latin America stocks by performance, trends, technical analysis, charts, fund plays & more | |


| 12Stocks.com: Top Performing Latin America Index Stocks | ||||||||||||||||||||||||||||||||||||||||||||||||
 The top performing Latin America Index stocks year to date are
Now, more recently, over last week, the top performing Latin America Index stocks on the move are


|
||||||||||||||||||||||||||||||||||||||||||||||||
| 12Stocks.com: Investing in Latin America Index with Stocks | |
|
The following table helps investors and traders sort through current performance and trends (as measured by market intelligence score) of various
stocks in the Latin America Index. Quick View: Move mouse or cursor over stock symbol (ticker) to view short-term technical chart and over stock name to view long term chart. Click on  to add stock symbol to your watchlist and to add stock symbol to your watchlist and  to view watchlist. Click on any ticker or stock name for detailed market intelligence report for that stock. to view watchlist. Click on any ticker or stock name for detailed market intelligence report for that stock. |
12Stocks.com Performance of Stocks in Latin America Index
| Ticker | Stock Name | Watchlist | Category | Recent Price | Market Intelligence Score | Change % | Weekly Change% |
| BIOX | Bioceres Crop |   | Industrials | 11.94 | 10 | -0.25% | -1.53% |
| NGD | New Gold | | Materials | 1.72 | 53 | 0.00% | -1.71% |
| FNV | Franco-Nevada | | Materials | 119.32 | 43 | 0.93% | -1.77% |
| BHC | Bausch Health | | Health Care | 8.53 | 49 | 0.95% | -1.84% |
| BTG | B2Gold | | Materials | 2.55 | 10 | 1.59% | -1.92% |
| OR | Osisko Gold | | Materials | 15.78 | 46 | 2.20% | -2.05% |
| XP | XP | | Financials | 20.57 | 10 | -2.56% | -2.14% |
| PLG | Platinum | | Materials | 1.31 | 48 | -1.50% | -2.24% |
| APT | Alpha Pro | | Industrials | 6.02 | 26 | 0.84% | -2.27% |
| PAAS | Pan American | | Materials | 18.62 | 63 | 2.08% | -2.36% |
| QBTS | D-Wave Quantum | | Technology | 1.55 | 53 | 2.65% | -2.52% |
| EMX | EMX Royalty | | Materials | 1.89 | 41 | -2.07% | -2.58% |
| EPIX | ESSA Pharma | | Health Care | 6.40 | 17 | 0.00% | -2.59% |
| PHYS | Sprott Physical | | Financials | 18.01 | 44 | -0.28% | -2.65% |
| FMX | Fomento Economico | | Consumer Staples | 116.38 | 0 | -1.80% | -2.77% |
| USAS | Americas Silver | | Materials | 0.27 | 58 | 3.01% | -2.88% |
| SAND | Sandstorm Gold | | Materials | 5.36 | 46 | 1.90% | -2.90% |
| KGC | Kinross Gold | | Materials | 6.56 | 71 | 1.39% | -3.10% |
| CINT | CI&T | | Technology | 3.91 | 10 | -2.49% | -3.22% |
| ZYME | Zymeworks | | Health Care | 8.56 | 10 | -1.72% | -3.28% |
| TECK | Teck Resources | | Materials | 45.53 | 36 | -0.72% | -3.39% |
| CEF | Sprott Physical | | Financials | 21.54 | 36 | 0.00% | -3.75% |
| TRX | Tanzanian Gold | | Materials | 0.45 | 51 | -2.03% | -3.91% |
| EGO | Eldorado Gold | | Materials | 14.45 | 36 | 0.98% | -3.92% |
| LEV | Lion Electric | | Industrials | 0.93 | 10 | -1.80% | -4.02% |
| To view more stocks, click on Next / Previous arrows or select different range: 0 - 25 , 25 - 50 , 50 - 75 , 75 - 100 , 100 - 125 , 125 - 150 , 150 - 175 , 175 - 200 , 200 - 225 | ||
 | Click To Change The Sort Order: By Market Cap or Company Size Performance: Year-to-date, Week and Day |  |
| Detailed Overview Of Latin America Stocks |
| Latin America Technical Overview, Leaders & Laggards, Top Latin America ETF Funds & Detailed Latin America Stocks List, Charts, Trends & More |
| Latin America: Technical Analysis, Trends & YTD Performance | |
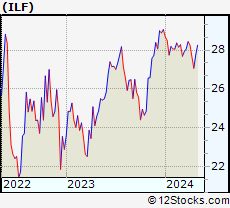
 ILF Weekly Chart |
|
| Long Term Trend: Not Good | |
| Medium Term Trend: Not Good | |
 ILF Daily Chart |
|
| Short Term Trend: Very Good | |
| Overall Trend Score: 42 | |
| YTD Performance: -5.4% | |
| **Trend Scores & Views Are Only For Educational Purposes And Not For Investing | |
| 12Stocks.com: Investing in Latin America Index using Exchange Traded Funds | |
|
The following table shows list of key exchange traded funds (ETF) that
help investors play Latin America stock market. For detailed view, check out our ETF Funds section of our website. Quick View: Move mouse or cursor over ETF symbol (ticker) to view short-term technical chart and over ETF name to view long term chart. Click on ticker or stock name for detailed view. Click on to add stock symbol to your watchlist and to view watchlist. |
12Stocks.com List of ETFs that track Latin America Index
| Ticker | ETF Name | Watchlist | Recent Price | Market Intelligence Score | Change % | Week % | Year-to-date % |
| ILF | Latin America 40 | | 27.49 | 42 | 0.70 | 1.55 | -5.4% |
| EWC | Canada | | 37.70 | 75 | 0.91 | 1.59 | 2.78% |
| FLN | Latin America AlphaDEX | | 19.66 | 32 | 1.21 | 2.32 | -5.41% |
| EWZ | Brazil | | 31.16 | 49 | 0.48 | 1.37 | -10.87% |
| EWW | Mexico | | 66.49 | 45 | 1.36 | 2.47 | -2% |
| ARGT | Argentina | | 55.84 | 93 | 0.09 | 4.43 | 8.77% |
| EWZS | Brazil Small-Cap | | 13.27 | 39 | 0.61 | 2.08 | -11.89% |
| BRF | Brazil Small-Cap | | 15.09 | 32 | 0.67 | 1.55 | -14.2% |
| BZQ | Short Brazil | | 12.39 | 56 | -1.17 | -2.73 | 23.48% |
| BRZU | Brazil Bull 3X | | 78.98 | 49 | 1.09 | 2.84 | -23.23% |
| FBZ | Brazil AlphaDEX | | 11.35 | 32 | 0.27 | 0.98 | -7.13% |
| 12Stocks.com: Charts, Trends, Fundamental Data and Performances of Latin America Stocks | |
|
We now take in-depth look at all Latin America stocks including charts, multi-period performances and overall trends (as measured by market intelligence score). One can sort Latin America stocks (click link to choose) by Daily, Weekly and by Year-to-Date performances. Also, one can sort by size of the company or by market capitalization. |
| Select Your Default Chart Type: | |||||
| |||||
| Click on stock symbol or name for detailed view. Click on to add stock symbol to your watchlist and to view watchlist. Quick View: Move mouse or cursor over "Daily" to quickly view daily technical stock chart and over "Weekly" to view weekly technical stock chart. | |||||

 | BIOX Bioceres Crop Solutions Corp. |
| Sector: Industrials | |
| SubSector: Conglomerates | |
| MarketCap: 198.348 Millions | |
| Recent Price: 11.94 Market Intelligence Score: 10 | |
| Day Percent Change: -0.25% Day Change: -0.03 | |
| Week Change: -1.53% Year-to-date Change: -13.0% | |
| BIOX Links: Profile News Message Board | |
| Charts:- Daily , Weekly | |
| Add BIOX to Watchlist: View: Get Complete BIOX Trend Analysis ➞ | |
 | NGD New Gold Inc. |
| Sector: Materials | |
| SubSector: Gold | |
| MarketCap: 398.119 Millions | |
| Recent Price: 1.72 Market Intelligence Score: 53 | |
| Day Percent Change: 0.00% Day Change: 0.00 | |
| Week Change: -1.71% Year-to-date Change: 17.8% | |
| NGD Links: Profile News Message Board | |
| Charts:- Daily , Weekly | |
| Add NGD to Watchlist: View: Get Complete NGD Trend Analysis ➞ | |
 | FNV Franco-Nevada Corporation |
| Sector: Materials | |
| SubSector: Gold | |
| MarketCap: 17703.9 Millions | |
| Recent Price: 119.32 Market Intelligence Score: 43 | |
| Day Percent Change: 0.93% Day Change: 1.10 | |
| Week Change: -1.77% Year-to-date Change: 7.7% | |
| FNV Links: Profile News Message Board | |
| Charts:- Daily , Weekly | |
| Add FNV to Watchlist: View: Get Complete FNV Trend Analysis ➞ | |
 | BHC Bausch Health Companies Inc. |
| Sector: Health Care | |
| SubSector: Drug Delivery | |
| MarketCap: 5485.3 Millions | |
| Recent Price: 8.53 Market Intelligence Score: 49 | |
| Day Percent Change: 0.95% Day Change: 0.08 | |
| Week Change: -1.84% Year-to-date Change: 6.4% | |
| BHC Links: Profile News Message Board | |
| Charts:- Daily , Weekly | |
| Add BHC to Watchlist: View: Get Complete BHC Trend Analysis ➞ | |
 | BTG B2Gold Corp. |
| Sector: Materials | |
| SubSector: Gold | |
| MarketCap: 2792.39 Millions | |
| Recent Price: 2.55 Market Intelligence Score: 10 | |
| Day Percent Change: 1.59% Day Change: 0.04 | |
| Week Change: -1.92% Year-to-date Change: -19.3% | |
| BTG Links: Profile News Message Board | |
| Charts:- Daily , Weekly | |
| Add BTG to Watchlist: View: Get Complete BTG Trend Analysis ➞ | |
 | OR Osisko Gold Royalties Ltd |
| Sector: Materials | |
| SubSector: Gold | |
| MarketCap: 1025.99 Millions | |
| Recent Price: 15.78 Market Intelligence Score: 46 | |
| Day Percent Change: 2.20% Day Change: 0.34 | |
| Week Change: -2.05% Year-to-date Change: 10.5% | |
| OR Links: Profile News Message Board | |
| Charts:- Daily , Weekly | |
| Add OR to Watchlist: View: Get Complete OR Trend Analysis ➞ | |
 | XP XP Inc. |
| Sector: Financials | |
| SubSector: Asset Management | |
| MarketCap: 12990.3 Millions | |
| Recent Price: 20.57 Market Intelligence Score: 10 | |
| Day Percent Change: -2.56% Day Change: -0.54 | |
| Week Change: -2.14% Year-to-date Change: -21.1% | |
| XP Links: Profile News Message Board | |
| Charts:- Daily , Weekly | |
| Add XP to Watchlist: View: Get Complete XP Trend Analysis ➞ | |
 | PLG Platinum Group Metals Ltd. |
| Sector: Materials | |
| SubSector: Industrial Metals & Minerals | |
| MarketCap: 77.591 Millions | |
| Recent Price: 1.31 Market Intelligence Score: 48 | |
| Day Percent Change: -1.50% Day Change: -0.02 | |
| Week Change: -2.24% Year-to-date Change: 14.9% | |
| PLG Links: Profile News Message Board | |
| Charts:- Daily , Weekly | |
| Add PLG to Watchlist: View: Get Complete PLG Trend Analysis ➞ | |
 | APT Alpha Pro Tech, Ltd. |
| Sector: Industrials | |
| SubSector: General Building Materials | |
| MarketCap: 125.953 Millions | |
| Recent Price: 6.02 Market Intelligence Score: 26 | |
| Day Percent Change: 0.84% Day Change: 0.05 | |
| Week Change: -2.27% Year-to-date Change: 13.8% | |
| APT Links: Profile News Message Board | |
| Charts:- Daily , Weekly | |
| Add APT to Watchlist: View: Get Complete APT Trend Analysis ➞ | |
 | PAAS Pan American Silver Corp. |
| Sector: Materials | |
| SubSector: Silver | |
| MarketCap: 2832.56 Millions | |
| Recent Price: 18.62 Market Intelligence Score: 63 | |
| Day Percent Change: 2.08% Day Change: 0.38 | |
| Week Change: -2.36% Year-to-date Change: 14.0% | |
| PAAS Links: Profile News Message Board | |
| Charts:- Daily , Weekly | |
| Add PAAS to Watchlist: View: Get Complete PAAS Trend Analysis ➞ | |
 | QBTS D-Wave Quantum Inc. |
| Sector: Technology | |
| SubSector: Computer Hardware | |
| MarketCap: 290 Millions | |
| Recent Price: 1.55 Market Intelligence Score: 53 | |
| Day Percent Change: 2.65% Day Change: 0.04 | |
| Week Change: -2.52% Year-to-date Change: 76.7% | |
| QBTS Links: Profile News Message Board | |
| Charts:- Daily , Weekly | |
| Add QBTS to Watchlist: View: Get Complete QBTS Trend Analysis ➞ | |
 | EMX EMX Royalty Corporation |
| Sector: Materials | |
| SubSector: Industrial Metals & Minerals | |
| MarketCap: 103.91 Millions | |
| Recent Price: 1.89 Market Intelligence Score: 41 | |
| Day Percent Change: -2.07% Day Change: -0.04 | |
| Week Change: -2.58% Year-to-date Change: 16.7% | |
| EMX Links: Profile News Message Board | |
| Charts:- Daily , Weekly | |
| Add EMX to Watchlist: View: Get Complete EMX Trend Analysis ➞ | |
 | EPIX ESSA Pharma Inc. |
| Sector: Health Care | |
| SubSector: Biotechnology | |
| MarketCap: 70.5785 Millions | |
| Recent Price: 6.40 Market Intelligence Score: 17 | |
| Day Percent Change: 0.00% Day Change: 0.00 | |
| Week Change: -2.59% Year-to-date Change: -2.1% | |
| EPIX Links: Profile News Message Board | |
| Charts:- Daily , Weekly | |
| Add EPIX to Watchlist: View: Get Complete EPIX Trend Analysis ➞ | |
 | PHYS Sprott Physical Gold Trust |
| Sector: Financials | |
| SubSector: Exchange Traded Fund | |
| MarketCap: 2365.21 Millions | |
| Recent Price: 18.01 Market Intelligence Score: 44 | |
| Day Percent Change: -0.28% Day Change: -0.05 | |
| Week Change: -2.65% Year-to-date Change: 13.1% | |
| PHYS Links: Profile News Message Board | |
| Charts:- Daily , Weekly | |
| Add PHYS to Watchlist: View: Get Complete PHYS Trend Analysis ➞ | |
 | FMX Fomento Economico Mexicano, S.A.B. de C.V. |
| Sector: Consumer Staples | |
| SubSector: Beverages - Brewers | |
| MarketCap: 22018.7 Millions | |
| Recent Price: 116.38 Market Intelligence Score: 0 | |
| Day Percent Change: -1.80% Day Change: -2.13 | |
| Week Change: -2.77% Year-to-date Change: -10.7% | |
| FMX Links: Profile News Message Board | |
| Charts:- Daily , Weekly | |
| Add FMX to Watchlist: View: Get Complete FMX Trend Analysis ➞ | |
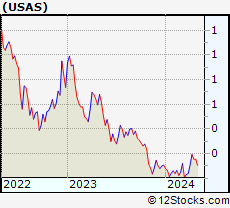 | USAS Americas Silver Corporation |
| Sector: Materials | |
| SubSector: Silver | |
| MarketCap: 67.8456 Millions | |
| Recent Price: 0.27 Market Intelligence Score: 58 | |
| Day Percent Change: 3.01% Day Change: 0.01 | |
| Week Change: -2.88% Year-to-date Change: 6.3% | |
| USAS Links: Profile News Message Board | |
| Charts:- Daily , Weekly | |
| Add USAS to Watchlist: View: Get Complete USAS Trend Analysis ➞ | |
 | SAND Sandstorm Gold Ltd. |
| Sector: Materials | |
| SubSector: Gold | |
| MarketCap: 808.119 Millions | |
| Recent Price: 5.36 Market Intelligence Score: 46 | |
| Day Percent Change: 1.90% Day Change: 0.10 | |
| Week Change: -2.9% Year-to-date Change: 6.6% | |
| SAND Links: Profile News Message Board | |
| Charts:- Daily , Weekly | |
| Add SAND to Watchlist: View: Get Complete SAND Trend Analysis ➞ | |
 | KGC Kinross Gold Corporation |
| Sector: Materials | |
| SubSector: Gold | |
| MarketCap: 5389.29 Millions | |
| Recent Price: 6.56 Market Intelligence Score: 71 | |
| Day Percent Change: 1.39% Day Change: 0.09 | |
| Week Change: -3.1% Year-to-date Change: 8.4% | |
| KGC Links: Profile News Message Board | |
| Charts:- Daily , Weekly | |
| Add KGC to Watchlist: View: Get Complete KGC Trend Analysis ➞ | |
 | CINT CI&T Inc |
| Sector: Technology | |
| SubSector: Software - Infrastructure | |
| MarketCap: 806 Millions | |
| Recent Price: 3.91 Market Intelligence Score: 10 | |
| Day Percent Change: -2.49% Day Change: -0.10 | |
| Week Change: -3.22% Year-to-date Change: -26.6% | |
| CINT Links: Profile News Message Board | |
| Charts:- Daily , Weekly | |
| Add CINT to Watchlist: View: Get Complete CINT Trend Analysis ➞ | |
 | ZYME Zymeworks Inc. |
| Sector: Health Care | |
| SubSector: Biotechnology | |
| MarketCap: 1373.55 Millions | |
| Recent Price: 8.56 Market Intelligence Score: 10 | |
| Day Percent Change: -1.72% Day Change: -0.15 | |
| Week Change: -3.28% Year-to-date Change: -17.6% | |
| ZYME Links: Profile News Message Board | |
| Charts:- Daily , Weekly | |
| Add ZYME to Watchlist: View: Get Complete ZYME Trend Analysis ➞ | |
 | TECK Teck Resources Limited |
| Sector: Materials | |
| SubSector: Industrial Metals & Minerals | |
| MarketCap: 4347.4 Millions | |
| Recent Price: 45.53 Market Intelligence Score: 36 | |
| Day Percent Change: -0.72% Day Change: -0.33 | |
| Week Change: -3.39% Year-to-date Change: 7.7% | |
| TECK Links: Profile News Message Board | |
| Charts:- Daily , Weekly | |
| Add TECK to Watchlist: View: Get Complete TECK Trend Analysis ➞ | |
 | CEF Sprott Physical Gold and Silver Trust |
| Sector: Financials | |
| SubSector: Asset Management | |
| MarketCap: 2485.33 Millions | |
| Recent Price: 21.54 Market Intelligence Score: 36 | |
| Day Percent Change: 0.00% Day Change: 0.00 | |
| Week Change: -3.75% Year-to-date Change: 12.5% | |
| CEF Links: Profile News Message Board | |
| Charts:- Daily , Weekly | |
| Add CEF to Watchlist: View: Get Complete CEF Trend Analysis ➞ | |
 | TRX Tanzanian Gold Corporation |
| Sector: Materials | |
| SubSector: Gold | |
| MarketCap: 95.9619 Millions | |
| Recent Price: 0.45 Market Intelligence Score: 51 | |
| Day Percent Change: -2.03% Day Change: -0.01 | |
| Week Change: -3.91% Year-to-date Change: 19.0% | |
| TRX Links: Profile News Message Board | |
| Charts:- Daily , Weekly | |
| Add TRX to Watchlist: View: Get Complete TRX Trend Analysis ➞ | |
 | EGO Eldorado Gold Corporation |
| Sector: Materials | |
| SubSector: Gold | |
| MarketCap: 982.519 Millions | |
| Recent Price: 14.45 Market Intelligence Score: 36 | |
| Day Percent Change: 0.98% Day Change: 0.14 | |
| Week Change: -3.92% Year-to-date Change: 11.4% | |
| EGO Links: Profile News Message Board | |
| Charts:- Daily , Weekly | |
| Add EGO to Watchlist: View: Get Complete EGO Trend Analysis ➞ | |
 | LEV The Lion Electric Company |
| Sector: Industrials | |
| SubSector: Farm & Heavy Construction Machinery | |
| MarketCap: 414 Millions | |
| Recent Price: 0.93 Market Intelligence Score: 10 | |
| Day Percent Change: -1.80% Day Change: -0.02 | |
| Week Change: -4.02% Year-to-date Change: -47.4% | |
| LEV Links: Profile News Message Board | |
| Charts:- Daily , Weekly | |
| Add LEV to Watchlist: View: Get Complete LEV Trend Analysis ➞ | |
| To view more stocks, click on Next / Previous arrows or select different range: 0 - 25 , 25 - 50 , 50 - 75 , 75 - 100 , 100 - 125 , 125 - 150 , 150 - 175 , 175 - 200 , 200 - 225 | ||
| Click To Change The Sort Order: By Market Cap or Company Size Performance: Year-to-date, Week and Day | |
| Select Chart Type: | ||
 Best Stocks Today 12Stocks.com |
© 2024 12Stocks.com Terms & Conditions Privacy Contact Us
All Information Provided Only For Education And Not To Be Used For Investing or Trading. See Terms & Conditions


One More Thing ... Get Best Stocks Delivered Daily!
Never Ever Miss A Move With Our Top Ten Stocks Lists
Find Best Stocks In Any Market - Bull or Bear Market
Take A Peek At Our Top Ten Stocks Lists: Daily, Weekly, Year-to-Date & Top Trends
Find Best Stocks In Any Market - Bull or Bear Market
Take A Peek At Our Top Ten Stocks Lists: Daily, Weekly, Year-to-Date & Top Trends
Latin America Stocks With Best Up Trends [0-bearish to 100-bullish]: Grupo Aeroportuario[100], Grupo Aeroportuario[100], Controladora Vuela[100], BRF S.A[100], Descartes Systems[100], IMAX [100], IRSA Inversiones[100], Aurora Cannabis[95], Banco BBVA[95], Grupo Financiero[95], Grupo Supervielle[95]
Best Latin America Stocks Year-to-Date:
Aurora Cannabis[1458.17%], Fusion [123.13%], Banco Macro[81.43%], Grupo Financiero[76.83%], Canopy Growth[76.71%], D-Wave Quantum[76.66%], Banco BBVA[72.79%], McEwen Mining[54.09%], Grupo Supervielle[49.75%], Celestica [49.45%], OrganiGram [48.85%] Best Latin America Stocks This Week:
Aurora Cannabis[14.86%], Grupo Aeroportuario[14.29%], Canopy Growth[13.73%], Central Puerto[12.49%], Repare [11.26%], Grupo Supervielle[10.55%], SunOpta [9.9%], Grupo Aeroportuario[9.79%], Banco BBVA[9.68%], Controladora Vuela[8.72%], Grupo Aeroportuario[8.7%] Best Latin America Stocks Daily:
Aurora Cannabis[18.15%], Canopy Growth[15.03%], Grupo Aeroportuario[11.24%], Grupo Aeroportuario[7.33%], Grupo Aeroportuario[7.24%], Tilray [6.98%], IAMGOLD [6.30%], Endeavour Silver[6.25%], Controladora Vuela[5.74%], New Found[5.26%], Shopify [4.90%]