
 Login Sign Up


| |||||
 |  | ||||

| 12Stocks.com Market Intelligence |
Best Latin America Stocks
|
|
| Quick Read: Top Latin America Stocks By Performances & Trends: Daily, Weekly, Year-to-Date, Market Cap (Size) & Technical Trends | |||
| Best Latin America Views: Quick Browse View, Summary & Slide Show | |||
| 12Stocks.com Latin America Stocks Performances & Trends Daily | |||||||||
|
|  The overall market intelligence score is 40 (0-bearish to 100-bullish) which puts Latin America index in short term bearish to neutral trend. The market intelligence score from previous trading session is 50 and a deterioration of trend continues.
| ||||||||
Here are the market intelligence trend scores of the most requested Latin America stocks at 12Stocks.com (click stock name for detailed review):
| |||||||||||||||||||||||||
| Scroll down this page for most comprehensive review of Latin America stocks by performance, trends, technical analysis, charts, fund plays & more | |||||||||||||||||||||||||


| 12Stocks.com: Top Performing Latin America Index Stocks | ||||||||||||||||||||||||||||||||||||||||||||||||
 The top performing Latin America Index stocks year to date are
Now, more recently, over last week, the top performing Latin America Index stocks on the move are


|
||||||||||||||||||||||||||||||||||||||||||||||||
| 12Stocks.com: Investing in Latin America Index with Stocks | |
|
The following table helps investors and traders sort through current performance and trends (as measured by market intelligence score) of various
stocks in the Latin America Index. Quick View: Move mouse or cursor over stock symbol (ticker) to view short-term technical chart and over stock name to view long term chart. Click on  to add stock symbol to your watchlist and to add stock symbol to your watchlist and  to view watchlist. Click on any ticker or stock name for detailed market intelligence report for that stock. to view watchlist. Click on any ticker or stock name for detailed market intelligence report for that stock. |
12Stocks.com Performance of Stocks in Latin America Index
| Ticker | Stock Name | Watchlist | Category | Recent Price | Market Intelligence Score | Change % | YTD Change% |
| UFS | Domtar |   | Consumer Staples | 194.38 | 80 | 1.43% | 0.00% |
| GOOS | Canada Goose | | Services & Goods | 14.61 | 100 | 0.76% | 47.13% |
| AZUL | Azul S.A | | Transports | 0.37 | 40 | 0.00% | -78.98% |
| TV | Grupo Televisa | | Technology | 2.54 | 0 | 0.00% | 52.09% |
| ABCL | AbCellera Biologics | | Health Care | 5.89 | 80 | -1.42% | 94.39% |
| TIXT | TELUS | | Technology | 4.48 | 60 | -0.22% | 12.00% |
| VET | Vermilion Energy | | Energy | 8.37 | 100 | 5.82% | -12.70% |
| AAV | Advantage Oil | | Energy | 117.57 | 40 | 1.02% | 0.00% |
| IRS | Irsa Inversiones | | Financials | 11.50 | 0 | -1.37% | -27.76% |
| SVM | Silvercorp Metals | | Materials | 7.00 | 100 | 5.58% | 122.87% |
| LOMA | Loma Negra | | Materials | 7.48 | 50 | 0.94% | -40.45% |
| TEO | Telecom Argentina | | Technology | 7.48 | 70 | 0.40% | -45.80% |
| TGB | Taseko Mines | | Materials | 4.16 | 80 | -0.72% | 108.00% |
| PVG | Pretium Resources | | Materials | 17.94 | 80 | 1.36% | 0.00% |
| LICY | Li-Cycle | | Industrials | 0.84 | 20 | -4.06% | -64.42% |
| CRON | Cronos | | Health Care | 2.59 | 50 | 0.00% | 25.73% |
| DCBO | Docebo | | Technology | 27.46 | 50 | 1.01% | -39.37% |
| OSB | Norbord | | Services & Goods | 37.02 | 0 | -3.67% | 0.00% |
| MITL | Mitel Networks | | Technology | 2.32 | 20 | 4.50% | 0.00% |
| TRQ | Turquoise Hill | | Materials | 167.45 | 100 | 3.40% | 0.00% |
| PWE | Penn West | | Energy | 1.26 | 10 | 0.00% | 0.00% |
| PDS | Precision Drilling | | Energy | 58.08 | 80 | 1.97% | -7.94% |
| KLDX | Klondex Mines | | Materials | 56.07 | 50 | -0.95% | 0.00% |
| CSIQ | Canadian Solar | | Technology | 15.20 | 100 | -0.39% | 26.25% |
| USAS | Americas Gold | | Materials | 3.95 | 100 | 2.07% | NA |
| To view more stocks, click on Next / Previous arrows or select different range: 0 - 25 , 25 - 50 , 50 - 75 , 75 - 100 , 100 - 125 , 125 - 150 , 150 - 175 , 175 - 200 , 200 - 225 , 225 - 250 , 250 - 275 , 275 - 300 , 300 - 325 | ||
 | Click To Change The Sort Order: By Market Cap or Company Size Performance: Year-to-date, Week and Day |  |
| Detailed Overview Of Latin America Stocks |
| Latin America Technical Overview, Leaders & Laggards, Top Latin America ETF Funds & Detailed Latin America Stocks List, Charts, Trends & More |
| Latin America: Technical Analysis, Trends & YTD Performance | |
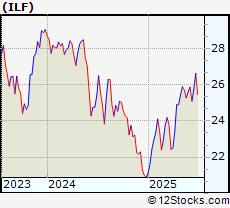
 ILF Weekly Chart |
|
| Long Term Trend: Very Good | |
| Medium Term Trend: Very Good | |
 ILF Daily Chart |
|
| Short Term Trend: Not Good | |
| Overall Trend Score: 40 | |
| YTD Performance: 37.4889% | |
| **Trend Scores & Views Are Only For Educational Purposes And Not For Investing | |
| 12Stocks.com: Investing in Latin America Index using Exchange Traded Funds | |
|
The following table shows list of key exchange traded funds (ETF) that
help investors play Latin America stock market. For detailed view, check out our ETF Funds section of our website. Quick View: Move mouse or cursor over ETF symbol (ticker) to view short-term technical chart and over ETF name to view long term chart. Click on ticker or stock name for detailed view. Click on to add stock symbol to your watchlist and to view watchlist. |
12Stocks.com List of ETFs that track Latin America Index
| Ticker | ETF Name | Watchlist | Recent Price | Market Intelligence Score | Change % | Week % | Year-to-date % |
| LBJ | Latin America Bull | | 60.40 | 50 | 0 | 0 | 0% |
| DBBR | Brazil Hedgd Eq | | 54.06 | 70 | -0.478645 | 0.632911 | 0% |
| FBZ | Brazil AlphaDEX | | 11.52 | 30 | 0 | 0 | 29.5955% |
| 12Stocks.com: Charts, Trends, Fundamental Data and Performances of Latin America Stocks | |
|
We now take in-depth look at all Latin America stocks including charts, multi-period performances and overall trends (as measured by market intelligence score). One can sort Latin America stocks (click link to choose) by Daily, Weekly and by Year-to-Date performances. Also, one can sort by size of the company or by market capitalization. |
| Select Your Default Chart Type: | |||||
| |||||
| Click on stock symbol or name for detailed view. Click on to add stock symbol to your watchlist and to view watchlist. Quick View: Move mouse or cursor over "Daily" to quickly view daily technical stock chart and over "Weekly" to view weekly technical stock chart. | |||||

 | UFS Domtar Corporation |
| Sector: Consumer Staples | |
| SubSector: Paper & Paper Products | |
| MarketCap: 1302.03 Millions | |
| Recent Price: 194.38 Market Intelligence Score: 80 | |
| Day Percent Change: 1.42976% Day Change: -9999 | |
| Week Change: 250.297% Year-to-date Change: 0.0% | |
| UFS Links: Profile News Message Board | |
| Charts:- Daily , Weekly | |
| Add UFS to Watchlist: View: Get Complete UFS Trend Analysis ➞ | |
 | GOOS Canada Goose Holdings Inc |
| Sector: Services & Goods | |
| SubSector: Apparel Manufacturing | |
| MarketCap: 1299.77 Millions | |
| Recent Price: 14.61 Market Intelligence Score: 100 | |
| Day Percent Change: 0.758621% Day Change: -0.07 | |
| Week Change: 9.93228% Year-to-date Change: 47.1% | |
| GOOS Links: Profile News Message Board | |
| Charts:- Daily , Weekly | |
| Add GOOS to Watchlist: View: Get Complete GOOS Trend Analysis ➞ | |
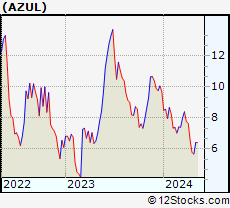 | AZUL Azul S.A. |
| Sector: Transports | |
| SubSector: Major Airlines | |
| MarketCap: 1289.85 Millions | |
| Recent Price: 0.37 Market Intelligence Score: 40 | |
| Day Percent Change: 0% Day Change: -9999 | |
| Week Change: 21.4708% Year-to-date Change: -79.0% | |
| AZUL Links: Profile News Message Board | |
| Charts:- Daily , Weekly | |
| Add AZUL to Watchlist: View: Get Complete AZUL Trend Analysis ➞ | |
 | TV Grupo Televisa SAB ADR |
| Sector: Technology | |
| SubSector: Telecom Services | |
| MarketCap: 1281.93 Millions | |
| Recent Price: 2.54 Market Intelligence Score: 0 | |
| Day Percent Change: 0% Day Change: -0.01 | |
| Week Change: -6.61765% Year-to-date Change: 52.1% | |
| TV Links: Profile News Message Board | |
| Charts:- Daily , Weekly | |
| Add TV to Watchlist: View: Get Complete TV Trend Analysis ➞ | |
 | ABCL AbCellera Biologics Inc |
| Sector: Health Care | |
| SubSector: Biotechnology | |
| MarketCap: 1261.07 Millions | |
| Recent Price: 5.89 Market Intelligence Score: 80 | |
| Day Percent Change: -1.42259% Day Change: 0.13 | |
| Week Change: 26.6667% Year-to-date Change: 94.4% | |
| ABCL Links: Profile News Message Board | |
| Charts:- Daily , Weekly | |
| Add ABCL to Watchlist: View: Get Complete ABCL Trend Analysis ➞ | |
 | TIXT TELUS International (Cda) Inc |
| Sector: Technology | |
| SubSector: Software - Infrastructure | |
| MarketCap: 1231.44 Millions | |
| Recent Price: 4.48 Market Intelligence Score: 60 | |
| Day Percent Change: -0.222717% Day Change: 0.09 | |
| Week Change: -0.222717% Year-to-date Change: 12.0% | |
| TIXT Links: Profile News Message Board | |
| Charts:- Daily , Weekly | |
| Add TIXT to Watchlist: View: Get Complete TIXT Trend Analysis ➞ | |
 | VET Vermilion Energy Inc |
| Sector: Energy | |
| SubSector: Oil & Gas E&P | |
| MarketCap: 1121.2 Millions | |
| Recent Price: 8.37 Market Intelligence Score: 100 | |
| Day Percent Change: 5.81542% Day Change: 0.14 | |
| Week Change: 1.33172% Year-to-date Change: -12.7% | |
| VET Links: Profile News Message Board | |
| Charts:- Daily , Weekly | |
| Add VET to Watchlist: View: Get Complete VET Trend Analysis ➞ | |
 | AAV Advantage Oil & Gas Ltd. |
| Sector: Energy | |
| SubSector: Oil & Gas Drilling & Exploration | |
| MarketCap: 1119.29 Millions | |
| Recent Price: 117.57 Market Intelligence Score: 40 | |
| Day Percent Change: 1.02251% Day Change: -9999 | |
| Week Change: 1.11809% Year-to-date Change: 0.0% | |
| AAV Links: Profile News Message Board | |
| Charts:- Daily , Weekly | |
| Add AAV to Watchlist: View: Get Complete AAV Trend Analysis ➞ | |
 | IRS Irsa Inversiones Y Representaciones S.A. ADR |
| Sector: Financials | |
| SubSector: Real Estate Services | |
| MarketCap: 1092.66 Millions | |
| Recent Price: 11.50 Market Intelligence Score: 0 | |
| Day Percent Change: -1.37221% Day Change: 0.01 | |
| Week Change: -9.5912% Year-to-date Change: -27.8% | |
| IRS Links: Profile News Message Board | |
| Charts:- Daily , Weekly | |
| Add IRS to Watchlist: View: Get Complete IRS Trend Analysis ➞ | |
 | SVM Silvercorp Metals Inc |
| Sector: Materials | |
| SubSector: Silver | |
| MarketCap: 1075.66 Millions | |
| Recent Price: 7.00 Market Intelligence Score: 100 | |
| Day Percent Change: 5.58069% Day Change: 0.07 | |
| Week Change: 18.2432% Year-to-date Change: 122.9% | |
| SVM Links: Profile News Message Board | |
| Charts:- Daily , Weekly | |
| Add SVM to Watchlist: View: Get Complete SVM Trend Analysis ➞ | |
 | LOMA Loma Negra Compania Industrial Argentina Sociedad Anonima ADR |
| Sector: Materials | |
| SubSector: Building Materials | |
| MarketCap: 1072.8 Millions | |
| Recent Price: 7.48 Market Intelligence Score: 50 | |
| Day Percent Change: 0.944669% Day Change: 0.12 | |
| Week Change: -3.23415% Year-to-date Change: -40.4% | |
| LOMA Links: Profile News Message Board | |
| Charts:- Daily , Weekly | |
| Add LOMA to Watchlist: View: Get Complete LOMA Trend Analysis ➞ | |
 | TEO Telecom Argentina S.A. ADR |
| Sector: Technology | |
| SubSector: Telecom Services | |
| MarketCap: 1070.2 Millions | |
| Recent Price: 7.48 Market Intelligence Score: 70 | |
| Day Percent Change: 0.402685% Day Change: 0.23 | |
| Week Change: 0.537634% Year-to-date Change: -45.8% | |
| TEO Links: Profile News Message Board | |
| Charts:- Daily , Weekly | |
| Add TEO to Watchlist: View: Get Complete TEO Trend Analysis ➞ | |
 | TGB Taseko Mines Ltd |
| Sector: Materials | |
| SubSector: Copper | |
| MarketCap: 1051.88 Millions | |
| Recent Price: 4.16 Market Intelligence Score: 80 | |
| Day Percent Change: -0.71599% Day Change: 0.01 | |
| Week Change: 2.71605% Year-to-date Change: 108.0% | |
| TGB Links: Profile News Message Board | |
| Charts:- Daily , Weekly | |
| Add TGB to Watchlist: View: Get Complete TGB Trend Analysis ➞ | |
 | PVG Pretium Resources Inc. |
| Sector: Materials | |
| SubSector: Gold | |
| MarketCap: 1025.19 Millions | |
| Recent Price: 17.94 Market Intelligence Score: 80 | |
| Day Percent Change: 1.35593% Day Change: -9999 | |
| Week Change: 17.6393% Year-to-date Change: 0.0% | |
| PVG Links: Profile News Message Board | |
| Charts:- Daily , Weekly | |
| Add PVG to Watchlist: View: Get Complete PVG Trend Analysis ➞ | |
 | LICY Li-Cycle Holdings Corp. |
| Sector: Industrials | |
| SubSector: Waste Management | |
| MarketCap: 959 Millions | |
| Recent Price: 0.84 Market Intelligence Score: 20 | |
| Day Percent Change: -4.06143% Day Change: -9999 | |
| Week Change: -13.0619% Year-to-date Change: -64.4% | |
| LICY Links: Profile News Message Board | |
| Charts:- Daily , Weekly | |
| Add LICY to Watchlist: View: Get Complete LICY Trend Analysis ➞ | |
 | CRON Cronos Group Inc |
| Sector: Health Care | |
| SubSector: Drug Manufacturers - Specialty & Generic | |
| MarketCap: 957.35 Millions | |
| Recent Price: 2.59 Market Intelligence Score: 50 | |
| Day Percent Change: 0% Day Change: 0.14 | |
| Week Change: -1.89394% Year-to-date Change: 25.7% | |
| CRON Links: Profile News Message Board | |
| Charts:- Daily , Weekly | |
| Add CRON to Watchlist: View: Get Complete CRON Trend Analysis ➞ | |
 | DCBO Docebo Inc |
| Sector: Technology | |
| SubSector: Software - Application | |
| MarketCap: 923.86 Millions | |
| Recent Price: 27.46 Market Intelligence Score: 50 | |
| Day Percent Change: 1.01159% Day Change: 0.92 | |
| Week Change: -3.13933% Year-to-date Change: -39.4% | |
| DCBO Links: Profile News Message Board | |
| Charts:- Daily , Weekly | |
| Add DCBO to Watchlist: View: Get Complete DCBO Trend Analysis ➞ | |
 | OSB Norbord Inc. |
| Sector: Services & Goods | |
| SubSector: Building Materials Wholesale | |
| MarketCap: 847.243 Millions | |
| Recent Price: 37.02 Market Intelligence Score: 0 | |
| Day Percent Change: -3.66901% Day Change: -9999 | |
| Week Change: -92.3035% Year-to-date Change: 0.0% | |
| OSB Links: Profile News Message Board | |
| Charts:- Daily , Weekly | |
| Add OSB to Watchlist: View: Get Complete OSB Trend Analysis ➞ | |
 | MITL Mitel Networks Corporation |
| Sector: Technology | |
| SubSector: Communication Equipment | |
| MarketCap: 841.98 Millions | |
| Recent Price: 2.32 Market Intelligence Score: 20 | |
| Day Percent Change: 4.5045% Day Change: -9999 | |
| Week Change: -93.7601% Year-to-date Change: 0.0% | |
| MITL Links: Profile News Message Board | |
| Charts:- Daily , Weekly | |
| Add MITL to Watchlist: View: Get Complete MITL Trend Analysis ➞ | |
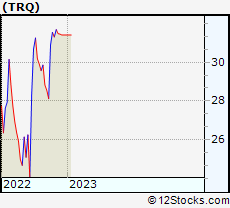 | TRQ Turquoise Hill Resources Ltd. |
| Sector: Materials | |
| SubSector: Copper | |
| MarketCap: 821.257 Millions | |
| Recent Price: 167.45 Market Intelligence Score: 100 | |
| Day Percent Change: 3.40249% Day Change: -9999 | |
| Week Change: 433.11% Year-to-date Change: 0.0% | |
| TRQ Links: Profile News Message Board | |
| Charts:- Daily , Weekly | |
| Add TRQ to Watchlist: View: Get Complete TRQ Trend Analysis ➞ | |
 | PWE Penn West Petroleum Ltd. |
| Sector: Energy | |
| SubSector: Oil & Gas Drilling & Exploration | |
| MarketCap: 818.85 Millions | |
| Recent Price: 1.26 Market Intelligence Score: 10 | |
| Day Percent Change: 0% Day Change: -9999 | |
| Week Change: 0% Year-to-date Change: 0.0% | |
| PWE Links: Profile News Message Board | |
| Charts:- Daily , Weekly | |
| Add PWE to Watchlist: View: Get Complete PWE Trend Analysis ➞ | |
 | PDS Precision Drilling Corp |
| Sector: Energy | |
| SubSector: Oil & Gas Drilling | |
| MarketCap: 774.34 Millions | |
| Recent Price: 58.08 Market Intelligence Score: 80 | |
| Day Percent Change: 1.96629% Day Change: 0.97 | |
| Week Change: -0.445663% Year-to-date Change: -7.9% | |
| PDS Links: Profile News Message Board | |
| Charts:- Daily , Weekly | |
| Add PDS to Watchlist: View: Get Complete PDS Trend Analysis ➞ | |
 | KLDX Klondex Mines Ltd. |
| Sector: Materials | |
| SubSector: Industrial Metals & Minerals | |
| MarketCap: 755.11 Millions | |
| Recent Price: 56.07 Market Intelligence Score: 50 | |
| Day Percent Change: -0.953895% Day Change: -9999 | |
| Week Change: 16.9099% Year-to-date Change: 0.0% | |
| KLDX Links: Profile News Message Board | |
| Charts:- Daily , Weekly | |
| Add KLDX to Watchlist: View: Get Complete KLDX Trend Analysis ➞ | |
 | CSIQ Canadian Solar Inc |
| Sector: Technology | |
| SubSector: Solar | |
| MarketCap: 748.08 Millions | |
| Recent Price: 15.20 Market Intelligence Score: 100 | |
| Day Percent Change: -0.393185% Day Change: -2.37 | |
| Week Change: 14.2857% Year-to-date Change: 26.2% | |
| CSIQ Links: Profile News Message Board | |
| Charts:- Daily , Weekly | |
| Add CSIQ to Watchlist: View: Get Complete CSIQ Trend Analysis ➞ | |
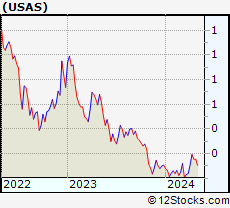 | USAS Americas Gold and Silver Corp |
| Sector: Materials | |
| SubSector: Other Industrial Metals & Mining | |
| MarketCap: 747.29 Millions | |
| Recent Price: 3.95 Market Intelligence Score: 100 | |
| Day Percent Change: 2.06718% Day Change: 0.03 | |
| Week Change: 20.7951% Year-to-date Change: 912.8% | |
| USAS Links: Profile News Message Board | |
| Charts:- Daily , Weekly | |
| Add USAS to Watchlist: View: Get Complete USAS Trend Analysis ➞ | |
| To view more stocks, click on Next / Previous arrows or select different range: 0 - 25 , 25 - 50 , 50 - 75 , 75 - 100 , 100 - 125 , 125 - 150 , 150 - 175 , 175 - 200 , 200 - 225 , 225 - 250 , 250 - 275 , 275 - 300 , 300 - 325 | ||
| Click To Change The Sort Order: By Market Cap or Company Size Performance: Year-to-date, Week and Day | |
| Select Chart Type: | ||
 Best Stocks Today 12Stocks.com |
© 2025 12Stocks.com Terms & Conditions Privacy Contact Us
All Information Provided Only For Education And Not To Be Used For Investing or Trading. See Terms & Conditions


One More Thing ... Get Best Stocks Delivered Daily!
Never Ever Miss A Move With Our Top Ten Stocks Lists
Find Best Stocks In Any Market - Bull or Bear Market
Take A Peek At Our Top Ten Stocks Lists: Daily, Weekly, Year-to-Date & Top Trends
Find Best Stocks In Any Market - Bull or Bear Market
Take A Peek At Our Top Ten Stocks Lists: Daily, Weekly, Year-to-Date & Top Trends
Latin America Stocks With Best Up Trends [0-bearish to 100-bullish]: Lithium Americas[100], Ballard Power[100], Tower[100], Northern Dynasty[100], Shopify [100], McEwen [100], Pembina Pipeline[100], Vermilion Energy[100], Transalta Corp[100], Silvercorp Metals[100], Hudbay Minerals[100]
Best Latin America Stocks Year-to-Date:
Americas Gold[912.82%], Avino Silver[463.366%], Tower[297.028%], Gold Royalty[208.871%], Lithium Americas[195.425%], EMX Royalty[185.632%], New Gold[180.534%], Kinross Gold[154.541%], Celestica [151.069%], Iamgold Corp[137.993%], Silvercorp Metals[122.866%] Best Latin America Stocks This Week:
Companhia Brasileira[18587.4%], Cosan [16415.2%], Crescent Point[4066.17%], Golden Star[1837.95%], Grupo Financiero[1283.52%], Alexco Resource[690.301%], Yamana Gold[625.812%], Novelion [579.167%], Turquoise Hill[433.11%], Enerplus [415.601%], Nevsun Resources[402.516%] Best Latin America Stocks Daily:
Lithium Americas[31.7784%], Ballard Power[22.7826%], Tower[11.976%], Northern Dynasty[8.19672%], Platinum [8.13953%], Novelion [7.37813%], Grupo Simec[7.34127%], Shopify [6.50363%], McEwen [6.02923%], Pembina Pipeline[6.02015%], Vermilion Energy[5.81542%]