
 Login Sign Up


| |||||
 |  | ||||

| 12Stocks.com Market Intelligence |
Best Latin America Stocks
|
|
| Quick Read: Top Latin America Stocks By Performances & Trends: Daily, Weekly, Year-to-Date, Market Cap (Size) & Technical Trends | |||
| Best Latin America Views: Quick Browse View, Summary & Slide Show | |||
| 12Stocks.com Latin America Stocks Performances & Trends Daily | |||||||||
|
|  The overall market intelligence score is 100 (0-bearish to 100-bullish) which puts Latin America index in short term bullish trend. The market intelligence score from previous trading session is 80 and hence an improvement of trend.
| ||||||||
Here are the market intelligence trend scores of the most requested Latin America stocks at 12Stocks.com (click stock name for detailed review):
| |||||||||||||||||||||
| Scroll down this page for most comprehensive review of Latin America stocks by performance, trends, technical analysis, charts, fund plays & more | |||||||||||||||||||||


| 12Stocks.com: Top Performing Latin America Index Stocks | ||||||||||||||||||||||||||||||||||||||||||||||||
 The top performing Latin America Index stocks year to date are
Now, more recently, over last week, the top performing Latin America Index stocks on the move are


|
||||||||||||||||||||||||||||||||||||||||||||||||
| 12Stocks.com: Investing in Latin America Index with Stocks | |
|
The following table helps investors and traders sort through current performance and trends (as measured by market intelligence score) of various
stocks in the Latin America Index. Quick View: Move mouse or cursor over stock symbol (ticker) to view short-term technical chart and over stock name to view long term chart. Click on  to add stock symbol to your watchlist and to add stock symbol to your watchlist and  to view watchlist. Click on any ticker or stock name for detailed market intelligence report for that stock. to view watchlist. Click on any ticker or stock name for detailed market intelligence report for that stock. |
12Stocks.com Performance of Stocks in Latin America Index
| Ticker | Stock Name | Watchlist | Category | Recent Price | Market Intelligence Score | Change % | YTD Change% |
| BLDP | Ballard Power |   | Industrials | 2.02 | 70 | -0.53% | 13.86% |
| TRP | TC Energy | | Energy | 52.06 | 60 | -0.67% | 13.54% |
| VTMX | Vesta Financials | | Financials | 27.46 | 63 | -0.21% | 12.64% |
| PLG | Platinum | | Materials | 1.60 | 70 | 3.60% | 12.50% |
| ACB | Aurora Cannabis | | Health Care | 5.42 | 40 | 1.27% | 12.47% |
| BEP | Brookfield Renewable | | Utilities | 25.38 | 20 | 0.16% | 12.24% |
| KOF | Coca-Cola FEMSA | | Consumer Staples | 84.99 | 0 | 2.39% | 12.08% |
| SU | Suncor Energy | | Energy | 41.30 | 60 | 1.14% | 11.88% |
| TRX | Tanzanian Gold | | Materials | 0.37 | 100 | 1.52% | 10.85% |
| GOOS | Canada Goose | | Consumer Staples | 12.98 | 90 | -0.63% | 10.77% |
| BAM | Brookfield Asset | | Financials | 60.16 | 10 | -0.61% | 10.62% |
| ONCY | Oncolytics Biotech | | Health Care | 1.04 | 50 | 0.00% | 10.53% |
| BNS | Bank of Nova Scotia | | Financials | 62.46 | 100 | -0.18% | 10.16% |
| DOOO | BRP | | Consumer Staples | 62.98 | 90 | -1.86% | 9.69% |
| FSV | FirstService | | Financials | 201.20 | 80 | -0.99% | 9.37% |
| MGA | Magna | | Services & Goods | 45.90 | 80 | -0.27% | 8.61% |
| DNN | Denison Mines | | Materials | 2.32 | 100 | 1.56% | 8.33% |
| TCX | Tucows | | Technology | 18.28 | 10 | -2.47% | 8.11% |
| EPIX | ESSA Pharma | | Health Care | 0.24 | 0 | -0.52% | 7.26% |
| BUR | Burcon Nutrascience | | Health Care | 14.00 | 0 | -1.59% | 7.18% |
| FMX | Fomento Economico | | Consumer Staples | 86.64 | 20 | 0.89% | 6.80% |
| CAE | CAE | | Industrials | 26.94 | 10 | 0.37% | 5.91% |
| PBA | Pembina Pipeline | | Energy | 37.77 | 90 | 0.64% | 5.08% |
| LND | BrasilAgro - | | Financials | 3.94 | 90 | 0.00% | 4.71% |
| CVE | Cenovus Energy | | Energy | 16.61 | 50 | 1.54% | 2.40% |
| To view more stocks, click on Next / Previous arrows or select different range: 0 - 25 , 25 - 50 , 50 - 75 , 75 - 100 , 100 - 125 , 125 - 150 , 150 - 175 , 175 - 200 , 200 - 225 | ||
 | Click To Change The Sort Order: By Market Cap or Company Size Performance: Year-to-date, Week and Day |  |
| Detailed Overview Of Latin America Stocks |
| Latin America Technical Overview, Leaders & Laggards, Top Latin America ETF Funds & Detailed Latin America Stocks List, Charts, Trends & More |
| Latin America: Technical Analysis, Trends & YTD Performance | |
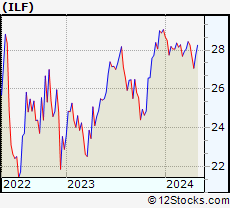
 ILF Weekly Chart |
|
| Long Term Trend: Very Good | |
| Medium Term Trend: Very Good | |
 ILF Daily Chart |
|
| Short Term Trend: Very Good | |
| Overall Trend Score: 100 | |
| YTD Performance: 21.97% | |
| **Trend Scores & Views Are Only For Educational Purposes And Not For Investing | |
| 12Stocks.com: Investing in Latin America Index using Exchange Traded Funds | |
|
The following table shows list of key exchange traded funds (ETF) that
help investors play Latin America stock market. For detailed view, check out our ETF Funds section of our website. Quick View: Move mouse or cursor over ETF symbol (ticker) to view short-term technical chart and over ETF name to view long term chart. Click on ticker or stock name for detailed view. Click on to add stock symbol to your watchlist and to view watchlist. |
12Stocks.com List of ETFs that track Latin America Index
| Ticker | ETF Name | Watchlist | Recent Price | Market Intelligence Score | Change % | Week % | Year-to-date % |
| ILF | Latin America 40 | | 27.36 | 100 | 0.7 | 2.36 | 21.97% |
| EWC | Canada | | 48.79 | 100 | 1.57 | 1.59 | 17.28% |
| FLN | Latin America AlphaDEX | | 20.48 | 100 | 0.31 | -0.55 | 33.28% |
| EWZ | Brazil | | 29.50 | 100 | 3.33 | 1.35 | 14.93% |
| EWW | Mexico | | 61.94 | 100 | 2 | 2.35 | 30.49% |
| ARGT | Argentina | | 80.15 | 40 | 0.48 | -2.82 | -1.29% |
| EWZS | Brazil Small-Cap | | 13.40 | 100 | -0.6 | -2.06 | 35.19% |
| BRF | Brazil Small-Cap | | 15.65 | 100 | -0.22 | -2.19 | 32.59% |
| BZQ | Short Brazil | | 10.00 | 0 | -0.06 | 1.69 | -39.37% |
| BRZU | Brazil Bull 3X | | 67.10 | 90 | -0.12 | -1.98 | 45.21% |
| 12Stocks.com: Charts, Trends, Fundamental Data and Performances of Latin America Stocks | |
|
We now take in-depth look at all Latin America stocks including charts, multi-period performances and overall trends (as measured by market intelligence score). One can sort Latin America stocks (click link to choose) by Daily, Weekly and by Year-to-Date performances. Also, one can sort by size of the company or by market capitalization. |
| Select Your Default Chart Type: | |||||
| |||||
| Click on stock symbol or name for detailed view. Click on to add stock symbol to your watchlist and to view watchlist. Quick View: Move mouse or cursor over "Daily" to quickly view daily technical stock chart and over "Weekly" to view weekly technical stock chart. | |||||

 | BLDP Ballard Power Systems Inc. |
| Sector: Industrials | |
| SubSector: Industrial Electrical Equipment | |
| MarketCap: 2124.79 Millions | |
| Recent Price: 2.02 Market Intelligence Score: 70 | |
| Day Percent Change: -0.53% Day Change: -0.01 | |
| Week Change: 3.28% Year-to-date Change: 13.9% | |
| BLDP Links: Profile News Message Board | |
| Charts:- Daily , Weekly | |
| Add BLDP to Watchlist: View: Get Complete BLDP Trend Analysis ➞ | |
 | TRP TC Energy Corporation |
| Sector: Energy | |
| SubSector: Oil & Gas Pipelines | |
| MarketCap: 44071.1 Millions | |
| Recent Price: 52.06 Market Intelligence Score: 60 | |
| Day Percent Change: -0.67% Day Change: -0.35 | |
| Week Change: 0.59% Year-to-date Change: 13.5% | |
| TRP Links: Profile News Message Board | |
| Charts:- Daily , Weekly | |
| Add TRP to Watchlist: View: Get Complete TRP Trend Analysis ➞ | |
 | VTMX Vesta Financials Corp SAB de CV |
| Sector: Financials | |
| SubSector: REIT - Industrial | |
| MarketCap: 2270 Millions | |
| Recent Price: 27.46 Market Intelligence Score: 63 | |
| Day Percent Change: -0.21% Day Change: -0.06 | |
| Week Change: -1.3% Year-to-date Change: 12.6% | |
| VTMX Links: Profile News Message Board | |
| Charts:- Daily , Weekly | |
| Add VTMX to Watchlist: View: Get Complete VTMX Trend Analysis ➞ | |
 | PLG Platinum Group Metals Ltd. |
| Sector: Materials | |
| SubSector: Industrial Metals & Minerals | |
| MarketCap: 77.591 Millions | |
| Recent Price: 1.60 Market Intelligence Score: 70 | |
| Day Percent Change: 3.6% Day Change: 0.05 | |
| Week Change: -5.88% Year-to-date Change: 12.5% | |
| PLG Links: Profile News Message Board | |
| Charts:- Daily , Weekly | |
| Add PLG to Watchlist: View: Get Complete PLG Trend Analysis ➞ | |
 | ACB Aurora Cannabis Inc. |
| Sector: Health Care | |
| SubSector: Drug Manufacturers - Other | |
| MarketCap: 853.333 Millions | |
| Recent Price: 5.42 Market Intelligence Score: 40 | |
| Day Percent Change: 1.27% Day Change: 0.06 | |
| Week Change: -11.32% Year-to-date Change: 12.5% | |
| ACB Links: Profile News Message Board | |
| Charts:- Daily , Weekly | |
| Add ACB to Watchlist: View: Get Complete ACB Trend Analysis ➞ | |
 | BEP Brookfield Renewable Partners L.P. |
| Sector: Utilities | |
| SubSector: Diversified Utilities | |
| MarketCap: 6419.9 Millions | |
| Recent Price: 25.38 Market Intelligence Score: 20 | |
| Day Percent Change: 0.16% Day Change: 0.04 | |
| Week Change: 1.85% Year-to-date Change: 12.2% | |
| BEP Links: Profile News Message Board | |
| Charts:- Daily , Weekly | |
| Add BEP to Watchlist: View: Get Complete BEP Trend Analysis ➞ | |
 | KOF Coca-Cola FEMSA, S.A.B. de C.V. |
| Sector: Consumer Staples | |
| SubSector: Beverages - Soft Drinks | |
| MarketCap: 2258.9 Millions | |
| Recent Price: 84.99 Market Intelligence Score: 0 | |
| Day Percent Change: 2.39% Day Change: 2 | |
| Week Change: 2.38% Year-to-date Change: 12.1% | |
| KOF Links: Profile News Message Board | |
| Charts:- Daily , Weekly | |
| Add KOF to Watchlist: View: Get Complete KOF Trend Analysis ➞ | |
 | SU Suncor Energy Inc. |
| Sector: Energy | |
| SubSector: Independent Oil & Gas | |
| MarketCap: 21550.6 Millions | |
| Recent Price: 41.30 Market Intelligence Score: 60 | |
| Day Percent Change: 1.14% Day Change: 0.44 | |
| Week Change: 0.13% Year-to-date Change: 11.9% | |
| SU Links: Profile News Message Board | |
| Charts:- Daily , Weekly | |
| Add SU to Watchlist: View: Get Complete SU Trend Analysis ➞ | |
 | TRX Tanzanian Gold Corporation |
| Sector: Materials | |
| SubSector: Gold | |
| MarketCap: 95.9619 Millions | |
| Recent Price: 0.37 Market Intelligence Score: 100 | |
| Day Percent Change: 1.52% Day Change: 0.01 | |
| Week Change: -4.97% Year-to-date Change: 10.9% | |
| TRX Links: Profile News Message Board | |
| Charts:- Daily , Weekly | |
| Add TRX to Watchlist: View: Get Complete TRX Trend Analysis ➞ | |
 | GOOS Canada Goose Holdings Inc. |
| Sector: Consumer Staples | |
| SubSector: Textile - Apparel Clothing | |
| MarketCap: 881.465 Millions | |
| Recent Price: 12.98 Market Intelligence Score: 90 | |
| Day Percent Change: -0.63% Day Change: -0.07 | |
| Week Change: -0.18% Year-to-date Change: 10.8% | |
| GOOS Links: Profile News Message Board | |
| Charts:- Daily , Weekly | |
| Add GOOS to Watchlist: View: Get Complete GOOS Trend Analysis ➞ | |
 | BAM Brookfield Asset Management Inc. |
| Sector: Financials | |
| SubSector: Real Estate Development | |
| MarketCap: 47134.9 Millions | |
| Recent Price: 60.16 Market Intelligence Score: 10 | |
| Day Percent Change: -0.61% Day Change: -0.36 | |
| Week Change: -4.99% Year-to-date Change: 10.6% | |
| BAM Links: Profile News Message Board | |
| Charts:- Daily , Weekly | |
| Add BAM to Watchlist: View: Get Complete BAM Trend Analysis ➞ | |
 | ONCY Oncolytics Biotech Inc. |
| Sector: Health Care | |
| SubSector: Biotechnology | |
| MarketCap: 57.3785 Millions | |
| Recent Price: 1.04 Market Intelligence Score: 50 | |
| Day Percent Change: 0% Day Change: 0 | |
| Week Change: 7.41% Year-to-date Change: 10.5% | |
| ONCY Links: Profile News Message Board | |
| Charts:- Daily , Weekly | |
| Add ONCY to Watchlist: View: Get Complete ONCY Trend Analysis ➞ | |
 | BNS The Bank of Nova Scotia |
| Sector: Financials | |
| SubSector: Money Center Banks | |
| MarketCap: 48742.1 Millions | |
| Recent Price: 62.46 Market Intelligence Score: 100 | |
| Day Percent Change: -0.18% Day Change: -0.1 | |
| Week Change: -0.05% Year-to-date Change: 10.2% | |
| BNS Links: Profile News Message Board | |
| Charts:- Daily , Weekly | |
| Add BNS to Watchlist: View: Get Complete BNS Trend Analysis ➞ | |
 | DOOO BRP Inc. |
| Sector: Consumer Staples | |
| SubSector: Recreational Vehicles | |
| MarketCap: 638.559 Millions | |
| Recent Price: 62.98 Market Intelligence Score: 90 | |
| Day Percent Change: -1.86% Day Change: -1.05 | |
| Week Change: -3.77% Year-to-date Change: 9.7% | |
| DOOO Links: Profile News Message Board | |
| Charts:- Daily , Weekly | |
| Add DOOO to Watchlist: View: Get Complete DOOO Trend Analysis ➞ | |
 | FSV FirstService Corporation |
| Sector: Financials | |
| SubSector: Property Management | |
| MarketCap: 2793.92 Millions | |
| Recent Price: 201.20 Market Intelligence Score: 80 | |
| Day Percent Change: -0.99% Day Change: -1.98 | |
| Week Change: -1.16% Year-to-date Change: 9.4% | |
| FSV Links: Profile News Message Board | |
| Charts:- Daily , Weekly | |
| Add FSV to Watchlist: View: Get Complete FSV Trend Analysis ➞ | |
 | MGA Magna International Inc. |
| Sector: Services & Goods | |
| SubSector: Auto Parts Wholesale | |
| MarketCap: 8967.3 Millions | |
| Recent Price: 45.90 Market Intelligence Score: 80 | |
| Day Percent Change: -0.27% Day Change: -0.12 | |
| Week Change: -1.16% Year-to-date Change: 8.6% | |
| MGA Links: Profile News Message Board | |
| Charts:- Daily , Weekly | |
| Add MGA to Watchlist: View: Get Complete MGA Trend Analysis ➞ | |
 | DNN Denison Mines Corp. |
| Sector: Materials | |
| SubSector: Industrial Metals & Minerals | |
| MarketCap: 154.11 Millions | |
| Recent Price: 2.32 Market Intelligence Score: 100 | |
| Day Percent Change: 1.56% Day Change: 0.03 | |
| Week Change: -3.94% Year-to-date Change: 8.3% | |
| DNN Links: Profile News Message Board | |
| Charts:- Daily , Weekly | |
| Add DNN to Watchlist: View: Get Complete DNN Trend Analysis ➞ | |
 | TCX Tucows Inc. |
| Sector: Technology | |
| SubSector: Internet Information Providers | |
| MarketCap: 557.78 Millions | |
| Recent Price: 18.28 Market Intelligence Score: 10 | |
| Day Percent Change: -2.47% Day Change: -0.47 | |
| Week Change: -2.68% Year-to-date Change: 8.1% | |
| TCX Links: Profile News Message Board | |
| Charts:- Daily , Weekly | |
| Add TCX to Watchlist: View: Get Complete TCX Trend Analysis ➞ | |
 | EPIX ESSA Pharma Inc. |
| Sector: Health Care | |
| SubSector: Biotechnology | |
| MarketCap: 70.5785 Millions | |
| Recent Price: 0.24 Market Intelligence Score: 0 | |
| Day Percent Change: -0.52% Day Change: -0.01 | |
| Week Change: 0% Year-to-date Change: 7.3% | |
| EPIX Links: Profile News Message Board | |
| Charts:- Daily , Weekly | |
| Add EPIX to Watchlist: View: Get Complete EPIX Trend Analysis ➞ | |
 | BUR Burcon Nutrascience Corporation |
| Sector: Health Care | |
| SubSector: Biotechnology | |
| MarketCap: 0 Millions | |
| Recent Price: 14.00 Market Intelligence Score: 0 | |
| Day Percent Change: -1.59% Day Change: -0.22 | |
| Week Change: 0.15% Year-to-date Change: 7.2% | |
| BUR Links: Profile News Message Board | |
| Charts:- Daily , Weekly | |
| Add BUR to Watchlist: View: Get Complete BUR Trend Analysis ➞ | |
 | FMX Fomento Economico Mexicano, S.A.B. de C.V. |
| Sector: Consumer Staples | |
| SubSector: Beverages - Brewers | |
| MarketCap: 22018.7 Millions | |
| Recent Price: 86.64 Market Intelligence Score: 20 | |
| Day Percent Change: 0.89% Day Change: 0.77 | |
| Week Change: 2.9% Year-to-date Change: 6.8% | |
| FMX Links: Profile News Message Board | |
| Charts:- Daily , Weekly | |
| Add FMX to Watchlist: View: Get Complete FMX Trend Analysis ➞ | |
 | CAE CAE Inc. |
| Sector: Industrials | |
| SubSector: Aerospace/Defense Products & Services | |
| MarketCap: 3739.61 Millions | |
| Recent Price: 26.94 Market Intelligence Score: 10 | |
| Day Percent Change: 0.37% Day Change: 0.1 | |
| Week Change: -4.03% Year-to-date Change: 5.9% | |
| CAE Links: Profile News Message Board | |
| Charts:- Daily , Weekly | |
| Add CAE to Watchlist: View: Get Complete CAE Trend Analysis ➞ | |
 | PBA Pembina Pipeline Corporation |
| Sector: Energy | |
| SubSector: Oil & Gas Pipelines | |
| MarketCap: 8813.35 Millions | |
| Recent Price: 37.77 Market Intelligence Score: 90 | |
| Day Percent Change: 0.64% Day Change: 0.24 | |
| Week Change: 3.11% Year-to-date Change: 5.1% | |
| PBA Links: Profile News Message Board | |
| Charts:- Daily , Weekly | |
| Add PBA to Watchlist: View: Get Complete PBA Trend Analysis ➞ | |
 | LND BrasilAgro - Companhia Brasileira de Propriedades Agricolas |
| Sector: Financials | |
| SubSector: Property Management | |
| MarketCap: 157.842 Millions | |
| Recent Price: 3.94 Market Intelligence Score: 90 | |
| Day Percent Change: 0% Day Change: 0 | |
| Week Change: 1.34% Year-to-date Change: 4.7% | |
| LND Links: Profile News Message Board | |
| Charts:- Daily , Weekly | |
| Add LND to Watchlist: View: Get Complete LND Trend Analysis ➞ | |
 | CVE Cenovus Energy Inc. |
| Sector: Energy | |
| SubSector: Oil & Gas Drilling & Exploration | |
| MarketCap: 2369.29 Millions | |
| Recent Price: 16.61 Market Intelligence Score: 50 | |
| Day Percent Change: 1.54% Day Change: 0.23 | |
| Week Change: 0.53% Year-to-date Change: 2.4% | |
| CVE Links: Profile News Message Board | |
| Charts:- Daily , Weekly | |
| Add CVE to Watchlist: View: Get Complete CVE Trend Analysis ➞ | |
| To view more stocks, click on Next / Previous arrows or select different range: 0 - 25 , 25 - 50 , 50 - 75 , 75 - 100 , 100 - 125 , 125 - 150 , 150 - 175 , 175 - 200 , 200 - 225 | ||
| Click To Change The Sort Order: By Market Cap or Company Size Performance: Year-to-date, Week and Day | |
| Select Chart Type: | ||
 Best Stocks Today 12Stocks.com |
© 2025 12Stocks.com Terms & Conditions Privacy Contact Us
All Information Provided Only For Education And Not To Be Used For Investing or Trading. See Terms & Conditions


One More Thing ... Get Best Stocks Delivered Daily!
Never Ever Miss A Move With Our Top Ten Stocks Lists
Find Best Stocks In Any Market - Bull or Bear Market
Take A Peek At Our Top Ten Stocks Lists: Daily, Weekly, Year-to-Date & Top Trends
Find Best Stocks In Any Market - Bull or Bear Market
Take A Peek At Our Top Ten Stocks Lists: Daily, Weekly, Year-to-Date & Top Trends
Latin America Stocks With Best Up Trends [0-bearish to 100-bullish]: Gold Royalty[100], Alamos Gold[100], IAMGOLD [100], New Gold[100], Sandstorm Gold[100], SSR Mining[100], Hudbay Minerals[100], Grupo Aeroportuario[100], Pan American[100], Kinross Gold[100], Eldorado Gold[100]
Best Latin America Stocks Year-to-Date:
Dominion Diamond[207.43%], Gold Royalty[161.16%], SSR Mining[143.1%], New Gold[119.35%], Kinross Gold[111.46%], Vasta Platform[109.75%], Celestica [96.47%], Sandstorm Gold[95.03%], Inter & Co[86.91%], StoneCo [86.07%], NovaGold Resources[78.68%] Best Latin America Stocks This Week:
Dominion Diamond[33.17%], Nu [13.82%], Alamos Gold[9.37%], Novadaq [8%], New Gold[6.67%], Mercer [5.9%], BRF S.A[5.85%], Trilogy Metals[5.77%], IAMGOLD [5.75%], McEwen Mining[5.39%], SSR Mining[5.22%] Best Latin America Stocks Daily:
Dominion Diamond[28.83%], Bioceres Crop[8.89%], Gold Royalty[6.76%], Cronos [5.79%], Vision Marine[5.23%], Algoma Steel[5.05%], Alamos Gold[4.79%], Tilray [4.72%], Vox Royalty[4.72%], OrganiGram [4.67%], Braskem S.A[4.48%]