
 Login Sign Up


| |||||
 |  | ||||

| 12Stocks.com Market Intelligence |
Best Latin America Stocks
|
|
| Quick Read: Top Latin America Stocks By Performances & Trends: Daily, Weekly, Year-to-Date, Market Cap (Size) & Technical Trends | |||
| Best Latin America Views: Quick Browse View, Summary & Slide Show | |||
| 12Stocks.com Latin America Stocks Performances & Trends Daily | |||||||||
|
|  The overall market intelligence score is 80 (0-bearish to 100-bullish) which puts Latin America index in short term neutral to bullish trend. The market intelligence score from previous trading session is 70 and hence an improvement of trend.
| ||||||||
| Here are the market intelligence trend scores of the most requested Latin America stocks at 12Stocks.com (click stock name for detailed review): | |
| Scroll down this page for most comprehensive review of Latin America stocks by performance, trends, technical analysis, charts, fund plays & more | |


| 12Stocks.com: Top Performing Latin America Index Stocks | ||||||||||||||||||||||||||||||||||||||||||||||||
 The top performing Latin America Index stocks year to date are
Now, more recently, over last week, the top performing Latin America Index stocks on the move are


|
||||||||||||||||||||||||||||||||||||||||||||||||
| 12Stocks.com: Investing in Latin America Index with Stocks | |
|
The following table helps investors and traders sort through current performance and trends (as measured by market intelligence score) of various
stocks in the Latin America Index. Quick View: Move mouse or cursor over stock symbol (ticker) to view short-term technical chart and over stock name to view long term chart. Click on  to add stock symbol to your watchlist and to add stock symbol to your watchlist and  to view watchlist. Click on any ticker or stock name for detailed market intelligence report for that stock. to view watchlist. Click on any ticker or stock name for detailed market intelligence report for that stock. |
12Stocks.com Performance of Stocks in Latin America Index
| Ticker | Stock Name | Watchlist | Category | Recent Price | Market Intelligence Score | Change % | YTD Change% |
| CGC | Canopy Growth |   | Health Care | 1.80 | 60 | 2.48% | -54.74% |
| PAAS | Pan American | | Materials | 33.92 | 60 | 2.46% | 59.81% |
| BTG | B2Gold | | Materials | 4.13 | 60 | 2.36% | 61.91% |
| AG | First Majestic | | Materials | 9.14 | 60 | 2.11% | 58.96% |
| CVE | Cenovus Energy | | Energy | 16.61 | 60 | 1.54% | 2.40% |
| CCJ | Cameco | | Materials | 77.39 | 60 | 1.36% | 39.00% |
| SNDL | Sundial Growers | | Health Care | 2.68 | 60 | 1.36% | 25.14% |
| SU | Suncor Energy | | Energy | 41.30 | 60 | 1.14% | 11.88% |
| PBR | Petroleo Brasileiro | | Energy | 12.38 | 60 | 0.57% | -8.35% |
| THTX | Thera | | Health Care | 3.24 | 60 | 0.15% | 79.56% |
| FSI | Flexible | | Materials | 11.25 | 60 | 0.00% | 122.51% |
| BB | BlackBerry | | Technology | 3.83 | 60 | 0.00% | -3.44% |
| ONCY | Oncolytics Biotech | | Health Care | 1.04 | 60 | 0.00% | 10.53% |
| MFC | Manulife Financial | | Financials | 30.75 | 60 | -0.07% | -0.08% |
| RC | Ready Capital | | Financials | 4.26 | 60 | -3.64% | -42.60% |
| BLCO | Bausch + | | Health Care | 14.63 | 53 | -0.28% | -19.71% |
| ACHV | Achieve Life | | Health Care | 2.98 | 50 | 12.02% | -17.90% |
| CRON | Cronos | | Health Care | 2.60 | 50 | 5.79% | 26.73% |
| ASTL | Algoma Steel | | Materials | 4.87 | 50 | 5.05% | -52.42% |
| TLRY | Tilray | | Health Care | 1.38 | 50 | 4.72% | -16.54% |
| VOXR | Vox Royalty | | Materials | 3.68 | 50 | 4.72% | 43.55% |
| VET | Vermilion Energy | | Energy | 7.55 | 50 | 1.97% | -20.89% |
| MERC | Mercer | | Consumer Staples | 3.33 | 50 | 1.89% | -48.64% |
| AMX | America Movil | | Technology | 19.99 | 50 | 1.68% | 37.88% |
| BIOA | BioAmber | | Materials | 4.93 | 50 | 1.35% | -22.28% |
| To view more stocks, click on Next / Previous arrows or select different range: 0 - 25 , 25 - 50 , 50 - 75 , 75 - 100 , 100 - 125 , 125 - 150 , 150 - 175 , 175 - 200 , 200 - 225 | ||
 | Click To Change The Sort Order: By Market Cap or Company Size Performance: Year-to-date, Week and Day |  |
| Detailed Overview Of Latin America Stocks |
| Latin America Technical Overview, Leaders & Laggards, Top Latin America ETF Funds & Detailed Latin America Stocks List, Charts, Trends & More |
| Latin America: Technical Analysis, Trends & YTD Performance | |
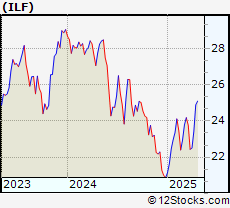
 ILF Weekly Chart |
|
| Long Term Trend: Very Good | |
| Medium Term Trend: Very Good | |
 ILF Daily Chart |
|
| Short Term Trend: Very Good | |
| Overall Trend Score: 80 | |
| YTD Performance: 21.12% | |
| **Trend Scores & Views Are Only For Educational Purposes And Not For Investing | |
| 12Stocks.com: Investing in Latin America Index using Exchange Traded Funds | |
|
The following table shows list of key exchange traded funds (ETF) that
help investors play Latin America stock market. For detailed view, check out our ETF Funds section of our website. Quick View: Move mouse or cursor over ETF symbol (ticker) to view short-term technical chart and over ETF name to view long term chart. Click on ticker or stock name for detailed view. Click on to add stock symbol to your watchlist and to view watchlist. |
12Stocks.com List of ETFs that track Latin America Index
| Ticker | ETF Name | Watchlist | Recent Price | Market Intelligence Score | Change % | Week % | Year-to-date % |
| ILF | Latin America 40 | | 27.17 | 80 | 0.67 | 0.26 | 21.12% |
| EWC | Canada | | 48.79 | 100 | 1.57 | 1.59 | 17.28% |
| FLN | Latin America AlphaDEX | | 20.48 | 100 | 0.31 | -0.55 | 33.28% |
| EWZ | Brazil | | 29.50 | 70 | 3.33 | 1.35 | 14.93% |
| EWW | Mexico | | 61.94 | 100 | 2 | 2.35 | 30.49% |
| ARGT | Argentina | | 80.15 | 30 | 0.48 | -2.82 | -1.29% |
| EWZS | Brazil Small-Cap | | 13.40 | 90 | -0.6 | -2.06 | 35.19% |
| BRF | Brazil Small-Cap | | 15.65 | 90 | -0.22 | -2.19 | 32.59% |
| BZQ | Short Brazil | | 10.00 | 30 | -0.06 | 1.69 | -39.37% |
| BRZU | Brazil Bull 3X | | 67.10 | 80 | -0.12 | -1.98 | 45.21% |
| 12Stocks.com: Charts, Trends, Fundamental Data and Performances of Latin America Stocks | |
|
We now take in-depth look at all Latin America stocks including charts, multi-period performances and overall trends (as measured by market intelligence score). One can sort Latin America stocks (click link to choose) by Daily, Weekly and by Year-to-Date performances. Also, one can sort by size of the company or by market capitalization. |
| Select Your Default Chart Type: | |||||
| |||||
| Click on stock symbol or name for detailed view. Click on to add stock symbol to your watchlist and to view watchlist. Quick View: Move mouse or cursor over "Daily" to quickly view daily technical stock chart and over "Weekly" to view weekly technical stock chart. | |||||

 | CGC Canopy Growth Corporation |
| Sector: Health Care | |
| SubSector: Drug Manufacturers - Other | |
| MarketCap: 4136.33 Millions | |
| Recent Price: 1.80 Market Intelligence Score: 60 | |
| Day Percent Change: 2.48% Day Change: 0.03 | |
| Week Change: -16.78% Year-to-date Change: -54.7% | |
| CGC Links: Profile News Message Board | |
| Charts:- Daily , Weekly | |
| Add CGC to Watchlist: View: Get Complete CGC Trend Analysis ➞ | |
 | PAAS Pan American Silver Corp. |
| Sector: Materials | |
| SubSector: Silver | |
| MarketCap: 2832.56 Millions | |
| Recent Price: 33.92 Market Intelligence Score: 60 | |
| Day Percent Change: 2.46% Day Change: 0.77 | |
| Week Change: 2.01% Year-to-date Change: 59.8% | |
| PAAS Links: Profile News Message Board | |
| Charts:- Daily , Weekly | |
| Add PAAS to Watchlist: View: Get Complete PAAS Trend Analysis ➞ | |
 | BTG B2Gold Corp. |
| Sector: Materials | |
| SubSector: Gold | |
| MarketCap: 2792.39 Millions | |
| Recent Price: 4.13 Market Intelligence Score: 60 | |
| Day Percent Change: 2.36% Day Change: 0.09 | |
| Week Change: 1.83% Year-to-date Change: 61.9% | |
| BTG Links: Profile News Message Board | |
| Charts:- Daily , Weekly | |
| Add BTG to Watchlist: View: Get Complete BTG Trend Analysis ➞ | |
 | AG First Majestic Silver Corp. |
| Sector: Materials | |
| SubSector: Silver | |
| MarketCap: 1128.56 Millions | |
| Recent Price: 9.14 Market Intelligence Score: 60 | |
| Day Percent Change: 2.11% Day Change: 0.18 | |
| Week Change: -1.69% Year-to-date Change: 59.0% | |
| AG Links: Profile News Message Board | |
| Charts:- Daily , Weekly | |
| Add AG to Watchlist: View: Get Complete AG Trend Analysis ➞ | |
 | CVE Cenovus Energy Inc. |
| Sector: Energy | |
| SubSector: Oil & Gas Drilling & Exploration | |
| MarketCap: 2369.29 Millions | |
| Recent Price: 16.61 Market Intelligence Score: 60 | |
| Day Percent Change: 1.54% Day Change: 0.23 | |
| Week Change: 0.53% Year-to-date Change: 2.4% | |
| CVE Links: Profile News Message Board | |
| Charts:- Daily , Weekly | |
| Add CVE to Watchlist: View: Get Complete CVE Trend Analysis ➞ | |
 | CCJ Cameco Corporation |
| Sector: Materials | |
| SubSector: Industrial Metals & Minerals | |
| MarketCap: 2722.9 Millions | |
| Recent Price: 77.39 Market Intelligence Score: 60 | |
| Day Percent Change: 1.36% Day Change: 0.96 | |
| Week Change: -5.45% Year-to-date Change: 39.0% | |
| CCJ Links: Profile News Message Board | |
| Charts:- Daily , Weekly | |
| Add CCJ to Watchlist: View: Get Complete CCJ Trend Analysis ➞ | |
 | SNDL Sundial Growers Inc. |
| Sector: Health Care | |
| SubSector: Drug Manufacturers - Other | |
| MarketCap: 94.4033 Millions | |
| Recent Price: 2.68 Market Intelligence Score: 60 | |
| Day Percent Change: 1.36% Day Change: 0.03 | |
| Week Change: 6.16% Year-to-date Change: 25.1% | |
| SNDL Links: Profile News Message Board | |
| Charts:- Daily , Weekly | |
| Add SNDL to Watchlist: View: Get Complete SNDL Trend Analysis ➞ | |
 | SU Suncor Energy Inc. |
| Sector: Energy | |
| SubSector: Independent Oil & Gas | |
| MarketCap: 21550.6 Millions | |
| Recent Price: 41.30 Market Intelligence Score: 60 | |
| Day Percent Change: 1.14% Day Change: 0.44 | |
| Week Change: 0.13% Year-to-date Change: 11.9% | |
| SU Links: Profile News Message Board | |
| Charts:- Daily , Weekly | |
| Add SU to Watchlist: View: Get Complete SU Trend Analysis ➞ | |
 | PBR Petroleo Brasileiro S.A. - Petrobras |
| Sector: Energy | |
| SubSector: Oil & Gas Drilling & Exploration | |
| MarketCap: 38939.2 Millions | |
| Recent Price: 12.38 Market Intelligence Score: 60 | |
| Day Percent Change: 0.57% Day Change: 0.07 | |
| Week Change: -0.16% Year-to-date Change: -8.4% | |
| PBR Links: Profile News Message Board | |
| Charts:- Daily , Weekly | |
| Add PBR to Watchlist: View: Get Complete PBR Trend Analysis ➞ | |
 | THTX Theratechnologies Inc. |
| Sector: Health Care | |
| SubSector: Drugs - Generic | |
| MarketCap: 123.185 Millions | |
| Recent Price: 3.24 Market Intelligence Score: 60 | |
| Day Percent Change: 0.15% Day Change: 0 | |
| Week Change: 0.93% Year-to-date Change: 79.6% | |
| THTX Links: Profile News Message Board | |
| Charts:- Daily , Weekly | |
| Add THTX to Watchlist: View: Get Complete THTX Trend Analysis ➞ | |
 | FSI Flexible Solutions International Inc. |
| Sector: Materials | |
| SubSector: Specialty Chemicals | |
| MarketCap: 14.3357 Millions | |
| Recent Price: 11.25 Market Intelligence Score: 60 | |
| Day Percent Change: 0% Day Change: 0 | |
| Week Change: 3.97% Year-to-date Change: 122.5% | |
| FSI Links: Profile News Message Board | |
| Charts:- Daily , Weekly | |
| Add FSI to Watchlist: View: Get Complete FSI Trend Analysis ➞ | |
 | BB BlackBerry Limited |
| Sector: Technology | |
| SubSector: Communication Equipment | |
| MarketCap: 2100.39 Millions | |
| Recent Price: 3.83 Market Intelligence Score: 60 | |
| Day Percent Change: 0% Day Change: 0 | |
| Week Change: -1.08% Year-to-date Change: -3.4% | |
| BB Links: Profile News Message Board | |
| Charts:- Daily , Weekly | |
| Add BB to Watchlist: View: Get Complete BB Trend Analysis ➞ | |
 | ONCY Oncolytics Biotech Inc. |
| Sector: Health Care | |
| SubSector: Biotechnology | |
| MarketCap: 57.3785 Millions | |
| Recent Price: 1.04 Market Intelligence Score: 60 | |
| Day Percent Change: 0% Day Change: 0 | |
| Week Change: 7.41% Year-to-date Change: 10.5% | |
| ONCY Links: Profile News Message Board | |
| Charts:- Daily , Weekly | |
| Add ONCY to Watchlist: View: Get Complete ONCY Trend Analysis ➞ | |
 | MFC Manulife Financial Corporation |
| Sector: Financials | |
| SubSector: Life Insurance | |
| MarketCap: 22188.7 Millions | |
| Recent Price: 30.75 Market Intelligence Score: 60 | |
| Day Percent Change: -0.07% Day Change: -0.02 | |
| Week Change: -1.73% Year-to-date Change: -0.1% | |
| MFC Links: Profile News Message Board | |
| Charts:- Daily , Weekly | |
| Add MFC to Watchlist: View: Get Complete MFC Trend Analysis ➞ | |
 | RC Ready Capital Corporation |
| Sector: Financials | |
| SubSector: Mortgage Investment | |
| MarketCap: 358.039 Millions | |
| Recent Price: 4.26 Market Intelligence Score: 60 | |
| Day Percent Change: -3.64% Day Change: -0.14 | |
| Week Change: -3.89% Year-to-date Change: -42.6% | |
| RC Links: Profile News Message Board | |
| Charts:- Daily , Weekly | |
| Add RC to Watchlist: View: Get Complete RC Trend Analysis ➞ | |
 | BLCO Bausch + Lomb Corporation |
| Sector: Health Care | |
| SubSector: Medical Instruments & Supplies | |
| MarketCap: 7100 Millions | |
| Recent Price: 14.63 Market Intelligence Score: 53 | |
| Day Percent Change: -0.28% Day Change: -0.04 | |
| Week Change: 2.98% Year-to-date Change: -19.7% | |
| BLCO Links: Profile News Message Board | |
| Charts:- Daily , Weekly | |
| Add BLCO to Watchlist: View: Get Complete BLCO Trend Analysis ➞ | |
 | ACHV Achieve Life Sciences, Inc. |
| Sector: Health Care | |
| SubSector: Biotechnology | |
| MarketCap: 7.32785 Millions | |
| Recent Price: 2.98 Market Intelligence Score: 50 | |
| Day Percent Change: 12.02% Day Change: 0.31 | |
| Week Change: 13.33% Year-to-date Change: -17.9% | |
| ACHV Links: Profile News Message Board | |
| Charts:- Daily , Weekly | |
| Add ACHV to Watchlist: View: Get Complete ACHV Trend Analysis ➞ | |
 | CRON Cronos Group Inc. |
| Sector: Health Care | |
| SubSector: Biotechnology | |
| MarketCap: 1935.95 Millions | |
| Recent Price: 2.60 Market Intelligence Score: 50 | |
| Day Percent Change: 5.79% Day Change: 0.14 | |
| Week Change: 1.59% Year-to-date Change: 26.7% | |
| CRON Links: Profile News Message Board | |
| Charts:- Daily , Weekly | |
| Add CRON to Watchlist: View: Get Complete CRON Trend Analysis ➞ | |
 | ASTL Algoma Steel Group Inc. |
| Sector: Materials | |
| SubSector: Steel | |
| MarketCap: 731 Millions | |
| Recent Price: 4.87 Market Intelligence Score: 50 | |
| Day Percent Change: 5.05% Day Change: 0.22 | |
| Week Change: -1.93% Year-to-date Change: -52.4% | |
| ASTL Links: Profile News Message Board | |
| Charts:- Daily , Weekly | |
| Add ASTL to Watchlist: View: Get Complete ASTL Trend Analysis ➞ | |
 | TLRY Tilray, Inc. |
| Sector: Health Care | |
| SubSector: Drug Manufacturers - Other | |
| MarketCap: 452.533 Millions | |
| Recent Price: 1.38 Market Intelligence Score: 50 | |
| Day Percent Change: 4.72% Day Change: 0.05 | |
| Week Change: -5.93% Year-to-date Change: -16.5% | |
| TLRY Links: Profile News Message Board | |
| Charts:- Daily , Weekly | |
| Add TLRY to Watchlist: View: Get Complete TLRY Trend Analysis ➞ | |
 | VOXR Vox Royalty Corp. |
| Sector: Materials | |
| SubSector: Other Precious Metals & Mining | |
| MarketCap: 154 Millions | |
| Recent Price: 3.68 Market Intelligence Score: 50 | |
| Day Percent Change: 4.72% Day Change: 0.15 | |
| Week Change: 1.83% Year-to-date Change: 43.6% | |
| VOXR Links: Profile News Message Board | |
| Charts:- Daily , Weekly | |
| Add VOXR to Watchlist: View: Get Complete VOXR Trend Analysis ➞ | |
 | VET Vermilion Energy Inc. |
| Sector: Energy | |
| SubSector: Oil & Gas Drilling & Exploration | |
| MarketCap: 335.839 Millions | |
| Recent Price: 7.55 Market Intelligence Score: 50 | |
| Day Percent Change: 1.97% Day Change: 0.14 | |
| Week Change: -0.82% Year-to-date Change: -20.9% | |
| VET Links: Profile News Message Board | |
| Charts:- Daily , Weekly | |
| Add VET to Watchlist: View: Get Complete VET Trend Analysis ➞ | |
 | MERC Mercer International Inc. |
| Sector: Consumer Staples | |
| SubSector: Paper & Paper Products | |
| MarketCap: 509.003 Millions | |
| Recent Price: 3.33 Market Intelligence Score: 50 | |
| Day Percent Change: 1.89% Day Change: 0.06 | |
| Week Change: 5.9% Year-to-date Change: -48.6% | |
| MERC Links: Profile News Message Board | |
| Charts:- Daily , Weekly | |
| Add MERC to Watchlist: View: Get Complete MERC Trend Analysis ➞ | |
 | AMX America Movil, S.A.B. de C.V. |
| Sector: Technology | |
| SubSector: Wireless Communications | |
| MarketCap: 44726.6 Millions | |
| Recent Price: 19.99 Market Intelligence Score: 50 | |
| Day Percent Change: 1.68% Day Change: 0.32 | |
| Week Change: 2.97% Year-to-date Change: 37.9% | |
| AMX Links: Profile News Message Board | |
| Charts:- Daily , Weekly | |
| Add AMX to Watchlist: View: Get Complete AMX Trend Analysis ➞ | |
 | BIOA BioAmber Inc. |
| Sector: Materials | |
| SubSector: Chemicals - Major Diversified | |
| MarketCap: 116.06 Millions | |
| Recent Price: 4.93 Market Intelligence Score: 50 | |
| Day Percent Change: 1.35% Day Change: 0.06 | |
| Week Change: 0.9% Year-to-date Change: -22.3% | |
| BIOA Links: Profile News Message Board | |
| Charts:- Daily , Weekly | |
| Add BIOA to Watchlist: View: Get Complete BIOA Trend Analysis ➞ | |
| To view more stocks, click on Next / Previous arrows or select different range: 0 - 25 , 25 - 50 , 50 - 75 , 75 - 100 , 100 - 125 , 125 - 150 , 150 - 175 , 175 - 200 , 200 - 225 | ||
| Click To Change The Sort Order: By Market Cap or Company Size Performance: Year-to-date, Week and Day | |
| Select Chart Type: | ||
 Best Stocks Today 12Stocks.com |
© 2025 12Stocks.com Terms & Conditions Privacy Contact Us
All Information Provided Only For Education And Not To Be Used For Investing or Trading. See Terms & Conditions


One More Thing ... Get Best Stocks Delivered Daily!
Never Ever Miss A Move With Our Top Ten Stocks Lists
Find Best Stocks In Any Market - Bull or Bear Market
Take A Peek At Our Top Ten Stocks Lists: Daily, Weekly, Year-to-Date & Top Trends
Find Best Stocks In Any Market - Bull or Bear Market
Take A Peek At Our Top Ten Stocks Lists: Daily, Weekly, Year-to-Date & Top Trends
Latin America Stocks With Best Up Trends [0-bearish to 100-bullish]: IAMGOLD [100], New Gold[100], SSR Mining[100], Hudbay Minerals[100], Grupo Aeroportuario[100], TELUS [100], Baytex Energy[100], Franco-Nevada [100], CEMEX S.A.B.[100], Osisko Gold[100], Agnico Eagle[100]
Best Latin America Stocks Year-to-Date:
Dominion Diamond[207.43%], Gold Royalty[161.16%], SSR Mining[143.1%], New Gold[119.35%], Kinross Gold[111.46%], Vasta Platform[109.75%], Celestica [96.47%], Sandstorm Gold[95.03%], Inter & Co[86.91%], StoneCo [86.07%], NovaGold Resources[78.68%] Best Latin America Stocks This Week:
Dominion Diamond[33.17%], Nu [13.82%], Alamos Gold[9.37%], Novadaq [8%], New Gold[6.67%], Mercer [5.9%], BRF S.A[5.85%], Trilogy Metals[5.77%], IAMGOLD [5.75%], McEwen Mining[5.39%], SSR Mining[5.22%] Best Latin America Stocks Daily:
Dominion Diamond[28.83%], Bioceres Crop[8.89%], Gold Royalty[6.76%], Cronos [5.79%], Vision Marine[5.23%], Algoma Steel[5.05%], Alamos Gold[4.79%], Tilray [4.72%], Vox Royalty[4.72%], OrganiGram [4.67%], Braskem S.A[4.48%]