
 Login Sign Up


| |||||
 |  | ||||

| 12Stocks.com Market Intelligence |
Best Latin America Stocks
|
|
| Quick Read: Top Latin America Stocks By Performances & Trends: Daily, Weekly, Year-to-Date, Market Cap (Size) & Technical Trends | |||
| Best Latin America Views: Quick Browse View, Summary & Slide Show | |||
| 12Stocks.com Latin America Stocks Performances & Trends Daily | |||||||||
|
|  The overall market intelligence score is 77 (0-bearish to 100-bullish) which puts Latin America index in short term neutral to bullish trend. The market intelligence score from previous trading session is 57 and hence an improvement of trend.
| ||||||||
| Here are the market intelligence trend scores of the most requested Latin America stocks at 12Stocks.com (click stock name for detailed review): | |
| Scroll down this page for most comprehensive review of Latin America stocks by performance, trends, technical analysis, charts, fund plays & more | |


| 12Stocks.com: Top Performing Latin America Index Stocks | ||||||||||||||||||||||||||||||||||||||||||||||||
 The top performing Latin America Index stocks year to date are
Now, more recently, over last week, the top performing Latin America Index stocks on the move are


|
||||||||||||||||||||||||||||||||||||||||||||||||
| 12Stocks.com: Investing in Latin America Index with Stocks | |
|
The following table helps investors and traders sort through current performance and trends (as measured by market intelligence score) of various
stocks in the Latin America Index. Quick View: Move mouse or cursor over stock symbol (ticker) to view short-term technical chart and over stock name to view long term chart. Click on  to add stock symbol to your watchlist and to add stock symbol to your watchlist and  to view watchlist. Click on any ticker or stock name for detailed market intelligence report for that stock. to view watchlist. Click on any ticker or stock name for detailed market intelligence report for that stock. |
12Stocks.com Performance of Stocks in Latin America Index
| Ticker | Stock Name | Watchlist | Category | Recent Price | Market Intelligence Score | Change % | YTD Change% |
| INTR | Inter & Co |   | Financials | 5.32 | 49 | 4.01% | -5.17% |
| RPTX | Repare | | Health Care | 3.46 | 49 | 3.28% | -52.60% |
| BBDO | Banco Bradesco | | Financials | 2.43 | 49 | 2.10% | -23.59% |
| ITUB | Itau Unibanco | | Financials | 6.34 | 49 | 1.44% | -8.78% |
| CSAN | Cosan S.A | | Energy | 11.56 | 49 | -0.26% | -26.63% |
| NAK | Northern Dynasty | | Materials | 0.30 | 43 | 0.07% | -8.13% |
| GROY | Gold Royalty | | Materials | 1.94 | 43 | -1.02% | 34.26% |
| PAAS | Pan American | | Materials | 18.25 | 43 | -0.71% | 11.76% |
| LVRO | Lavoro | | Materials | 6.00 | 42 | 3.63% | -32.43% |
| BIOX | Bioceres Crop | | Industrials | 12.14 | 42 | 2.62% | -11.58% |
| RCI | Rogers | | Technology | 38.43 | 42 | 1.37% | -17.90% |
| DCBO | Docebo | | Technology | 45.64 | 42 | 1.11% | -5.72% |
| LAC | Lithium Americas | | Materials | 4.49 | 42 | 0.00% | -29.84% |
| EPIX | ESSA Pharma | | Health Care | 6.88 | 42 | -1.01% | 5.20% |
| FSV | FirstService | | Financials | 149.54 | 42 | -0.82% | -7.74% |
| AUPH | Aurinia | | Health Care | 5.10 | 42 | -1.35% | -43.27% |
| IMO | Imperial Oil | | Energy | 68.05 | 41 | -0.03% | 18.99% |
| BAM | Brookfield Asset | | Financials | 39.13 | 40 | 1.45% | -2.59% |
| BBD | Banco Bradesco | | Financials | 2.72 | 39 | 0.00% | -22.29% |
| EGO | Eldorado Gold | | Materials | 14.31 | 39 | -2.25% | 10.33% |
| PBR | Petroleo Brasileiro | | Energy | 16.43 | 38 | -5.25% | 2.88% |
| QBTS | D-Wave Quantum | | Technology | 1.41 | 37 | 1.81% | 60.13% |
| BNS | Bank of Nova Scotia | | Financials | 46.85 | 37 | 1.19% | -3.78% |
| VOXR | Vox Royalty | | Materials | 2.00 | 36 | -1.48% | -2.91% |
| BTG | B2Gold | | Materials | 2.50 | 36 | -0.79% | -20.89% |
| To view more stocks, click on Next / Previous arrows or select different range: 0 - 25 , 25 - 50 , 50 - 75 , 75 - 100 , 100 - 125 , 125 - 150 , 150 - 175 , 175 - 200 , 200 - 225 | ||
 | Click To Change The Sort Order: By Market Cap or Company Size Performance: Year-to-date, Week and Day |  |
| Detailed Overview Of Latin America Stocks |
| Latin America Technical Overview, Leaders & Laggards, Top Latin America ETF Funds & Detailed Latin America Stocks List, Charts, Trends & More |
| Latin America: Technical Analysis, Trends & YTD Performance | |
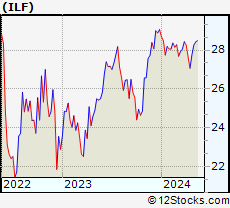
 ILF Weekly Chart |
|
| Long Term Trend: Good | |
| Medium Term Trend: Very Good | |
 ILF Daily Chart |
|
| Short Term Trend: Very Good | |
| Overall Trend Score: 77 | |
| YTD Performance: -2.75% | |
| **Trend Scores & Views Are Only For Educational Purposes And Not For Investing | |
| 12Stocks.com: Investing in Latin America Index using Exchange Traded Funds | |
|
The following table shows list of key exchange traded funds (ETF) that
help investors play Latin America stock market. For detailed view, check out our ETF Funds section of our website. Quick View: Move mouse or cursor over ETF symbol (ticker) to view short-term technical chart and over ETF name to view long term chart. Click on ticker or stock name for detailed view. Click on to add stock symbol to your watchlist and to view watchlist. |
12Stocks.com List of ETFs that track Latin America Index
| Ticker | ETF Name | Watchlist | Recent Price | Market Intelligence Score | Change % | Week % | Year-to-date % |
| ILF | Latin America 40 | | 28.26 | 77 | 1.51 | 1.8 | -2.75% |
| EWC | Canada | | 37.57 | 78 | 0.62 | -0.16 | 2.43% |
| FLN | Latin America AlphaDEX | | 20.08 | 49 | 1.21 | 1.98 | -3.42% |
| EWZ | Brazil | | 32.31 | 64 | 1.67 | 2.44 | -7.58% |
| EWW | Mexico | | 66.80 | 65 | 1.00 | -0.07 | -1.55% |
| ARGT | Argentina | | 61.33 | 100 | 4.73 | 8.88 | 19.46% |
| EWZS | Brazil Small-Cap | | 13.91 | 64 | 3.34 | 3.27 | -7.64% |
| BRF | Brazil Small-Cap | | 15.92 | 64 | 3.04 | 3.04 | -9.48% |
| BZQ | Short Brazil | | 11.48 | 36 | -3.41 | -4.89 | 14.46% |
| BRZU | Brazil Bull 3X | | 84.43 | 64 | 3.18 | 4.75 | -17.93% |
| FBZ | Brazil AlphaDEX | | 11.85 | 54 | 5.71 | 3.31 | -3.04% |
| 12Stocks.com: Charts, Trends, Fundamental Data and Performances of Latin America Stocks | |
|
We now take in-depth look at all Latin America stocks including charts, multi-period performances and overall trends (as measured by market intelligence score). One can sort Latin America stocks (click link to choose) by Daily, Weekly and by Year-to-Date performances. Also, one can sort by size of the company or by market capitalization. |
| Select Your Default Chart Type: | |||||
| |||||
| Click on stock symbol or name for detailed view. Click on to add stock symbol to your watchlist and to view watchlist. Quick View: Move mouse or cursor over "Daily" to quickly view daily technical stock chart and over "Weekly" to view weekly technical stock chart. | |||||

 | INTR Inter & Co, Inc. |
| Sector: Financials | |
| SubSector: Banks - Regional | |
| MarketCap: 1250 Millions | |
| Recent Price: 5.32 Market Intelligence Score: 49 | |
| Day Percent Change: 4.01% Day Change: 0.21 | |
| Week Change: 2.21% Year-to-date Change: -5.2% | |
| INTR Links: Profile News Message Board | |
| Charts:- Daily , Weekly | |
| Add INTR to Watchlist: View: Get Complete INTR Trend Analysis ➞ | |
 | RPTX Repare Therapeutics Inc. |
| Sector: Health Care | |
| SubSector: Biotechnology | |
| MarketCap: 13687 Millions | |
| Recent Price: 3.46 Market Intelligence Score: 49 | |
| Day Percent Change: 3.28% Day Change: 0.11 | |
| Week Change: 8.13% Year-to-date Change: -52.6% | |
| RPTX Links: Profile News Message Board | |
| Charts:- Daily , Weekly | |
| Add RPTX to Watchlist: View: Get Complete RPTX Trend Analysis ➞ | |
 | BBDO Banco Bradesco S.A. |
| Sector: Financials | |
| SubSector: Foreign Regional Banks | |
| MarketCap: 27711.4 Millions | |
| Recent Price: 2.43 Market Intelligence Score: 49 | |
| Day Percent Change: 2.10% Day Change: 0.05 | |
| Week Change: 2.53% Year-to-date Change: -23.6% | |
| BBDO Links: Profile News Message Board | |
| Charts:- Daily , Weekly | |
| Add BBDO to Watchlist: View: Get Complete BBDO Trend Analysis ➞ | |
 | ITUB Itau Unibanco Holding S.A. |
| Sector: Financials | |
| SubSector: Foreign Regional Banks | |
| MarketCap: 48121 Millions | |
| Recent Price: 6.34 Market Intelligence Score: 49 | |
| Day Percent Change: 1.44% Day Change: 0.09 | |
| Week Change: 0.63% Year-to-date Change: -8.8% | |
| ITUB Links: Profile News Message Board | |
| Charts:- Daily , Weekly | |
| Add ITUB to Watchlist: View: Get Complete ITUB Trend Analysis ➞ | |
 | CSAN Cosan S.A. |
| Sector: Energy | |
| SubSector: Oil & Gas Refining & Marketing | |
| MarketCap: 6890 Millions | |
| Recent Price: 11.56 Market Intelligence Score: 49 | |
| Day Percent Change: -0.26% Day Change: -0.03 | |
| Week Change: 1.14% Year-to-date Change: -26.6% | |
| CSAN Links: Profile News Message Board | |
| Charts:- Daily , Weekly | |
| Add CSAN to Watchlist: View: Get Complete CSAN Trend Analysis ➞ | |
 | NAK Northern Dynasty Minerals Ltd. |
| Sector: Materials | |
| SubSector: Industrial Metals & Minerals | |
| MarketCap: 167.01 Millions | |
| Recent Price: 0.30 Market Intelligence Score: 43 | |
| Day Percent Change: 0.07% Day Change: 0.00 | |
| Week Change: 0.68% Year-to-date Change: -8.1% | |
| NAK Links: Profile News Message Board | |
| Charts:- Daily , Weekly | |
| Add NAK to Watchlist: View: Get Complete NAK Trend Analysis ➞ | |
 | GROY Gold Royalty Corp. |
| Sector: Materials | |
| SubSector: Other Precious Metals & Mining | |
| MarketCap: 254 Millions | |
| Recent Price: 1.94 Market Intelligence Score: 43 | |
| Day Percent Change: -1.02% Day Change: -0.02 | |
| Week Change: -9.77% Year-to-date Change: 34.3% | |
| GROY Links: Profile News Message Board | |
| Charts:- Daily , Weekly | |
| Add GROY to Watchlist: View: Get Complete GROY Trend Analysis ➞ | |
 | PAAS Pan American Silver Corp. |
| Sector: Materials | |
| SubSector: Silver | |
| MarketCap: 2832.56 Millions | |
| Recent Price: 18.25 Market Intelligence Score: 43 | |
| Day Percent Change: -0.71% Day Change: -0.13 | |
| Week Change: -4.05% Year-to-date Change: 11.8% | |
| PAAS Links: Profile News Message Board | |
| Charts:- Daily , Weekly | |
| Add PAAS to Watchlist: View: Get Complete PAAS Trend Analysis ➞ | |
 | LVRO Lavoro Limited |
| Sector: Materials | |
| SubSector: Agricultural Inputs | |
| MarketCap: 686 Millions | |
| Recent Price: 6.00 Market Intelligence Score: 42 | |
| Day Percent Change: 3.63% Day Change: 0.21 | |
| Week Change: 2.48% Year-to-date Change: -32.4% | |
| LVRO Links: Profile News Message Board | |
| Charts:- Daily , Weekly | |
| Add LVRO to Watchlist: View: Get Complete LVRO Trend Analysis ➞ | |
 | BIOX Bioceres Crop Solutions Corp. |
| Sector: Industrials | |
| SubSector: Conglomerates | |
| MarketCap: 198.348 Millions | |
| Recent Price: 12.14 Market Intelligence Score: 42 | |
| Day Percent Change: 2.62% Day Change: 0.31 | |
| Week Change: 0.75% Year-to-date Change: -11.6% | |
| BIOX Links: Profile News Message Board | |
| Charts:- Daily , Weekly | |
| Add BIOX to Watchlist: View: Get Complete BIOX Trend Analysis ➞ | |
 | RCI Rogers Communications Inc. |
| Sector: Technology | |
| SubSector: Wireless Communications | |
| MarketCap: 22111.6 Millions | |
| Recent Price: 38.43 Market Intelligence Score: 42 | |
| Day Percent Change: 1.37% Day Change: 0.52 | |
| Week Change: 1.24% Year-to-date Change: -17.9% | |
| RCI Links: Profile News Message Board | |
| Charts:- Daily , Weekly | |
| Add RCI to Watchlist: View: Get Complete RCI Trend Analysis ➞ | |
 | DCBO Docebo Inc. |
| Sector: Technology | |
| SubSector: Software Application | |
| MarketCap: 15787 Millions | |
| Recent Price: 45.64 Market Intelligence Score: 42 | |
| Day Percent Change: 1.11% Day Change: 0.50 | |
| Week Change: 2.06% Year-to-date Change: -5.7% | |
| DCBO Links: Profile News Message Board | |
| Charts:- Daily , Weekly | |
| Add DCBO to Watchlist: View: Get Complete DCBO Trend Analysis ➞ | |
 | LAC Lithium Americas Corp. |
| Sector: Materials | |
| SubSector: Industrial Metals & Minerals | |
| MarketCap: 192.01 Millions | |
| Recent Price: 4.49 Market Intelligence Score: 42 | |
| Day Percent Change: 0.00% Day Change: 0.00 | |
| Week Change: -2.81% Year-to-date Change: -29.8% | |
| LAC Links: Profile News Message Board | |
| Charts:- Daily , Weekly | |
| Add LAC to Watchlist: View: Get Complete LAC Trend Analysis ➞ | |
 | EPIX ESSA Pharma Inc. |
| Sector: Health Care | |
| SubSector: Biotechnology | |
| MarketCap: 70.5785 Millions | |
| Recent Price: 6.88 Market Intelligence Score: 42 | |
| Day Percent Change: -1.01% Day Change: -0.07 | |
| Week Change: 13.16% Year-to-date Change: 5.2% | |
| EPIX Links: Profile News Message Board | |
| Charts:- Daily , Weekly | |
| Add EPIX to Watchlist: View: Get Complete EPIX Trend Analysis ➞ | |
 | FSV FirstService Corporation |
| Sector: Financials | |
| SubSector: Property Management | |
| MarketCap: 2793.92 Millions | |
| Recent Price: 149.54 Market Intelligence Score: 42 | |
| Day Percent Change: -0.82% Day Change: -1.23 | |
| Week Change: -0.17% Year-to-date Change: -7.7% | |
| FSV Links: Profile News Message Board | |
| Charts:- Daily , Weekly | |
| Add FSV to Watchlist: View: Get Complete FSV Trend Analysis ➞ | |
 | AUPH Aurinia Pharmaceuticals Inc. |
| Sector: Health Care | |
| SubSector: Biotechnology | |
| MarketCap: 1319.75 Millions | |
| Recent Price: 5.10 Market Intelligence Score: 42 | |
| Day Percent Change: -1.35% Day Change: -0.07 | |
| Week Change: 3.87% Year-to-date Change: -43.3% | |
| AUPH Links: Profile News Message Board | |
| Charts:- Daily , Weekly | |
| Add AUPH to Watchlist: View: Get Complete AUPH Trend Analysis ➞ | |
 | IMO Imperial Oil Limited |
| Sector: Energy | |
| SubSector: Major Integrated Oil & Gas | |
| MarketCap: 8171.25 Millions | |
| Recent Price: 68.05 Market Intelligence Score: 41 | |
| Day Percent Change: -0.03% Day Change: -0.02 | |
| Week Change: -3.75% Year-to-date Change: 19.0% | |
| IMO Links: Profile News Message Board | |
| Charts:- Daily , Weekly | |
| Add IMO to Watchlist: View: Get Complete IMO Trend Analysis ➞ | |
 | BAM Brookfield Asset Management Inc. |
| Sector: Financials | |
| SubSector: Real Estate Development | |
| MarketCap: 47134.9 Millions | |
| Recent Price: 39.13 Market Intelligence Score: 40 | |
| Day Percent Change: 1.45% Day Change: 0.56 | |
| Week Change: -1.44% Year-to-date Change: -2.6% | |
| BAM Links: Profile News Message Board | |
| Charts:- Daily , Weekly | |
| Add BAM to Watchlist: View: Get Complete BAM Trend Analysis ➞ | |
 | BBD Banco Bradesco S.A. |
| Sector: Financials | |
| SubSector: Foreign Regional Banks | |
| MarketCap: 30281.7 Millions | |
| Recent Price: 2.72 Market Intelligence Score: 39 | |
| Day Percent Change: 0.00% Day Change: 0.00 | |
| Week Change: 0% Year-to-date Change: -22.3% | |
| BBD Links: Profile News Message Board | |
| Charts:- Daily , Weekly | |
| Add BBD to Watchlist: View: Get Complete BBD Trend Analysis ➞ | |
 | EGO Eldorado Gold Corporation |
| Sector: Materials | |
| SubSector: Gold | |
| MarketCap: 982.519 Millions | |
| Recent Price: 14.31 Market Intelligence Score: 39 | |
| Day Percent Change: -2.25% Day Change: -0.33 | |
| Week Change: -5.86% Year-to-date Change: 10.3% | |
| EGO Links: Profile News Message Board | |
| Charts:- Daily , Weekly | |
| Add EGO to Watchlist: View: Get Complete EGO Trend Analysis ➞ | |
 | PBR Petroleo Brasileiro S.A. - Petrobras |
| Sector: Energy | |
| SubSector: Oil & Gas Drilling & Exploration | |
| MarketCap: 38939.2 Millions | |
| Recent Price: 16.43 Market Intelligence Score: 38 | |
| Day Percent Change: -5.25% Day Change: -0.91 | |
| Week Change: -3.64% Year-to-date Change: 2.9% | |
| PBR Links: Profile News Message Board | |
| Charts:- Daily , Weekly | |
| Add PBR to Watchlist: View: Get Complete PBR Trend Analysis ➞ | |
 | QBTS D-Wave Quantum Inc. |
| Sector: Technology | |
| SubSector: Computer Hardware | |
| MarketCap: 290 Millions | |
| Recent Price: 1.41 Market Intelligence Score: 37 | |
| Day Percent Change: 1.81% Day Change: 0.03 | |
| Week Change: -2.43% Year-to-date Change: 60.1% | |
| QBTS Links: Profile News Message Board | |
| Charts:- Daily , Weekly | |
| Add QBTS to Watchlist: View: Get Complete QBTS Trend Analysis ➞ | |
 | BNS The Bank of Nova Scotia |
| Sector: Financials | |
| SubSector: Money Center Banks | |
| MarketCap: 48742.1 Millions | |
| Recent Price: 46.85 Market Intelligence Score: 37 | |
| Day Percent Change: 1.19% Day Change: 0.55 | |
| Week Change: 0.62% Year-to-date Change: -3.8% | |
| BNS Links: Profile News Message Board | |
| Charts:- Daily , Weekly | |
| Add BNS to Watchlist: View: Get Complete BNS Trend Analysis ➞ | |
 | VOXR Vox Royalty Corp. |
| Sector: Materials | |
| SubSector: Other Precious Metals & Mining | |
| MarketCap: 154 Millions | |
| Recent Price: 2.00 Market Intelligence Score: 36 | |
| Day Percent Change: -1.48% Day Change: -0.03 | |
| Week Change: -5.66% Year-to-date Change: -2.9% | |
| VOXR Links: Profile News Message Board | |
| Charts:- Daily , Weekly | |
| Add VOXR to Watchlist: View: Get Complete VOXR Trend Analysis ➞ | |
 | BTG B2Gold Corp. |
| Sector: Materials | |
| SubSector: Gold | |
| MarketCap: 2792.39 Millions | |
| Recent Price: 2.50 Market Intelligence Score: 36 | |
| Day Percent Change: -0.79% Day Change: -0.02 | |
| Week Change: -4.58% Year-to-date Change: -20.9% | |
| BTG Links: Profile News Message Board | |
| Charts:- Daily , Weekly | |
| Add BTG to Watchlist: View: Get Complete BTG Trend Analysis ➞ | |
| To view more stocks, click on Next / Previous arrows or select different range: 0 - 25 , 25 - 50 , 50 - 75 , 75 - 100 , 100 - 125 , 125 - 150 , 150 - 175 , 175 - 200 , 200 - 225 | ||
| Click To Change The Sort Order: By Market Cap or Company Size Performance: Year-to-date, Week and Day | |
| Select Chart Type: | ||
 Best Stocks Today 12Stocks.com |
© 2024 12Stocks.com Terms & Conditions Privacy Contact Us
All Information Provided Only For Education And Not To Be Used For Investing or Trading. See Terms & Conditions


One More Thing ... Get Best Stocks Delivered Daily!
Never Ever Miss A Move With Our Top Ten Stocks Lists
Find Best Stocks In Any Market - Bull or Bear Market
Take A Peek At Our Top Ten Stocks Lists: Daily, Weekly, Year-to-Date & Top Trends
Find Best Stocks In Any Market - Bull or Bear Market
Take A Peek At Our Top Ten Stocks Lists: Daily, Weekly, Year-to-Date & Top Trends
Latin America Stocks With Best Up Trends [0-bearish to 100-bullish]: Banco BBVA[100], Grupo Financiero[100], Banco Macro[100], Grupo Supervielle[100], TransAlta [100], Pampa Energia[100], YPF Sociedad[100], Brookfield Renewable[100], Algonquin Power[100], Central Puerto[100], Transportadora de[100]
Best Latin America Stocks Year-to-Date:
Aurora Cannabis[1315.37%], Fusion [123.39%], Banco Macro[109.83%], Canopy Growth[100.39%], Grupo Financiero[98.78%], Banco BBVA[92.83%], Grupo Supervielle[69.21%], McEwen Mining[63.11%], D-Wave Quantum[60.13%], Hudbay Minerals[51.63%], Embraer S.A[46.12%] Best Latin America Stocks This Week:
Brookfield Renewable[20.81%], Tilray [17.98%], Banco Macro[17.21%], MercadoLibre [15.97%], Canopy Growth[14.93%], Transportadora de[14.22%], Grupo Supervielle[13.93%], Banco BBVA[13.41%], Azul S.A[13.03%], Grupo Financiero[11.79%], Zymeworks [11.38%] Best Latin America Stocks Daily:
AbCellera Biologics[11.49%], Banco BBVA[9.27%], Lion Electric[8.71%], Azul S.A[8.63%], Telecom Argentina[8.47%], MercadoLibre [8.27%], Grupo Financiero[7.62%], Banco Macro[7.32%], Nu [6.13%], Grupo Televisa[6.02%], XP [5.96%]