
 Login Sign Up


| |||||
 |  | ||||

| 12Stocks.com Market Intelligence |
Best Industrial Stocks
| In a hurry? Industrial Stocks Lists: Performance Trends Table, Stock Charts
Sort Industrial stocks: Daily, Weekly, Year-to-Date, Market Cap & Trends. Filter Industrial stocks list by size:All Industrial Large Mid-Range Small |
| 12Stocks.com Industrial Stocks Performances & Trends Daily | |||||||||
|
|  The overall Smart Investing & Trading Score is 38 (0-bearish to 100-bullish) which puts Industrial sector in short term bearish to neutral trend. The Smart Investing & Trading Score from previous trading session is 83 and hence a deterioration of trend.
| ||||||||
Here are the Smart Investing & Trading Scores of the most requested Industrial stocks at 12Stocks.com (click stock name for detailed review):
|


| 12Stocks.com: Investing in Industrial sector with Stocks | |
|
The following table helps investors and traders sort through current performance and trends (as measured by Smart Investing & Trading Score) of various
stocks in the Industrial sector. Quick View: Move mouse or cursor over stock symbol (ticker) to view short-term Technical chart and over stock name to view long term chart. Click on  to add stock symbol to your watchlist and to add stock symbol to your watchlist and  to view watchlist. Click on any ticker or stock name for detailed market intelligence report for that stock. to view watchlist. Click on any ticker or stock name for detailed market intelligence report for that stock. |
12Stocks.com Performance of Stocks in Industrial Sector
| Ticker | Stock Name | Watchlist | Category | Recent Price | Smart Investing & Trading Score | Change % | YTD Change% |
| EPAC | Enerpac Tool |   | Machinery | 35.63 | 58 | -1.95% | 14.60% |
| GNRC | Generac | | Machinery | 135.96 | 58 | -0.98% | 5.20% |
| ADSE | ADS-TEC Energy | | Electrical Equipment & Parts | 10.80 | 58 | -0.92% | 51.47% |
| RSG | Republic Services | | Waste Mgmt | 191.70 | 58 | -0.88% | 16.25% |
| HII | Huntington Ingalls | | Aerospace/Defense | 276.93 | 58 | -0.58% | 6.66% |
| RGR | Sturm Ruger | | Aerospace/Defense | 46.23 | 58 | -0.06% | 1.72% |
| LOMA | Loma Negra | | Building Materials | 7.14 | 58 | -1.52% | 0.71% |
| ESLT | Elbit Systems | | Aerospace/Defense | 202.92 | 57 | -0.11% | -4.84% |
| CAE | CAE | | Aerospace/Defense | 19.29 | 57 | -0.36% | -10.65% |
| FIP | FTAI Infrastructure | | Industrials | 7.24 | 56 | -2.43% | 86.12% |
| JELD | JELD-WEN Holding | | Building Materials | 20.50 | 56 | -2.38% | 8.58% |
| IBP | Installed Building | | Building Materials | 235.73 | 56 | -3.15% | 28.94% |
| KBH | KB Home | | Residential | 64.76 | 56 | -2.06% | 3.68% |
| GMS | GMS | | Building Materials | 92.52 | 56 | -1.73% | 12.24% |
| ATRO | Astronics | | Aerospace/Defense | 16.77 | 55 | 0.66% | -3.73% |
| LXFR | Luxfer | | Machinery | 9.63 | 54 | -3.12% | 7.72% |
| SPR | Spirit AeroSystems | | Aerospace/Defense | 32.00 | 54 | -1.87% | 0.69% |
| EVLV | Evolv Technologies | | Security & Protection | 3.91 | 53 | -4.05% | -17.16% |
| LLAP | Terran Orbital | | Aerospace & Defense | 1.32 | 53 | -2.94% | 15.28% |
| ULCC | Frontier | | Airlines | 6.04 | 53 | -2.82% | 11.14% |
| CSWI | CSW s | | Machinery | 237.62 | 53 | -0.98% | 14.57% |
| AMPX | Amprius Technologies | | Electrical Equipment & Parts | 1.87 | 52 | -0.53% | -62.67% |
| SMR | NuScale Power | | Specialty Industrial Machinery | 5.80 | 51 | -4.61% | 79.84% |
| HI | Hillenbrand | | Machinery | 47.72 | 51 | -3.56% | -0.27% |
| AGX | Argan | | Heavy Construction | 60.26 | 51 | -2.95% | 28.79% |
| For chart view version of above stock list: Chart View ➞ 0 - 25 , 25 - 50 , 50 - 75 , 75 - 100 , 100 - 125 , 125 - 150 , 150 - 175 , 175 - 200 , 200 - 225 , 225 - 250 , 250 - 275 , 275 - 300 | ||
 | Click To Change The Sort Order: By Market Cap or Company Size Performance: Year-to-date, Week and Day |  |
|
Get the most comprehensive stock market coverage daily at 12Stocks.com ➞ Best Stocks Today ➞ Best Stocks Weekly ➞ Best Stocks Year-to-Date ➞ Best Stocks Trends ➞  Best Stocks Today 12Stocks.com Best Nasdaq Stocks ➞ Best S&P 500 Stocks ➞ Best Tech Stocks ➞ Best Biotech Stocks ➞ |
| Detailed Overview of Industrial Stocks |
| Industrial Technical Overview, Leaders & Laggards, Top Industrial ETF Funds & Detailed Industrial Stocks List, Charts, Trends & More |
| Industrial Sector: Technical Analysis, Trends & YTD Performance | |
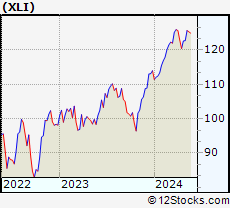
| Industrial sector is composed of stocks
from industrial machinery, aerospace, defense, farm/construction
and industrial services subsectors. Industrial sector, as represented by XLI, an exchange-traded fund [ETF] that holds basket of Industrial stocks (e.g, Caterpillar, Boeing) is up by 6.61% and is currently outperforming the overall market by 1.81% year-to-date. Below is a quick view of Technical charts and trends: |
|
 XLI Weekly Chart |
|
| Long Term Trend: Good | |
| Medium Term Trend: Not Good | |
 XLI Daily Chart |
|
| Short Term Trend: Not Good | |
| Overall Trend Score: 38 | |
| YTD Performance: 6.61% | |
| **Trend Scores & Views Are Only For Educational Purposes And Not For Investing | |
| 12Stocks.com: Top Performing Industrial Sector Stocks | ||||||||||||||||||||||||||||||||||||||||||||||||
 The top performing Industrial sector stocks year to date are
Now, more recently, over last week, the top performing Industrial sector stocks on the move are


|
||||||||||||||||||||||||||||||||||||||||||||||||
| 12Stocks.com: Investing in Industrial Sector using Exchange Traded Funds | |
|
The following table shows list of key exchange traded funds (ETF) that
help investors track Industrial Index. For detailed view, check out our ETF Funds section of our website. Quick View: Move mouse or cursor over ETF symbol (ticker) to view short-term Technical chart and over ETF name to view long term chart. Click on ticker or stock name for detailed view. Click on to add stock symbol to your watchlist and to view watchlist. |
12Stocks.com List of ETFs that track Industrial Index
| Ticker | ETF Name | Watchlist | Recent Price | Smart Investing & Trading Score | Change % | Week % | Year-to-date % |
| XLI | Industrial | | 121.52 | 38 | -1.59 | -0.93 | 6.61% |
| UXI | Industrials | | 32.26 | 63 | -2.00 | -1.44 | 12.04% |
| PPA | Aerospace & Defense | | 101.23 | 83 | -0.74 | 0.32 | 9.84% |
| ITA | Aerospace & Defense | | 129.85 | 73 | -0.98 | 0.25 | 2.57% |
| ITB | Home Construction | | 103.85 | 34 | -2.22 | -1.7 | 2.08% |
| XHB | Homebuilders | | 102.61 | 51 | -1.79 | -1.07 | 7.27% |
| SIJ | Short Industrials | | 10.01 | 57 | 2.09 | 1.93 | -11.73% |
| IYJ | Industrials | | 120.16 | 38 | -1.55 | -1.15 | 5.07% |
| EXI | Global Industrials | | 134.84 | 46 | -1.21 | -0.91 | 5.81% |
| VIS | Industrials | | 234.05 | 38 | -1.73 | -1.04 | 6.18% |
| PSCI | SmallCap Industrials | | 119.28 | 33 | -1.73 | -1.72 | 2.86% |
| XAR | Aerospace & Defense | | 136.03 | 83 | -0.95 | -0.06 | 0.45% |
| ARKQ | ARK Industrial Innovation | | 53.31 | 83 | -2.28 | -0.09 | -7.61% |
| 12Stocks.com: Charts, Trends, Fundamental Data and Performances of Industrial Stocks | |
|
We now take in-depth look at all Industrial stocks including charts, multi-period performances and overall trends (as measured by Smart Investing & Trading Score). One can sort Industrial stocks (click link to choose) by Daily, Weekly and by Year-to-Date performances. Also, one can sort by size of the company or by market capitalization. |
| Select Your Default Chart Type: | |||||
| |||||
| Click on stock symbol or name for detailed view. Click on to add stock symbol to your watchlist and to view watchlist. Quick View: Move mouse or cursor over "Daily" to quickly view daily Technical stock chart and over "Weekly" to view weekly Technical stock chart. | |||||

 | EPAC Enerpac Tool Group Corp. |
| Sector: Industrials | |
| SubSector: Diversified Machinery | |
| MarketCap: 1044.16 Millions | |
| Recent Price: 35.63 Smart Investing & Trading Score: 58 | |
| Day Percent Change: -1.95% Day Change: -0.71 | |
| Week Change: -1.41% Year-to-date Change: 14.6% | |
| EPAC Links: Profile News Message Board | |
| Charts:- Daily , Weekly | |
| Add EPAC to Watchlist: View: Get Complete EPAC Trend Analysis ➞ | |
 | GNRC Generac Holdings Inc. |
| Sector: Industrials | |
| SubSector: Diversified Machinery | |
| MarketCap: 5736.26 Millions | |
| Recent Price: 135.96 Smart Investing & Trading Score: 58 | |
| Day Percent Change: -0.98% Day Change: -1.34 | |
| Week Change: -2.97% Year-to-date Change: 5.2% | |
| GNRC Links: Profile News Message Board | |
| Charts:- Daily , Weekly | |
| Add GNRC to Watchlist: View: Get Complete GNRC Trend Analysis ➞ | |
 | ADSE ADS-TEC Energy PLC |
| Sector: Industrials | |
| SubSector: Electrical Equipment & Parts | |
| MarketCap: 329 Millions | |
| Recent Price: 10.80 Smart Investing & Trading Score: 58 | |
| Day Percent Change: -0.92% Day Change: -0.10 | |
| Week Change: -0.83% Year-to-date Change: 51.5% | |
| ADSE Links: Profile News Message Board | |
| Charts:- Daily , Weekly | |
| Add ADSE to Watchlist: View: Get Complete ADSE Trend Analysis ➞ | |
 | RSG Republic Services, Inc. |
| Sector: Industrials | |
| SubSector: Waste Management | |
| MarketCap: 26178.6 Millions | |
| Recent Price: 191.70 Smart Investing & Trading Score: 58 | |
| Day Percent Change: -0.88% Day Change: -1.71 | |
| Week Change: -0.11% Year-to-date Change: 16.3% | |
| RSG Links: Profile News Message Board | |
| Charts:- Daily , Weekly | |
| Add RSG to Watchlist: View: Get Complete RSG Trend Analysis ➞ | |
 | HII Huntington Ingalls Industries, Inc. |
| Sector: Industrials | |
| SubSector: Aerospace/Defense Products & Services | |
| MarketCap: 7276.11 Millions | |
| Recent Price: 276.93 Smart Investing & Trading Score: 58 | |
| Day Percent Change: -0.58% Day Change: -1.62 | |
| Week Change: -0.01% Year-to-date Change: 6.7% | |
| HII Links: Profile News Message Board | |
| Charts:- Daily , Weekly | |
| Add HII to Watchlist: View: Get Complete HII Trend Analysis ➞ | |
 | RGR Sturm, Ruger & Company, Inc. |
| Sector: Industrials | |
| SubSector: Aerospace/Defense Products & Services | |
| MarketCap: 752 Millions | |
| Recent Price: 46.23 Smart Investing & Trading Score: 58 | |
| Day Percent Change: -0.06% Day Change: -0.03 | |
| Week Change: -0.52% Year-to-date Change: 1.7% | |
| RGR Links: Profile News Message Board | |
| Charts:- Daily , Weekly | |
| Add RGR to Watchlist: View: Get Complete RGR Trend Analysis ➞ | |
 | LOMA Loma Negra Compania Industrial Argentina Sociedad Anonima |
| Sector: Industrials | |
| SubSector: General Building Materials | |
| MarketCap: 408.853 Millions | |
| Recent Price: 7.14 Smart Investing & Trading Score: 58 | |
| Day Percent Change: -1.52% Day Change: -0.11 | |
| Week Change: -0.7% Year-to-date Change: 0.7% | |
| LOMA Links: Profile News Message Board | |
| Charts:- Daily , Weekly | |
| Add LOMA to Watchlist: View: Get Complete LOMA Trend Analysis ➞ | |
 | ESLT Elbit Systems Ltd. |
| Sector: Industrials | |
| SubSector: Aerospace/Defense Products & Services | |
| MarketCap: 5770.01 Millions | |
| Recent Price: 202.92 Smart Investing & Trading Score: 57 | |
| Day Percent Change: -0.11% Day Change: -0.22 | |
| Week Change: 1.08% Year-to-date Change: -4.8% | |
| ESLT Links: Profile News Message Board | |
| Charts:- Daily , Weekly | |
| Add ESLT to Watchlist: View: Get Complete ESLT Trend Analysis ➞ | |
 | CAE CAE Inc. |
| Sector: Industrials | |
| SubSector: Aerospace/Defense Products & Services | |
| MarketCap: 3739.61 Millions | |
| Recent Price: 19.29 Smart Investing & Trading Score: 57 | |
| Day Percent Change: -0.36% Day Change: -0.07 | |
| Week Change: 1.31% Year-to-date Change: -10.7% | |
| CAE Links: Profile News Message Board | |
| Charts:- Daily , Weekly | |
| Add CAE to Watchlist: View: Get Complete CAE Trend Analysis ➞ | |
 | FIP FTAI Infrastructure Inc. |
| Sector: Industrials | |
| SubSector: Industrials | |
| MarketCap: 368 Millions | |
| Recent Price: 7.24 Smart Investing & Trading Score: 56 | |
| Day Percent Change: -2.43% Day Change: -0.18 | |
| Week Change: -0.96% Year-to-date Change: 86.1% | |
| FIP Links: Profile News Message Board | |
| Charts:- Daily , Weekly | |
| Add FIP to Watchlist: View: Get Complete FIP Trend Analysis ➞ | |
 | JELD JELD-WEN Holding, Inc. |
| Sector: Industrials | |
| SubSector: General Building Materials | |
| MarketCap: 1022.53 Millions | |
| Recent Price: 20.50 Smart Investing & Trading Score: 56 | |
| Day Percent Change: -2.38% Day Change: -0.50 | |
| Week Change: -4.21% Year-to-date Change: 8.6% | |
| JELD Links: Profile News Message Board | |
| Charts:- Daily , Weekly | |
| Add JELD to Watchlist: View: Get Complete JELD Trend Analysis ➞ | |
 | IBP Installed Building Products, Inc. |
| Sector: Industrials | |
| SubSector: General Building Materials | |
| MarketCap: 1284.23 Millions | |
| Recent Price: 235.73 Smart Investing & Trading Score: 56 | |
| Day Percent Change: -3.15% Day Change: -7.66 | |
| Week Change: -1.64% Year-to-date Change: 28.9% | |
| IBP Links: Profile News Message Board | |
| Charts:- Daily , Weekly | |
| Add IBP to Watchlist: View: Get Complete IBP Trend Analysis ➞ | |
 | KBH KB Home |
| Sector: Industrials | |
| SubSector: Residential Construction | |
| MarketCap: 1249.66 Millions | |
| Recent Price: 64.76 Smart Investing & Trading Score: 56 | |
| Day Percent Change: -2.06% Day Change: -1.36 | |
| Week Change: -1.28% Year-to-date Change: 3.7% | |
| KBH Links: Profile News Message Board | |
| Charts:- Daily , Weekly | |
| Add KBH to Watchlist: View: Get Complete KBH Trend Analysis ➞ | |
 | GMS GMS Inc. |
| Sector: Industrials | |
| SubSector: General Building Materials | |
| MarketCap: 587.753 Millions | |
| Recent Price: 92.52 Smart Investing & Trading Score: 56 | |
| Day Percent Change: -1.73% Day Change: -1.63 | |
| Week Change: -0.4% Year-to-date Change: 12.2% | |
| GMS Links: Profile News Message Board | |
| Charts:- Daily , Weekly | |
| Add GMS to Watchlist: View: Get Complete GMS Trend Analysis ➞ | |
 | ATRO Astronics Corporation |
| Sector: Industrials | |
| SubSector: Aerospace/Defense Products & Services | |
| MarketCap: 287.201 Millions | |
| Recent Price: 16.77 Smart Investing & Trading Score: 55 | |
| Day Percent Change: 0.66% Day Change: 0.11 | |
| Week Change: 1.15% Year-to-date Change: -3.7% | |
| ATRO Links: Profile News Message Board | |
| Charts:- Daily , Weekly | |
| Add ATRO to Watchlist: View: Get Complete ATRO Trend Analysis ➞ | |
 | LXFR Luxfer Holdings PLC |
| Sector: Industrials | |
| SubSector: Diversified Machinery | |
| MarketCap: 406.716 Millions | |
| Recent Price: 9.63 Smart Investing & Trading Score: 54 | |
| Day Percent Change: -3.12% Day Change: -0.31 | |
| Week Change: -1.03% Year-to-date Change: 7.7% | |
| LXFR Links: Profile News Message Board | |
| Charts:- Daily , Weekly | |
| Add LXFR to Watchlist: View: Get Complete LXFR Trend Analysis ➞ | |
 | SPR Spirit AeroSystems Holdings, Inc. |
| Sector: Industrials | |
| SubSector: Aerospace/Defense Products & Services | |
| MarketCap: 2283.01 Millions | |
| Recent Price: 32.00 Smart Investing & Trading Score: 54 | |
| Day Percent Change: -1.87% Day Change: -0.61 | |
| Week Change: -1.51% Year-to-date Change: 0.7% | |
| SPR Links: Profile News Message Board | |
| Charts:- Daily , Weekly | |
| Add SPR to Watchlist: View: Get Complete SPR Trend Analysis ➞ | |
 | EVLV Evolv Technologies Holdings, Inc. |
| Sector: Industrials | |
| SubSector: Security & Protection Services | |
| MarketCap: 853 Millions | |
| Recent Price: 3.91 Smart Investing & Trading Score: 53 | |
| Day Percent Change: -4.05% Day Change: -0.17 | |
| Week Change: -5.21% Year-to-date Change: -17.2% | |
| EVLV Links: Profile News Message Board | |
| Charts:- Daily , Weekly | |
| Add EVLV to Watchlist: View: Get Complete EVLV Trend Analysis ➞ | |
 | LLAP Terran Orbital Corporation |
| Sector: Industrials | |
| SubSector: Aerospace & Defense | |
| MarketCap: 206 Millions | |
| Recent Price: 1.32 Smart Investing & Trading Score: 53 | |
| Day Percent Change: -2.94% Day Change: -0.04 | |
| Week Change: -1.49% Year-to-date Change: 15.3% | |
| LLAP Links: Profile News Message Board | |
| Charts:- Daily , Weekly | |
| Add LLAP to Watchlist: View: Get Complete LLAP Trend Analysis ➞ | |
 | ULCC Frontier Group Holdings, Inc. |
| Sector: Industrials | |
| SubSector: Airlines | |
| MarketCap: 2160 Millions | |
| Recent Price: 6.04 Smart Investing & Trading Score: 53 | |
| Day Percent Change: -2.82% Day Change: -0.17 | |
| Week Change: -1.39% Year-to-date Change: 11.1% | |
| ULCC Links: Profile News Message Board | |
| Charts:- Daily , Weekly | |
| Add ULCC to Watchlist: View: Get Complete ULCC Trend Analysis ➞ | |
 | CSWI CSW Industrials, Inc. |
| Sector: Industrials | |
| SubSector: Diversified Machinery | |
| MarketCap: 985.616 Millions | |
| Recent Price: 237.62 Smart Investing & Trading Score: 53 | |
| Day Percent Change: -0.98% Day Change: -2.36 | |
| Week Change: -0.58% Year-to-date Change: 14.6% | |
| CSWI Links: Profile News Message Board | |
| Charts:- Daily , Weekly | |
| Add CSWI to Watchlist: View: Get Complete CSWI Trend Analysis ➞ | |
 | AMPX Amprius Technologies, Inc. |
| Sector: Industrials | |
| SubSector: Electrical Equipment & Parts | |
| MarketCap: 608 Millions | |
| Recent Price: 1.87 Smart Investing & Trading Score: 52 | |
| Day Percent Change: -0.53% Day Change: -0.01 | |
| Week Change: 7.47% Year-to-date Change: -62.7% | |
| AMPX Links: Profile News Message Board | |
| Charts:- Daily , Weekly | |
| Add AMPX to Watchlist: View: Get Complete AMPX Trend Analysis ➞ | |
 | SMR NuScale Power Corporation |
| Sector: Industrials | |
| SubSector: Specialty Industrial Machinery | |
| MarketCap: 1510 Millions | |
| Recent Price: 5.80 Smart Investing & Trading Score: 51 | |
| Day Percent Change: -4.61% Day Change: -0.28 | |
| Week Change: -4.29% Year-to-date Change: 79.8% | |
| SMR Links: Profile News Message Board | |
| Charts:- Daily , Weekly | |
| Add SMR to Watchlist: View: Get Complete SMR Trend Analysis ➞ | |
 | HI Hillenbrand, Inc. |
| Sector: Industrials | |
| SubSector: Diversified Machinery | |
| MarketCap: 1389.86 Millions | |
| Recent Price: 47.72 Smart Investing & Trading Score: 51 | |
| Day Percent Change: -3.56% Day Change: -1.76 | |
| Week Change: -3.42% Year-to-date Change: -0.3% | |
| HI Links: Profile News Message Board | |
| Charts:- Daily , Weekly | |
| Add HI to Watchlist: View: Get Complete HI Trend Analysis ➞ | |
 | AGX Argan, Inc. |
| Sector: Industrials | |
| SubSector: Heavy Construction | |
| MarketCap: 664.095 Millions | |
| Recent Price: 60.26 Smart Investing & Trading Score: 51 | |
| Day Percent Change: -2.95% Day Change: -1.83 | |
| Week Change: -2.78% Year-to-date Change: 28.8% | |
| AGX Links: Profile News Message Board | |
| Charts:- Daily , Weekly | |
| Add AGX to Watchlist: View: Get Complete AGX Trend Analysis ➞ | |
| For tabular summary view of above stock list: Summary View ➞ 0 - 25 , 25 - 50 , 50 - 75 , 75 - 100 , 100 - 125 , 125 - 150 , 150 - 175 , 175 - 200 , 200 - 225 , 225 - 250 , 250 - 275 , 275 - 300 | ||
| Click To Change The Sort Order: By Market Cap or Company Size Performance: Year-to-date, Week and Day | |
| Select Chart Type: | ||
|
Best Stocks Today 12Stocks.com |
© 2024 12Stocks.com Terms & Conditions Privacy Contact Us
All Information Provided Only For Education And Not To Be Used For Investing or Trading. See Terms & Conditions


One More Thing ... Get Best Stocks Delivered Daily!
Never Ever Miss A Move With Our Top Ten Stocks Lists
Find Best Stocks In Any Market - Bull or Bear Market
Take A Peek At Our Top Ten Stocks Lists: Daily, Weekly, Year-to-Date & Top Trends
Find Best Stocks In Any Market - Bull or Bear Market
Take A Peek At Our Top Ten Stocks Lists: Daily, Weekly, Year-to-Date & Top Trends
Industrial Stocks With Best Up Trends [0-bearish to 100-bullish]: Allegheny Technologies[100], Woodward [100], TPI Composites[100], 3M [100], Timken [100], Carpenter Technology[100], AAON [100], IES [100], Carrier Global[100], BiomX [95], AeroVironment [95]
Best Industrial Stocks Year-to-Date:
Intuitive Machines[108.23%], FTAI Infrastructure[86.12%], Tutor Perini[82.75%], NuScale Power[79.84%], BiomX [71.43%], IES [70.56%], Caesarstone [68.72%], EMCOR [65.79%], Powell Industries[61.76%], Masonite [56.57%], ADS-TEC Energy[51.47%] Best Industrial Stocks This Week:
BiomX [37.14%], Hydrofarm [18.15%], Allegheny Technologies[15.36%], TPI Composites[14.39%], GrafTech [8.86%], Woodward [7.82%], Amprius Technologies[7.47%], ESS Tech[7.12%], Shengfeng Development[6.67%], FuelCell Energy[6.58%], 3M [5.1%] Best Industrial Stocks Daily:
BiomX [20.00%], Hydrofarm [16.84%], Allegheny Technologies[15.03%], Woodward [7.47%], Caesarstone [7.13%], TPI Composites[6.71%], 3M [4.72%], GrafTech [3.61%], Unifi [3.11%], Shengfeng Development[2.92%], Timken [2.91%]