
 Login Sign Up


| |||||
 |  | ||||

| 12Stocks.com Market Intelligence |
Best Industrial Stocks
| In a hurry? Industrial Stocks Lists: Performance Trends Table, Stock Charts
Sort Industrial stocks: Daily, Weekly, Year-to-Date, Market Cap & Trends. Filter Industrial stocks list by size:All Industrial Large Mid-Range Small |
| 12Stocks.com Industrial Stocks Performances & Trends Daily | |||||||||
|
|  The overall Smart Investing & Trading Score is 46 (0-bearish to 100-bullish) which puts Industrial sector in short term neutral trend. The Smart Investing & Trading Score from previous trading session is 83 and hence a deterioration of trend.
| ||||||||
Here are the Smart Investing & Trading Scores of the most requested Industrial stocks at 12Stocks.com (click stock name for detailed review):
|


| 12Stocks.com: Investing in Industrial sector with Stocks | |
|
The following table helps investors and traders sort through current performance and trends (as measured by Smart Investing & Trading Score) of various
stocks in the Industrial sector. Quick View: Move mouse or cursor over stock symbol (ticker) to view short-term Technical chart and over stock name to view long term chart. Click on  to add stock symbol to your watchlist and to add stock symbol to your watchlist and  to view watchlist. Click on any ticker or stock name for detailed market intelligence report for that stock. to view watchlist. Click on any ticker or stock name for detailed market intelligence report for that stock. |
12Stocks.com Performance of Stocks in Industrial Sector
| Ticker | Stock Name | Watchlist | Category | Recent Price | Smart Investing & Trading Score | Change % | YTD Change% |
| FA | First Advantage |   | Specialty | 16.31 | 58 | -1.72% | -2.25% |
| HXL | Hexcel | | Aerospace/Defense | 64.21 | 57 | -1.86% | -12.94% |
| ENS | EnerSys | | Electrical Equipment | 90.45 | 57 | -1.46% | -10.41% |
| LEGH | Legacy Housing | | Residential | 20.40 | 57 | -1.21% | -19.11% |
| ESLT | Elbit Systems | | Aerospace/Defense | 202.81 | 57 | -0.16% | -4.90% |
| CAE | CAE | | Aerospace/Defense | 19.29 | 57 | -0.36% | -10.65% |
| ESAB | ESAB | | Fabrication | 105.88 | 56 | -1.83% | 21.73% |
| SKY | Skyline Champion | | Manufactured Housing | 76.07 | 56 | -1.79% | 2.44% |
| PSN | Parsons | | Machinery | 78.51 | 56 | -1.07% | 25.20% |
| ACA | Arcosa | | Machinery | 76.02 | 55 | -2.81% | -8.01% |
| GHM | Graham | | Fabrication | 27.84 | 54 | -1.76% | 46.76% |
| MIR | Mirion Technologies | | Specialty Industrial Machinery | 10.87 | 54 | -1.36% | 5.95% |
| DCI | Donaldson | | Machinery | 72.20 | 54 | -1.03% | 10.48% |
| LLAP | Terran Orbital | | Aerospace & Defense | 1.32 | 53 | -2.94% | 15.28% |
| TMHC | Taylor Morrison | | Residential | 56.01 | 53 | -2.93% | 4.99% |
| ULCC | Frontier | | Airlines | 6.04 | 53 | -2.82% | 11.14% |
| EVLV | Evolv Technologies | | Security & Protection | 3.98 | 53 | -2.33% | -15.68% |
| PH | Parker-Hannifin | | Equipment | 544.91 | 53 | -1.72% | 18.28% |
| RDW | Redwire | | Aerospace & Defense | 3.78 | 53 | -0.53% | 32.63% |
| AMBI | Ambipar Emergency | | Waste Mgmt | 4.30 | 52 | -1.15% | -45.29% |
| AMPX | Amprius Technologies | | Electrical Equipment & Parts | 1.87 | 52 | -0.53% | -62.67% |
| GFF | Griffon | | Building Materials | 65.52 | 51 | -3.25% | 7.50% |
| PLPC | Preformed Line | | Electrical Equipment | 121.52 | 51 | -1.83% | -9.22% |
| AZEK | AZEK | | Building Products & Equipment | 45.64 | 51 | -1.68% | 19.32% |
| NPK | National Presto | | Aerospace/Defense | 81.99 | 51 | -0.04% | 2.13% |
| For chart view version of above stock list: Chart View ➞ 0 - 25 , 25 - 50 , 50 - 75 , 75 - 100 , 100 - 125 , 125 - 150 , 150 - 175 , 175 - 200 , 200 - 225 , 225 - 250 , 250 - 275 , 275 - 300 | ||
 | Click To Change The Sort Order: By Market Cap or Company Size Performance: Year-to-date, Week and Day |  |
|
Get the most comprehensive stock market coverage daily at 12Stocks.com ➞ Best Stocks Today ➞ Best Stocks Weekly ➞ Best Stocks Year-to-Date ➞ Best Stocks Trends ➞  Best Stocks Today 12Stocks.com Best Nasdaq Stocks ➞ Best S&P 500 Stocks ➞ Best Tech Stocks ➞ Best Biotech Stocks ➞ |
| Detailed Overview of Industrial Stocks |
| Industrial Technical Overview, Leaders & Laggards, Top Industrial ETF Funds & Detailed Industrial Stocks List, Charts, Trends & More |
| Industrial Sector: Technical Analysis, Trends & YTD Performance | |
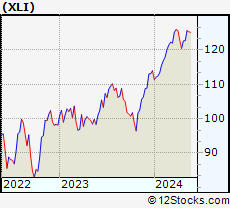
| Industrial sector is composed of stocks
from industrial machinery, aerospace, defense, farm/construction
and industrial services subsectors. Industrial sector, as represented by XLI, an exchange-traded fund [ETF] that holds basket of Industrial stocks (e.g, Caterpillar, Boeing) is up by 6.61% and is currently outperforming the overall market by 1.81% year-to-date. Below is a quick view of Technical charts and trends: |
|
 XLI Weekly Chart |
|
| Long Term Trend: Very Good | |
| Medium Term Trend: Not Good | |
 XLI Daily Chart |
|
| Short Term Trend: Not Good | |
| Overall Trend Score: 46 | |
| YTD Performance: 6.61% | |
| **Trend Scores & Views Are Only For Educational Purposes And Not For Investing | |
| 12Stocks.com: Top Performing Industrial Sector Stocks | ||||||||||||||||||||||||||||||||||||||||||||||||
 The top performing Industrial sector stocks year to date are
Now, more recently, over last week, the top performing Industrial sector stocks on the move are


|
||||||||||||||||||||||||||||||||||||||||||||||||
| 12Stocks.com: Investing in Industrial Sector using Exchange Traded Funds | |
|
The following table shows list of key exchange traded funds (ETF) that
help investors track Industrial Index. For detailed view, check out our ETF Funds section of our website. Quick View: Move mouse or cursor over ETF symbol (ticker) to view short-term Technical chart and over ETF name to view long term chart. Click on ticker or stock name for detailed view. Click on to add stock symbol to your watchlist and to view watchlist. |
12Stocks.com List of ETFs that track Industrial Index
| Ticker | ETF Name | Watchlist | Recent Price | Smart Investing & Trading Score | Change % | Week % | Year-to-date % |
| XLI | Industrial | | 121.52 | 46 | -1.59 | -0.93 | 6.61% |
| UXI | Industrials | | 32.26 | 63 | -2.00 | -1.44 | 12.04% |
| PPA | Aerospace & Defense | | 101.23 | 83 | -0.74 | 0.32 | 9.84% |
| ITA | Aerospace & Defense | | 129.85 | 85 | -0.98 | 0.25 | 2.57% |
| ITB | Home Construction | | 103.85 | 44 | -2.22 | -1.7 | 2.08% |
| XHB | Homebuilders | | 102.61 | 58 | -1.79 | -1.07 | 7.27% |
| SIJ | Short Industrials | | 10.01 | 57 | 2.04 | 1.88 | -11.77% |
| IYJ | Industrials | | 120.53 | 63 | -1.25 | -0.85 | 5.4% |
| EXI | Global Industrials | | 134.84 | 71 | -1.21 | -0.91 | 5.81% |
| VIS | Industrials | | 234.75 | 76 | -1.44 | -0.74 | 6.5% |
| PSCI | SmallCap Industrials | | 121.98 | 70 | 0.49 | 0.51 | 5.19% |
| XAR | Aerospace & Defense | | 136.05 | 88 | -0.93 | -0.04 | 0.47% |
| ARKQ | ARK Industrial Innovation | | 53.37 | 88 | -2.17 | 0.02 | -7.5% |
| 12Stocks.com: Charts, Trends, Fundamental Data and Performances of Industrial Stocks | |
|
We now take in-depth look at all Industrial stocks including charts, multi-period performances and overall trends (as measured by Smart Investing & Trading Score). One can sort Industrial stocks (click link to choose) by Daily, Weekly and by Year-to-Date performances. Also, one can sort by size of the company or by market capitalization. |
| Select Your Default Chart Type: | |||||
| |||||
| Click on stock symbol or name for detailed view. Click on to add stock symbol to your watchlist and to view watchlist. Quick View: Move mouse or cursor over "Daily" to quickly view daily Technical stock chart and over "Weekly" to view weekly Technical stock chart. | |||||

 | FA First Advantage Corporation |
| Sector: Industrials | |
| SubSector: Specialty Business Services | |
| MarketCap: 2170 Millions | |
| Recent Price: 16.31 Smart Investing & Trading Score: 58 | |
| Day Percent Change: -1.72% Day Change: -0.29 | |
| Week Change: -0.58% Year-to-date Change: -2.3% | |
| FA Links: Profile News Message Board | |
| Charts:- Daily , Weekly | |
| Add FA to Watchlist: View: Get Complete FA Trend Analysis ➞ | |
 | HXL Hexcel Corporation |
| Sector: Industrials | |
| SubSector: Aerospace/Defense Products & Services | |
| MarketCap: 2905.51 Millions | |
| Recent Price: 64.21 Smart Investing & Trading Score: 57 | |
| Day Percent Change: -1.86% Day Change: -1.22 | |
| Week Change: 0.08% Year-to-date Change: -12.9% | |
| HXL Links: Profile News Message Board | |
| Charts:- Daily , Weekly | |
| Add HXL to Watchlist: View: Get Complete HXL Trend Analysis ➞ | |
 | ENS EnerSys |
| Sector: Industrials | |
| SubSector: Industrial Electrical Equipment | |
| MarketCap: 2068.79 Millions | |
| Recent Price: 90.45 Smart Investing & Trading Score: 57 | |
| Day Percent Change: -1.46% Day Change: -1.34 | |
| Week Change: -0.91% Year-to-date Change: -10.4% | |
| ENS Links: Profile News Message Board | |
| Charts:- Daily , Weekly | |
| Add ENS to Watchlist: View: Get Complete ENS Trend Analysis ➞ | |
 | LEGH Legacy Housing Corporation |
| Sector: Industrials | |
| SubSector: Residential Construction | |
| MarketCap: 298.006 Millions | |
| Recent Price: 20.40 Smart Investing & Trading Score: 57 | |
| Day Percent Change: -1.21% Day Change: -0.25 | |
| Week Change: 0.49% Year-to-date Change: -19.1% | |
| LEGH Links: Profile News Message Board | |
| Charts:- Daily , Weekly | |
| Add LEGH to Watchlist: View: Get Complete LEGH Trend Analysis ➞ | |
 | ESLT Elbit Systems Ltd. |
| Sector: Industrials | |
| SubSector: Aerospace/Defense Products & Services | |
| MarketCap: 5770.01 Millions | |
| Recent Price: 202.81 Smart Investing & Trading Score: 57 | |
| Day Percent Change: -0.16% Day Change: -0.33 | |
| Week Change: 1.02% Year-to-date Change: -4.9% | |
| ESLT Links: Profile News Message Board | |
| Charts:- Daily , Weekly | |
| Add ESLT to Watchlist: View: Get Complete ESLT Trend Analysis ➞ | |
 | CAE CAE Inc. |
| Sector: Industrials | |
| SubSector: Aerospace/Defense Products & Services | |
| MarketCap: 3739.61 Millions | |
| Recent Price: 19.29 Smart Investing & Trading Score: 57 | |
| Day Percent Change: -0.36% Day Change: -0.07 | |
| Week Change: 1.31% Year-to-date Change: -10.7% | |
| CAE Links: Profile News Message Board | |
| Charts:- Daily , Weekly | |
| Add CAE to Watchlist: View: Get Complete CAE Trend Analysis ➞ | |
 | ESAB ESAB Corporation |
| Sector: Industrials | |
| SubSector: Metal Fabrication | |
| MarketCap: 3940 Millions | |
| Recent Price: 105.88 Smart Investing & Trading Score: 56 | |
| Day Percent Change: -1.83% Day Change: -1.97 | |
| Week Change: -1.84% Year-to-date Change: 21.7% | |
| ESAB Links: Profile News Message Board | |
| Charts:- Daily , Weekly | |
| Add ESAB to Watchlist: View: Get Complete ESAB Trend Analysis ➞ | |
 | SKY Skyline Champion Corporation |
| Sector: Industrials | |
| SubSector: Manufactured Housing | |
| MarketCap: 915.145 Millions | |
| Recent Price: 76.07 Smart Investing & Trading Score: 56 | |
| Day Percent Change: -1.79% Day Change: -1.39 | |
| Week Change: -0.37% Year-to-date Change: 2.4% | |
| SKY Links: Profile News Message Board | |
| Charts:- Daily , Weekly | |
| Add SKY to Watchlist: View: Get Complete SKY Trend Analysis ➞ | |
 | PSN Parsons Corporation |
| Sector: Industrials | |
| SubSector: Diversified Machinery | |
| MarketCap: 3021.16 Millions | |
| Recent Price: 78.51 Smart Investing & Trading Score: 56 | |
| Day Percent Change: -1.07% Day Change: -0.85 | |
| Week Change: -1.53% Year-to-date Change: 25.2% | |
| PSN Links: Profile News Message Board | |
| Charts:- Daily , Weekly | |
| Add PSN to Watchlist: View: Get Complete PSN Trend Analysis ➞ | |
 | ACA Arcosa, Inc. |
| Sector: Industrials | |
| SubSector: Farm & Construction Machinery | |
| MarketCap: 1692.57 Millions | |
| Recent Price: 76.02 Smart Investing & Trading Score: 55 | |
| Day Percent Change: -2.81% Day Change: -2.20 | |
| Week Change: -1.71% Year-to-date Change: -8.0% | |
| ACA Links: Profile News Message Board | |
| Charts:- Daily , Weekly | |
| Add ACA to Watchlist: View: Get Complete ACA Trend Analysis ➞ | |
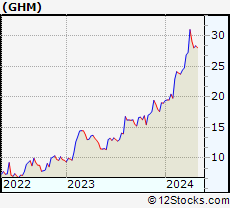 | GHM Graham Corporation |
| Sector: Industrials | |
| SubSector: Metal Fabrication | |
| MarketCap: 143.25 Millions | |
| Recent Price: 27.84 Smart Investing & Trading Score: 54 | |
| Day Percent Change: -1.76% Day Change: -0.50 | |
| Week Change: -1.83% Year-to-date Change: 46.8% | |
| GHM Links: Profile News Message Board | |
| Charts:- Daily , Weekly | |
| Add GHM to Watchlist: View: Get Complete GHM Trend Analysis ➞ | |
 | MIR Mirion Technologies, Inc. |
| Sector: Industrials | |
| SubSector: Specialty Industrial Machinery | |
| MarketCap: 1920 Millions | |
| Recent Price: 10.87 Smart Investing & Trading Score: 54 | |
| Day Percent Change: -1.36% Day Change: -0.15 | |
| Week Change: -1.98% Year-to-date Change: 6.0% | |
| MIR Links: Profile News Message Board | |
| Charts:- Daily , Weekly | |
| Add MIR to Watchlist: View: Get Complete MIR Trend Analysis ➞ | |
 | DCI Donaldson Company, Inc. |
| Sector: Industrials | |
| SubSector: Diversified Machinery | |
| MarketCap: 4993.46 Millions | |
| Recent Price: 72.20 Smart Investing & Trading Score: 54 | |
| Day Percent Change: -1.03% Day Change: -0.75 | |
| Week Change: -0.1% Year-to-date Change: 10.5% | |
| DCI Links: Profile News Message Board | |
| Charts:- Daily , Weekly | |
| Add DCI to Watchlist: View: Get Complete DCI Trend Analysis ➞ | |
 | LLAP Terran Orbital Corporation |
| Sector: Industrials | |
| SubSector: Aerospace & Defense | |
| MarketCap: 206 Millions | |
| Recent Price: 1.32 Smart Investing & Trading Score: 53 | |
| Day Percent Change: -2.94% Day Change: -0.04 | |
| Week Change: -1.49% Year-to-date Change: 15.3% | |
| LLAP Links: Profile News Message Board | |
| Charts:- Daily , Weekly | |
| Add LLAP to Watchlist: View: Get Complete LLAP Trend Analysis ➞ | |
 | TMHC Taylor Morrison Home Corporation |
| Sector: Industrials | |
| SubSector: Residential Construction | |
| MarketCap: 1336.76 Millions | |
| Recent Price: 56.01 Smart Investing & Trading Score: 53 | |
| Day Percent Change: -2.93% Day Change: -1.69 | |
| Week Change: -2.69% Year-to-date Change: 5.0% | |
| TMHC Links: Profile News Message Board | |
| Charts:- Daily , Weekly | |
| Add TMHC to Watchlist: View: Get Complete TMHC Trend Analysis ➞ | |
 | ULCC Frontier Group Holdings, Inc. |
| Sector: Industrials | |
| SubSector: Airlines | |
| MarketCap: 2160 Millions | |
| Recent Price: 6.04 Smart Investing & Trading Score: 53 | |
| Day Percent Change: -2.82% Day Change: -0.17 | |
| Week Change: -1.39% Year-to-date Change: 11.1% | |
| ULCC Links: Profile News Message Board | |
| Charts:- Daily , Weekly | |
| Add ULCC to Watchlist: View: Get Complete ULCC Trend Analysis ➞ | |
 | EVLV Evolv Technologies Holdings, Inc. |
| Sector: Industrials | |
| SubSector: Security & Protection Services | |
| MarketCap: 853 Millions | |
| Recent Price: 3.98 Smart Investing & Trading Score: 53 | |
| Day Percent Change: -2.33% Day Change: -0.10 | |
| Week Change: -3.52% Year-to-date Change: -15.7% | |
| EVLV Links: Profile News Message Board | |
| Charts:- Daily , Weekly | |
| Add EVLV to Watchlist: View: Get Complete EVLV Trend Analysis ➞ | |
 | PH Parker-Hannifin Corporation |
| Sector: Industrials | |
| SubSector: Industrial Equipment & Components | |
| MarketCap: 14888.9 Millions | |
| Recent Price: 544.91 Smart Investing & Trading Score: 53 | |
| Day Percent Change: -1.72% Day Change: -9.53 | |
| Week Change: -1.58% Year-to-date Change: 18.3% | |
| PH Links: Profile News Message Board | |
| Charts:- Daily , Weekly | |
| Add PH to Watchlist: View: Get Complete PH Trend Analysis ➞ | |
 | RDW Redwire Corporation |
| Sector: Industrials | |
| SubSector: Aerospace & Defense | |
| MarketCap: 160 Millions | |
| Recent Price: 3.78 Smart Investing & Trading Score: 53 | |
| Day Percent Change: -0.53% Day Change: -0.02 | |
| Week Change: -4.55% Year-to-date Change: 32.6% | |
| RDW Links: Profile News Message Board | |
| Charts:- Daily , Weekly | |
| Add RDW to Watchlist: View: Get Complete RDW Trend Analysis ➞ | |
 | AMBI Ambipar Emergency Response |
| Sector: Industrials | |
| SubSector: Waste Management | |
| MarketCap: 462 Millions | |
| Recent Price: 4.30 Smart Investing & Trading Score: 52 | |
| Day Percent Change: -1.15% Day Change: -0.05 | |
| Week Change: 0% Year-to-date Change: -45.3% | |
| AMBI Links: Profile News Message Board | |
| Charts:- Daily , Weekly | |
| Add AMBI to Watchlist: View: Get Complete AMBI Trend Analysis ➞ | |
 | AMPX Amprius Technologies, Inc. |
| Sector: Industrials | |
| SubSector: Electrical Equipment & Parts | |
| MarketCap: 608 Millions | |
| Recent Price: 1.87 Smart Investing & Trading Score: 52 | |
| Day Percent Change: -0.53% Day Change: -0.01 | |
| Week Change: 7.47% Year-to-date Change: -62.7% | |
| AMPX Links: Profile News Message Board | |
| Charts:- Daily , Weekly | |
| Add AMPX to Watchlist: View: Get Complete AMPX Trend Analysis ➞ | |
 | GFF Griffon Corporation |
| Sector: Industrials | |
| SubSector: General Building Materials | |
| MarketCap: 616 Millions | |
| Recent Price: 65.52 Smart Investing & Trading Score: 51 | |
| Day Percent Change: -3.25% Day Change: -2.20 | |
| Week Change: -4.03% Year-to-date Change: 7.5% | |
| GFF Links: Profile News Message Board | |
| Charts:- Daily , Weekly | |
| Add GFF to Watchlist: View: Get Complete GFF Trend Analysis ➞ | |
 | PLPC Preformed Line Products Company |
| Sector: Industrials | |
| SubSector: Industrial Electrical Equipment | |
| MarketCap: 221.779 Millions | |
| Recent Price: 121.52 Smart Investing & Trading Score: 51 | |
| Day Percent Change: -1.83% Day Change: -2.27 | |
| Week Change: -2.56% Year-to-date Change: -9.2% | |
| PLPC Links: Profile News Message Board | |
| Charts:- Daily , Weekly | |
| Add PLPC to Watchlist: View: Get Complete PLPC Trend Analysis ➞ | |
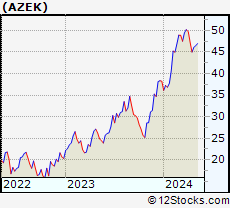 | AZEK The AZEK Company Inc. |
| Sector: Industrials | |
| SubSector: Building Products & Equipment | |
| MarketCap: 55127 Millions | |
| Recent Price: 45.64 Smart Investing & Trading Score: 51 | |
| Day Percent Change: -1.68% Day Change: -0.78 | |
| Week Change: -1.06% Year-to-date Change: 19.3% | |
| AZEK Links: Profile News Message Board | |
| Charts:- Daily , Weekly | |
| Add AZEK to Watchlist: View: Get Complete AZEK Trend Analysis ➞ | |
 | NPK National Presto Industries, Inc. |
| Sector: Industrials | |
| SubSector: Aerospace/Defense Products & Services | |
| MarketCap: 540.401 Millions | |
| Recent Price: 81.99 Smart Investing & Trading Score: 51 | |
| Day Percent Change: -0.04% Day Change: -0.03 | |
| Week Change: -1.19% Year-to-date Change: 2.1% | |
| NPK Links: Profile News Message Board | |
| Charts:- Daily , Weekly | |
| Add NPK to Watchlist: View: Get Complete NPK Trend Analysis ➞ | |
| For tabular summary view of above stock list: Summary View ➞ 0 - 25 , 25 - 50 , 50 - 75 , 75 - 100 , 100 - 125 , 125 - 150 , 150 - 175 , 175 - 200 , 200 - 225 , 225 - 250 , 250 - 275 , 275 - 300 | ||
| Click To Change The Sort Order: By Market Cap or Company Size Performance: Year-to-date, Week and Day | |
| Select Chart Type: | ||
|
Best Stocks Today 12Stocks.com |
© 2024 12Stocks.com Terms & Conditions Privacy Contact Us
All Information Provided Only For Education And Not To Be Used For Investing or Trading. See Terms & Conditions


One More Thing ... Get Best Stocks Delivered Daily!
Never Ever Miss A Move With Our Top Ten Stocks Lists
Find Best Stocks In Any Market - Bull or Bear Market
Take A Peek At Our Top Ten Stocks Lists: Daily, Weekly, Year-to-Date & Top Trends
Find Best Stocks In Any Market - Bull or Bear Market
Take A Peek At Our Top Ten Stocks Lists: Daily, Weekly, Year-to-Date & Top Trends
Industrial Stocks With Best Up Trends [0-bearish to 100-bullish]: Allegheny Technologies[100], 3M [100], Timken [100], Carpenter Technology[100], IES [100], AAON [100], Carrier Global[100], VCI Global[100], TPI Composites[95], AeroVironment [95], AAR [95]
Best Industrial Stocks Year-to-Date:
Intuitive Machines[108.23%], FTAI Infrastructure[86.38%], Tutor Perini[82.75%], NuScale Power[79.84%], BiomX [71.07%], IES [70.8%], Caesarstone [68.18%], EMCOR [65.79%], Powell Industries[61.81%], Masonite [56.57%], ADS-TEC Energy[51.47%] Best Industrial Stocks This Week:
BiomX [36.86%], Hydrofarm [20.2%], Allegheny Technologies[15.36%], TPI Composites[14.75%], Novonix [9.13%], GrafTech [8.86%], Woodward [7.83%], Amprius Technologies[7.47%], ESS Tech[7.12%], Shengfeng Development[6.67%], 3M [5.1%] Best Industrial Stocks Daily:
BiomX [19.75%], Hydrofarm [18.87%], Allegheny Technologies[15.03%], Woodward [7.48%], TPI Composites[7.05%], Caesarstone [6.79%], 3M [4.72%], GrafTech [3.61%], Unifi [3.11%], Shengfeng Development[2.92%], Timken [2.91%]