
 Login Sign Up


| |||||
 |  | ||||

| 12Stocks.com Market Intelligence |
Best Industrial Stocks
| In a hurry? Industrial Stocks Lists: Performance Trends Table, Stock Charts
Sort Industrial stocks: Daily, Weekly, Year-to-Date, Market Cap & Trends. Filter Industrial stocks list by size:All Industrial Large Mid-Range Small |
| 12Stocks.com Industrial Stocks Performances & Trends Daily | |||||||||
|
|  The overall Smart Investing & Trading Score is 83 (0-bearish to 100-bullish) which puts Industrial sector in short term bullish trend. The Smart Investing & Trading Score from previous trading session is 56 and hence an improvement of trend.
| ||||||||
Here are the Smart Investing & Trading Scores of the most requested Industrial stocks at 12Stocks.com (click stock name for detailed review):
|


| 12Stocks.com: Investing in Industrial sector with Stocks | |
|
The following table helps investors and traders sort through current performance and trends (as measured by Smart Investing & Trading Score) of various
stocks in the Industrial sector. Quick View: Move mouse or cursor over stock symbol (ticker) to view short-term Technical chart and over stock name to view long term chart. Click on  to add stock symbol to your watchlist and to add stock symbol to your watchlist and  to view watchlist. Click on any ticker or stock name for detailed market intelligence report for that stock. to view watchlist. Click on any ticker or stock name for detailed market intelligence report for that stock. |
12Stocks.com Performance of Stocks in Industrial Sector
| Ticker | Stock Name | Watchlist | Category | Recent Price | Smart Investing & Trading Score | Change % | YTD Change% |
| ULCC | Frontier |   | Airlines | 6.09 | 51 | -0.41% | 12.25% |
| CNM | Core & Main | | Industrial Distribution | 57.23 | 51 | -0.16% | 41.24% |
| NPO | EnPro Industries | | Equipment | 152.31 | 51 | 1.11% | -2.83% |
| LEN | Lennar | | Residential | 155.06 | 51 | 0.50% | 4.04% |
| MAS | Masco | | Building Materials | 70.05 | 51 | 0.29% | 4.58% |
| DHI | D.R. Horton | | Residential | 145.62 | 51 | 0.20% | -4.18% |
| SITE | SiteOne Landscape | | Small Tools & Accessories | 161.99 | 51 | -0.34% | -0.32% |
| ESLT | Elbit Systems | | Aerospace/Defense | 204.03 | 50 | 1.63% | -4.32% |
| GMRE | Global Medical | | Conglomerates | 8.31 | 49 | 2.47% | -25.14% |
| BBCP | Concrete Pumping | | Building Materials | 6.91 | 49 | 1.40% | -15.79% |
| MHO | M/I Homes | | Residential | 121.04 | 49 | 0.80% | -12.13% |
| MMM | 3M | | Machinery | 92.20 | 49 | 0.40% | -15.66% |
| EOSE | Eos Energy | | Electrical Equipment & Parts | 0.77 | 49 | -4.44% | -29.68% |
| CAT | Caterpillar | | Machinery | 350.48 | 48 | 2.07% | 18.54% |
| CLH | Clean Harbors | | Waste Mgmt | 194.38 | 48 | 0.19% | 11.38% |
| HOLI | Hollysys Automation | | Electrical Equipment | 24.60 | 48 | 0.20% | -6.64% |
| SEB | Seaboard | | Conglomerates | 3296.05 | 47 | 2.77% | -7.68% |
| AGCO | AGCO | | Machinery | 119.55 | 47 | 2.52% | -1.53% |
| SPCE | Virgin Galactic | | Conglomerates | 0.89 | 47 | -0.15% | -63.83% |
| NVX | Novonix | | Electrical Equipment & Parts | 2.34 | 46 | 1.52% | 19.74% |
| HAYW | Hayward | | Electrical Equipment & Parts | 13.96 | 46 | 1.34% | 2.53% |
| BZ | Kanzhun | | Staffing & Employment | 20.19 | 46 | 0.45% | 22.18% |
| SWIM | Latham | | Building Products & Equipment | 2.97 | 46 | -2.62% | 12.50% |
| GTLS | Chart Industries | | Fabrication | 148.67 | 46 | -0.89% | 9.05% |
| ESAB | ESAB | | Fabrication | 107.43 | 46 | -0.40% | 23.51% |
| For chart view version of above stock list: Chart View ➞ 0 - 25 , 25 - 50 , 50 - 75 , 75 - 100 , 100 - 125 , 125 - 150 , 150 - 175 , 175 - 200 , 200 - 225 , 225 - 250 , 250 - 275 , 275 - 300 | ||
 | Click To Change The Sort Order: By Market Cap or Company Size Performance: Year-to-date, Week and Day |  |
|
Get the most comprehensive stock market coverage daily at 12Stocks.com ➞ Best Stocks Today ➞ Best Stocks Weekly ➞ Best Stocks Year-to-Date ➞ Best Stocks Trends ➞  Best Stocks Today 12Stocks.com Best Nasdaq Stocks ➞ Best S&P 500 Stocks ➞ Best Tech Stocks ➞ Best Biotech Stocks ➞ |
| Detailed Overview of Industrial Stocks |
| Industrial Technical Overview, Leaders & Laggards, Top Industrial ETF Funds & Detailed Industrial Stocks List, Charts, Trends & More |
| Industrial Sector: Technical Analysis, Trends & YTD Performance | |
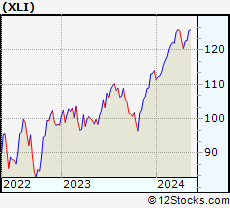
| Industrial sector is composed of stocks
from industrial machinery, aerospace, defense, farm/construction
and industrial services subsectors. Industrial sector, as represented by XLI, an exchange-traded fund [ETF] that holds basket of Industrial stocks (e.g, Caterpillar, Boeing) is up by 8.18% and is currently outperforming the overall market by 1.89% year-to-date. Below is a quick view of Technical charts and trends: |
|
 XLI Weekly Chart |
|
| Long Term Trend: Very Good | |
| Medium Term Trend: Good | |
 XLI Daily Chart |
|
| Short Term Trend: Very Good | |
| Overall Trend Score: 83 | |
| YTD Performance: 8.18% | |
| **Trend Scores & Views Are Only For Educational Purposes And Not For Investing | |
| 12Stocks.com: Top Performing Industrial Sector Stocks | ||||||||||||||||||||||||||||||||||||||||||||||||
 The top performing Industrial sector stocks year to date are
Now, more recently, over last week, the top performing Industrial sector stocks on the move are


|
||||||||||||||||||||||||||||||||||||||||||||||||
| 12Stocks.com: Investing in Industrial Sector using Exchange Traded Funds | |
|
The following table shows list of key exchange traded funds (ETF) that
help investors track Industrial Index. For detailed view, check out our ETF Funds section of our website. Quick View: Move mouse or cursor over ETF symbol (ticker) to view short-term Technical chart and over ETF name to view long term chart. Click on ticker or stock name for detailed view. Click on to add stock symbol to your watchlist and to view watchlist. |
12Stocks.com List of ETFs that track Industrial Index
| Ticker | ETF Name | Watchlist | Recent Price | Smart Investing & Trading Score | Change % | Week % | Year-to-date % |
| XLI | Industrial | | 123.32 | 83 | 0.54 | 0.54 | 8.18% |
| UXI | Industrials | | 33.12 | 83 | 1.19 | 1.19 | 15.02% |
| PPA | Aerospace & Defense | | 101.64 | 90 | 0.72 | 0.72 | 10.29% |
| ITA | Aerospace & Defense | | 130.84 | 100 | 1.01 | 1.01 | 3.35% |
| ITB | Home Construction | | 106.14 | 58 | 0.46 | 0.46 | 4.34% |
| XHB | Homebuilders | | 104.48 | 78 | 0.73 | 0.73 | 9.22% |
| SIJ | Short Industrials | | 9.76 | 25 | -0.61 | -0.61 | -13.93% |
| IYJ | Industrials | | 121.89 | 70 | 0.27 | 0.27 | 6.58% |
| EXI | Global Industrials | | 136.60 | 78 | 0.38 | 0.38 | 7.2% |
| VIS | Industrials | | 238.04 | 83 | 0.65 | 0.65 | 7.99% |
| PSCI | SmallCap Industrials | | 121.38 | 70 | 0.01 | 0.01 | 4.68% |
| XAR | Aerospace & Defense | | 136.92 | 95 | 0.60 | 0.6 | 1.11% |
| ARKQ | ARK Industrial Innovation | | 54.56 | 95 | 2.24 | 2.24 | -5.45% |
| 12Stocks.com: Charts, Trends, Fundamental Data and Performances of Industrial Stocks | |
|
We now take in-depth look at all Industrial stocks including charts, multi-period performances and overall trends (as measured by Smart Investing & Trading Score). One can sort Industrial stocks (click link to choose) by Daily, Weekly and by Year-to-Date performances. Also, one can sort by size of the company or by market capitalization. |
| Select Your Default Chart Type: | |||||
| |||||
| Click on stock symbol or name for detailed view. Click on to add stock symbol to your watchlist and to view watchlist. Quick View: Move mouse or cursor over "Daily" to quickly view daily Technical stock chart and over "Weekly" to view weekly Technical stock chart. | |||||

 | ULCC Frontier Group Holdings, Inc. |
| Sector: Industrials | |
| SubSector: Airlines | |
| MarketCap: 2160 Millions | |
| Recent Price: 6.09 Smart Investing & Trading Score: 51 | |
| Day Percent Change: -0.41% Day Change: -0.03 | |
| Week Change: -0.41% Year-to-date Change: 12.3% | |
| ULCC Links: Profile News Message Board | |
| Charts:- Daily , Weekly | |
| Add ULCC to Watchlist: View: Get Complete ULCC Trend Analysis ➞ | |
 | CNM Core & Main, Inc. |
| Sector: Industrials | |
| SubSector: Industrial Distribution | |
| MarketCap: 7150 Millions | |
| Recent Price: 57.23 Smart Investing & Trading Score: 51 | |
| Day Percent Change: -0.16% Day Change: -0.09 | |
| Week Change: -0.16% Year-to-date Change: 41.2% | |
| CNM Links: Profile News Message Board | |
| Charts:- Daily , Weekly | |
| Add CNM to Watchlist: View: Get Complete CNM Trend Analysis ➞ | |
 | NPO EnPro Industries, Inc. |
| Sector: Industrials | |
| SubSector: Industrial Equipment & Components | |
| MarketCap: 734.309 Millions | |
| Recent Price: 152.31 Smart Investing & Trading Score: 51 | |
| Day Percent Change: 1.11% Day Change: 1.67 | |
| Week Change: 1.11% Year-to-date Change: -2.8% | |
| NPO Links: Profile News Message Board | |
| Charts:- Daily , Weekly | |
| Add NPO to Watchlist: View: Get Complete NPO Trend Analysis ➞ | |
 | LEN Lennar Corporation |
| Sector: Industrials | |
| SubSector: Residential Construction | |
| MarketCap: 11926.6 Millions | |
| Recent Price: 155.06 Smart Investing & Trading Score: 51 | |
| Day Percent Change: 0.50% Day Change: 0.77 | |
| Week Change: 0.5% Year-to-date Change: 4.0% | |
| LEN Links: Profile News Message Board | |
| Charts:- Daily , Weekly | |
| Add LEN to Watchlist: View: Get Complete LEN Trend Analysis ➞ | |
 | MAS Masco Corporation |
| Sector: Industrials | |
| SubSector: General Building Materials | |
| MarketCap: 8655.63 Millions | |
| Recent Price: 70.05 Smart Investing & Trading Score: 51 | |
| Day Percent Change: 0.29% Day Change: 0.20 | |
| Week Change: 0.29% Year-to-date Change: 4.6% | |
| MAS Links: Profile News Message Board | |
| Charts:- Daily , Weekly | |
| Add MAS to Watchlist: View: Get Complete MAS Trend Analysis ➞ | |
 | DHI D.R. Horton, Inc. |
| Sector: Industrials | |
| SubSector: Residential Construction | |
| MarketCap: 13372.6 Millions | |
| Recent Price: 145.62 Smart Investing & Trading Score: 51 | |
| Day Percent Change: 0.20% Day Change: 0.29 | |
| Week Change: 0.2% Year-to-date Change: -4.2% | |
| DHI Links: Profile News Message Board | |
| Charts:- Daily , Weekly | |
| Add DHI to Watchlist: View: Get Complete DHI Trend Analysis ➞ | |
 | SITE SiteOne Landscape Supply, Inc. |
| Sector: Industrials | |
| SubSector: Small Tools & Accessories | |
| MarketCap: 2733.56 Millions | |
| Recent Price: 161.99 Smart Investing & Trading Score: 51 | |
| Day Percent Change: -0.34% Day Change: -0.55 | |
| Week Change: -0.34% Year-to-date Change: -0.3% | |
| SITE Links: Profile News Message Board | |
| Charts:- Daily , Weekly | |
| Add SITE to Watchlist: View: Get Complete SITE Trend Analysis ➞ | |
 | ESLT Elbit Systems Ltd. |
| Sector: Industrials | |
| SubSector: Aerospace/Defense Products & Services | |
| MarketCap: 5770.01 Millions | |
| Recent Price: 204.03 Smart Investing & Trading Score: 50 | |
| Day Percent Change: 1.63% Day Change: 3.27 | |
| Week Change: 1.63% Year-to-date Change: -4.3% | |
| ESLT Links: Profile News Message Board | |
| Charts:- Daily , Weekly | |
| Add ESLT to Watchlist: View: Get Complete ESLT Trend Analysis ➞ | |
 | GMRE Global Medical REIT Inc. |
| Sector: Industrials | |
| SubSector: Conglomerates | |
| MarketCap: 529.748 Millions | |
| Recent Price: 8.31 Smart Investing & Trading Score: 49 | |
| Day Percent Change: 2.47% Day Change: 0.20 | |
| Week Change: 2.47% Year-to-date Change: -25.1% | |
| GMRE Links: Profile News Message Board | |
| Charts:- Daily , Weekly | |
| Add GMRE to Watchlist: View: Get Complete GMRE Trend Analysis ➞ | |
 | BBCP Concrete Pumping Holdings, Inc. |
| Sector: Industrials | |
| SubSector: General Building Materials | |
| MarketCap: 263.653 Millions | |
| Recent Price: 6.91 Smart Investing & Trading Score: 49 | |
| Day Percent Change: 1.40% Day Change: 0.10 | |
| Week Change: 1.4% Year-to-date Change: -15.8% | |
| BBCP Links: Profile News Message Board | |
| Charts:- Daily , Weekly | |
| Add BBCP to Watchlist: View: Get Complete BBCP Trend Analysis ➞ | |
 | MHO M/I Homes, Inc. |
| Sector: Industrials | |
| SubSector: Residential Construction | |
| MarketCap: 437.106 Millions | |
| Recent Price: 121.04 Smart Investing & Trading Score: 49 | |
| Day Percent Change: 0.80% Day Change: 0.97 | |
| Week Change: 0.8% Year-to-date Change: -12.1% | |
| MHO Links: Profile News Message Board | |
| Charts:- Daily , Weekly | |
| Add MHO to Watchlist: View: Get Complete MHO Trend Analysis ➞ | |
 | MMM 3M Company |
| Sector: Industrials | |
| SubSector: Diversified Machinery | |
| MarketCap: 79237.7 Millions | |
| Recent Price: 92.20 Smart Investing & Trading Score: 49 | |
| Day Percent Change: 0.40% Day Change: 0.37 | |
| Week Change: 0.4% Year-to-date Change: -15.7% | |
| MMM Links: Profile News Message Board | |
| Charts:- Daily , Weekly | |
| Add MMM to Watchlist: View: Get Complete MMM Trend Analysis ➞ | |
 | EOSE Eos Energy Enterprises, Inc. |
| Sector: Industrials | |
| SubSector: Electrical Equipment & Parts | |
| MarketCap: 76627 Millions | |
| Recent Price: 0.77 Smart Investing & Trading Score: 49 | |
| Day Percent Change: -4.44% Day Change: -0.04 | |
| Week Change: -4.44% Year-to-date Change: -29.7% | |
| EOSE Links: Profile News Message Board | |
| Charts:- Daily , Weekly | |
| Add EOSE to Watchlist: View: Get Complete EOSE Trend Analysis ➞ | |
 | CAT Caterpillar Inc. |
| Sector: Industrials | |
| SubSector: Farm & Construction Machinery | |
| MarketCap: 58636 Millions | |
| Recent Price: 350.48 Smart Investing & Trading Score: 48 | |
| Day Percent Change: 2.07% Day Change: 7.10 | |
| Week Change: 2.07% Year-to-date Change: 18.5% | |
| CAT Links: Profile News Message Board | |
| Charts:- Daily , Weekly | |
| Add CAT to Watchlist: View: Get Complete CAT Trend Analysis ➞ | |
 | CLH Clean Harbors, Inc. |
| Sector: Industrials | |
| SubSector: Waste Management | |
| MarketCap: 2391.28 Millions | |
| Recent Price: 194.38 Smart Investing & Trading Score: 48 | |
| Day Percent Change: 0.19% Day Change: 0.38 | |
| Week Change: 0.19% Year-to-date Change: 11.4% | |
| CLH Links: Profile News Message Board | |
| Charts:- Daily , Weekly | |
| Add CLH to Watchlist: View: Get Complete CLH Trend Analysis ➞ | |
 | HOLI Hollysys Automation Technologies Ltd. |
| Sector: Industrials | |
| SubSector: Industrial Electrical Equipment | |
| MarketCap: 668.379 Millions | |
| Recent Price: 24.60 Smart Investing & Trading Score: 48 | |
| Day Percent Change: 0.20% Day Change: 0.05 | |
| Week Change: 0.2% Year-to-date Change: -6.6% | |
| HOLI Links: Profile News Message Board | |
| Charts:- Daily , Weekly | |
| Add HOLI to Watchlist: View: Get Complete HOLI Trend Analysis ➞ | |
 | SEB Seaboard Corporation |
| Sector: Industrials | |
| SubSector: Conglomerates | |
| MarketCap: 3161.78 Millions | |
| Recent Price: 3296.05 Smart Investing & Trading Score: 47 | |
| Day Percent Change: 2.77% Day Change: 88.83 | |
| Week Change: 2.77% Year-to-date Change: -7.7% | |
| SEB Links: Profile News Message Board | |
| Charts:- Daily , Weekly | |
| Add SEB to Watchlist: View: Get Complete SEB Trend Analysis ➞ | |
 | AGCO AGCO Corporation |
| Sector: Industrials | |
| SubSector: Farm & Construction Machinery | |
| MarketCap: 3399.57 Millions | |
| Recent Price: 119.55 Smart Investing & Trading Score: 47 | |
| Day Percent Change: 2.52% Day Change: 2.94 | |
| Week Change: 2.52% Year-to-date Change: -1.5% | |
| AGCO Links: Profile News Message Board | |
| Charts:- Daily , Weekly | |
| Add AGCO to Watchlist: View: Get Complete AGCO Trend Analysis ➞ | |
 | SPCE Virgin Galactic Holdings, Inc. |
| Sector: Industrials | |
| SubSector: Conglomerates | |
| MarketCap: 2612.48 Millions | |
| Recent Price: 0.89 Smart Investing & Trading Score: 47 | |
| Day Percent Change: -0.15% Day Change: 0.00 | |
| Week Change: -0.15% Year-to-date Change: -63.8% | |
| SPCE Links: Profile News Message Board | |
| Charts:- Daily , Weekly | |
| Add SPCE to Watchlist: View: Get Complete SPCE Trend Analysis ➞ | |
 | NVX Novonix Limited |
| Sector: Industrials | |
| SubSector: Electrical Equipment & Parts | |
| MarketCap: 316 Millions | |
| Recent Price: 2.34 Smart Investing & Trading Score: 46 | |
| Day Percent Change: 1.52% Day Change: 0.04 | |
| Week Change: 1.52% Year-to-date Change: 19.7% | |
| NVX Links: Profile News Message Board | |
| Charts:- Daily , Weekly | |
| Add NVX to Watchlist: View: Get Complete NVX Trend Analysis ➞ | |
 | HAYW Hayward Holdings, Inc. |
| Sector: Industrials | |
| SubSector: Electrical Equipment & Parts | |
| MarketCap: 2670 Millions | |
| Recent Price: 13.96 Smart Investing & Trading Score: 46 | |
| Day Percent Change: 1.34% Day Change: 0.19 | |
| Week Change: 1.34% Year-to-date Change: 2.5% | |
| HAYW Links: Profile News Message Board | |
| Charts:- Daily , Weekly | |
| Add HAYW to Watchlist: View: Get Complete HAYW Trend Analysis ➞ | |
 | BZ Kanzhun Limited |
| Sector: Industrials | |
| SubSector: Staffing & Employment Services | |
| MarketCap: 6680 Millions | |
| Recent Price: 20.19 Smart Investing & Trading Score: 46 | |
| Day Percent Change: 0.45% Day Change: 0.09 | |
| Week Change: 0.45% Year-to-date Change: 22.2% | |
| BZ Links: Profile News Message Board | |
| Charts:- Daily , Weekly | |
| Add BZ to Watchlist: View: Get Complete BZ Trend Analysis ➞ | |
 | SWIM Latham Group, Inc. |
| Sector: Industrials | |
| SubSector: Building Products & Equipment | |
| MarketCap: 388 Millions | |
| Recent Price: 2.97 Smart Investing & Trading Score: 46 | |
| Day Percent Change: -2.62% Day Change: -0.08 | |
| Week Change: -2.62% Year-to-date Change: 12.5% | |
| SWIM Links: Profile News Message Board | |
| Charts:- Daily , Weekly | |
| Add SWIM to Watchlist: View: Get Complete SWIM Trend Analysis ➞ | |
 | GTLS Chart Industries, Inc. |
| Sector: Industrials | |
| SubSector: Metal Fabrication | |
| MarketCap: 751.15 Millions | |
| Recent Price: 148.67 Smart Investing & Trading Score: 46 | |
| Day Percent Change: -0.89% Day Change: -1.33 | |
| Week Change: -0.89% Year-to-date Change: 9.1% | |
| GTLS Links: Profile News Message Board | |
| Charts:- Daily , Weekly | |
| Add GTLS to Watchlist: View: Get Complete GTLS Trend Analysis ➞ | |
 | ESAB ESAB Corporation |
| Sector: Industrials | |
| SubSector: Metal Fabrication | |
| MarketCap: 3940 Millions | |
| Recent Price: 107.43 Smart Investing & Trading Score: 46 | |
| Day Percent Change: -0.40% Day Change: -0.43 | |
| Week Change: -0.4% Year-to-date Change: 23.5% | |
| ESAB Links: Profile News Message Board | |
| Charts:- Daily , Weekly | |
| Add ESAB to Watchlist: View: Get Complete ESAB Trend Analysis ➞ | |
| For tabular summary view of above stock list: Summary View ➞ 0 - 25 , 25 - 50 , 50 - 75 , 75 - 100 , 100 - 125 , 125 - 150 , 150 - 175 , 175 - 200 , 200 - 225 , 225 - 250 , 250 - 275 , 275 - 300 | ||
| Click To Change The Sort Order: By Market Cap or Company Size Performance: Year-to-date, Week and Day | |
| Select Chart Type: | ||
|
Best Stocks Today 12Stocks.com |
© 2024 12Stocks.com Terms & Conditions Privacy Contact Us
All Information Provided Only For Education And Not To Be Used For Investing or Trading. See Terms & Conditions


One More Thing ... Get Best Stocks Delivered Daily!
Never Ever Miss A Move With Our Top Ten Stocks Lists
Find Best Stocks In Any Market - Bull or Bear Market
Take A Peek At Our Top Ten Stocks Lists: Daily, Weekly, Year-to-Date & Top Trends
Find Best Stocks In Any Market - Bull or Bear Market
Take A Peek At Our Top Ten Stocks Lists: Daily, Weekly, Year-to-Date & Top Trends
Industrial Stocks With Best Up Trends [0-bearish to 100-bullish]: TPI Composites[100], AAON [100], Carrier Global[100], IES [100], Owens Corning[100], TriMas [100], Tutor Perini[100], Lockheed Martin[100], Hillenbrand [100], TRI Pointe[100], Carpenter Technology[100]
Best Industrial Stocks Year-to-Date:
Intuitive Machines[125.93%], Tutor Perini[97.42%], FTAI Infrastructure[89.59%], NuScale Power[87.91%], IES [69.76%], EMCOR [69.17%], Powell Industries[68.74%], Caesarstone [57.89%], Masonite [56.67%], ADS-TEC Energy[50.77%], Comfort Systems[50.42%] Best Industrial Stocks This Week:
Amprius Technologies[14.37%], ESS Tech[13.67%], TPI Composites[8.81%], Hertz Global[8.26%], BiomX [6.14%], System1 [5.49%], Shengfeng Development[4.85%], FuelCell Energy[4.4%], Energy Recovery[3.87%], Li-Cycle [3.86%], Ballard Power[3.85%] Best Industrial Stocks Daily:
Amprius Technologies[14.37%], ESS Tech[13.67%], TPI Composites[8.81%], Hertz Global[8.26%], BiomX [6.14%], System1 [5.49%], Shengfeng Development[4.85%], FuelCell Energy[4.40%], Energy Recovery[3.87%], Li-Cycle [3.86%], Ballard Power[3.85%]