
 Login Sign Up


| |||||
 |  | ||||

| 12Stocks.com Market Intelligence |
Best Industrial Stocks
| In a hurry? Industrial Stocks Lists: Performance Trends Table, Stock Charts
Sort Industrial stocks: Daily, Weekly, Year-to-Date, Market Cap & Trends. Filter Industrial stocks list by size:All Industrial Large Mid-Range Small |
| 12Stocks.com Industrial Stocks Performances & Trends Daily | |||||||||
|
|  The overall Smart Investing & Trading Score is 30 (0-bearish to 100-bullish) which puts Industrial sector in short term bearish to neutral trend. The Smart Investing & Trading Score from previous trading session is 40 and hence a deterioration of trend.
| ||||||||
Here are the Smart Investing & Trading Scores of the most requested Industrial stocks at 12Stocks.com (click stock name for detailed review):
|


| 12Stocks.com: Investing in Industrial sector with Stocks | |
|
The following table helps investors and traders sort through current performance and trends (as measured by Smart Investing & Trading Score) of various
stocks in the Industrial sector. Quick View: Move mouse or cursor over stock symbol (ticker) to view short-term Technical chart and over stock name to view long term chart. Click on  to add stock symbol to your watchlist and to add stock symbol to your watchlist and  to view watchlist. Click on any ticker or stock name for detailed market intelligence report for that stock. to view watchlist. Click on any ticker or stock name for detailed market intelligence report for that stock. |
12Stocks.com Performance of Stocks in Industrial Sector
| Ticker | Stock Name | Watchlist | Category | Recent Price | Smart Investing & Trading Score | Change % | YTD Change% |
| MTZ | MasTec |   | Heavy Construction | 181.69 | 60 | 0.67% | 27.57% |
| WWD | Woodward | | Aerospace/Defense | 246.82 | 60 | 0.65% | 49.34% |
| LXFR | Luxfer | | Machinery | 13.42 | 60 | 0.56% | -1.10% |
| SPCE | Virgin Galactic | | Conglomerates | 3.11 | 60 | 0.34% | -49.15% |
| SITE | SiteOne Landscape | | Small Tools & Accessories | 143.24 | 60 | 0.15% | 4.75% |
| GMRE | Global Medical | | Conglomerates | 7.50 | 60 | 0.14% | -4.77% |
| GRC | Gorman-Rupp | | Machinery | 42.77 | 60 | 0.00% | 9.79% |
| OC | Owens Corning | | Building Materials | 150.17 | 60 | -0.09% | -11.60% |
| TPH | TRI Pointe | | Residential | 35.33 | 60 | -0.09% | -5.49% |
| AWI | Armstrong World | | Building Materials | 195.77 | 60 | -0.19% | 37.73% |
| MIDD | Middleby | | Machinery | 136.85 | 60 | -0.21% | -3.93% |
| LECO | Loln Electric | | Small Tools & Accessories | 242.63 | 60 | -0.24% | 27.98% |
| PH | Parker-Hannifin | | Equipment | 745.61 | 60 | -0.58% | 6.00% |
| ERII | Energy Recovery | | Pollution & Treatment Controls | 14.21 | 60 | -1.05% | -3.47% |
| MLI | Mueller Industries | | Fabrication | 95.94 | 60 | -1.09% | 14.98% |
| ASTE | Astec Industries | | Machinery | 46.29 | 60 | -1.22% | 30.88% |
| MLM | Martin Marietta | | Building Materials | 607.94 | 60 | -1.37% | 12.07% |
| WTS | Watts Water | | Equipment | 276.90 | 60 | -1.83% | 33.96% |
| EVLV | Evolv Technologies | | Security & Protection | 8.24 | 60 | -1.88% | 98.23% |
| PACK | Ranpak | | Conglomerates | 5.28 | 60 | -2.05% | -37.35% |
| OSIS | OSI Systems | | Electrical Equipment | 230.05 | 60 | -2.46% | 30.14% |
| SFWL | Shengfeng Development | | Integrated Freight & Logistics | 1.13 | 59 | 2.94% | -3.73% |
| ATMU | Atmus Filtration | | Pollution & Treatment Controls | 44.52 | 56 | -0.12% | 8.15% |
| CLCO | Cool | | Marine Shipping | 8.09 | 53 | 2.46% | -0.38% |
| CRGO | Freightos | | Integrated Freight & Logistics | 3.28 | 53 | -1.53% | 5.57% |
| For chart view version of above stock list: Chart View ➞ 0 - 25 , 25 - 50 , 50 - 75 , 75 - 100 , 100 - 125 , 125 - 150 , 150 - 175 , 175 - 200 , 200 - 225 , 225 - 250 , 250 - 275 , 275 - 300 | ||
 | Click To Change The Sort Order: By Market Cap or Company Size Performance: Year-to-date, Week and Day |  |
|
Get the most comprehensive stock market coverage daily at 12Stocks.com ➞ Best Stocks Today ➞ Best Stocks Weekly ➞ Best Stocks Year-to-Date ➞ Best Stocks Trends ➞  Best Stocks Today 12Stocks.com Best Nasdaq Stocks ➞ Best S&P 500 Stocks ➞ Best Tech Stocks ➞ Best Biotech Stocks ➞ |
| Detailed Overview of Industrial Stocks |
| Industrial Technical Overview, Leaders & Laggards, Top Industrial ETF Funds & Detailed Industrial Stocks List, Charts, Trends & More |
| Industrial Sector: Technical Analysis, Trends & YTD Performance | |
| Industrial sector is composed of stocks
from industrial machinery, aerospace, defense, farm/construction
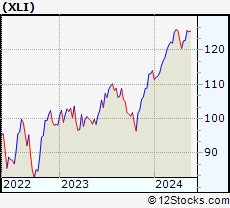
and industrial services subsectors. Industrial sector, as represented by XLI, an exchange-traded fund [ETF] that holds basket of Industrial stocks (e.g, Caterpillar, Boeing) is up by 11.44% and is currently outperforming the overall market by 4.65% year-to-date. Below is a quick view of Technical charts and trends: |
|
 XLI Weekly Chart |
|
| Long Term Trend: Very Good | |
| Medium Term Trend: Very Good | |
 XLI Daily Chart |
|
| Short Term Trend: Not Good | |
| Overall Trend Score: 30 | |
| YTD Performance: 11.44% | |
| **Trend Scores & Views Are Only For Educational Purposes And Not For Investing | |
| 12Stocks.com: Top Performing Industrial Sector Stocks | ||||||||||||||||||||||||||||||||||||||||||||||||
 The top performing Industrial sector stocks year to date are
Now, more recently, over last week, the top performing Industrial sector stocks on the move are


|
||||||||||||||||||||||||||||||||||||||||||||||||
| 12Stocks.com: Investing in Industrial Sector using Exchange Traded Funds | |
|
The following table shows list of key exchange traded funds (ETF) that
help investors track Industrial Index. For detailed view, check out our ETF Funds section of our website. Quick View: Move mouse or cursor over ETF symbol (ticker) to view short-term Technical chart and over ETF name to view long term chart. Click on ticker or stock name for detailed view. Click on to add stock symbol to your watchlist and to view watchlist. |
12Stocks.com List of ETFs that track Industrial Index
| Ticker | ETF Name | Watchlist | Recent Price | Smart Investing & Trading Score | Change % | Week % | Year-to-date % |
| XLI | Industrial | | 152.01 | 30 | 1.7 | 1.86 | 11.44% |
| UXI | Industrials | | 45.12 | 20 | 3.19 | 3.54 | 16.37% |
| PPA | Aerospace & Defense | | 147.97 | 50 | 0.88 | 0.4 | 21.93% |
| ITA | Aerospace & Defense | | 198.42 | 50 | 0.53 | 0.47 | 25.5% |
| ITB | Home Construction | | 110.70 | 60 | 5.42 | 3.17 | 6.94% |
| XHB | Homebuilders | | 113.24 | 40 | 0.21 | -0.67 | 4.97% |
| SIJ | Short Industrials | | 11.97 | 70 | -3.12 | -3.42 | -20.76% |
| IYJ | Industrials | | 146.17 | 30 | -0.24 | -0.58 | 8.12% |
| EXI | Global Industrials | | 168.86 | 20 | -0.42 | -0.57 | 20.04% |
| VIS | Industrials | | 291.31 | 30 | -0.33 | -0.59 | 13.79% |
| PSCI | SmallCap Industrials | | 147.86 | 50 | -0.02 | -1.17 | 7.75% |
| XAR | Aerospace & Defense | | 217.44 | 40 | 0.62 | -1.47 | 28.91% |
| ARKQ | ARK Industrial Innovation | | 97.96 | 20 | 0.08 | -5.38 | 23.44% |
| 12Stocks.com: Charts, Trends, Fundamental Data and Performances of Industrial Stocks | |
|
We now take in-depth look at all Industrial stocks including charts, multi-period performances and overall trends (as measured by Smart Investing & Trading Score). One can sort Industrial stocks (click link to choose) by Daily, Weekly and by Year-to-Date performances. Also, one can sort by size of the company or by market capitalization. |
| Select Your Default Chart Type: | |||||
| |||||
| Click on stock symbol or name for detailed view. Click on to add stock symbol to your watchlist and to view watchlist. Quick View: Move mouse or cursor over "Daily" to quickly view daily Technical stock chart and over "Weekly" to view weekly Technical stock chart. | |||||

 | MTZ MasTec, Inc. |
| Sector: Industrials | |
| SubSector: Heavy Construction | |
| MarketCap: 2596.95 Millions | |
| Recent Price: 181.69 Smart Investing & Trading Score: 60 | |
| Day Percent Change: 0.67% Day Change: 1.16 | |
| Week Change: -2.43% Year-to-date Change: 27.6% | |
| MTZ Links: Profile News Message Board | |
| Charts:- Daily , Weekly | |
| Add MTZ to Watchlist: View: Get Complete MTZ Trend Analysis ➞ | |
 | WWD Woodward, Inc. |
| Sector: Industrials | |
| SubSector: Aerospace/Defense Products & Services | |
| MarketCap: 3764.01 Millions | |
| Recent Price: 246.82 Smart Investing & Trading Score: 60 | |
| Day Percent Change: 0.65% Day Change: 1.59 | |
| Week Change: 1.02% Year-to-date Change: 49.3% | |
| WWD Links: Profile News Message Board | |
| Charts:- Daily , Weekly | |
| Add WWD to Watchlist: View: Get Complete WWD Trend Analysis ➞ | |
 | LXFR Luxfer Holdings PLC |
| Sector: Industrials | |
| SubSector: Diversified Machinery | |
| MarketCap: 406.716 Millions | |
| Recent Price: 13.42 Smart Investing & Trading Score: 60 | |
| Day Percent Change: 0.56% Day Change: 0.07 | |
| Week Change: -0.48% Year-to-date Change: -1.1% | |
| LXFR Links: Profile News Message Board | |
| Charts:- Daily , Weekly | |
| Add LXFR to Watchlist: View: Get Complete LXFR Trend Analysis ➞ | |
 | SPCE Virgin Galactic Holdings, Inc. |
| Sector: Industrials | |
| SubSector: Conglomerates | |
| MarketCap: 2612.48 Millions | |
| Recent Price: 3.11 Smart Investing & Trading Score: 60 | |
| Day Percent Change: 0.34% Day Change: 0.01 | |
| Week Change: -0.99% Year-to-date Change: -49.2% | |
| SPCE Links: Profile News Message Board | |
| Charts:- Daily , Weekly | |
| Add SPCE to Watchlist: View: Get Complete SPCE Trend Analysis ➞ | |
 | SITE SiteOne Landscape Supply, Inc. |
| Sector: Industrials | |
| SubSector: Small Tools & Accessories | |
| MarketCap: 2733.56 Millions | |
| Recent Price: 143.24 Smart Investing & Trading Score: 60 | |
| Day Percent Change: 0.15% Day Change: 0.2 | |
| Week Change: -2.33% Year-to-date Change: 4.8% | |
| SITE Links: Profile News Message Board | |
| Charts:- Daily , Weekly | |
| Add SITE to Watchlist: View: Get Complete SITE Trend Analysis ➞ | |
 | GMRE Global Medical REIT Inc. |
| Sector: Industrials | |
| SubSector: Conglomerates | |
| MarketCap: 529.748 Millions | |
| Recent Price: 7.50 Smart Investing & Trading Score: 60 | |
| Day Percent Change: 0.14% Day Change: 0.01 | |
| Week Change: 3.7% Year-to-date Change: -4.8% | |
| GMRE Links: Profile News Message Board | |
| Charts:- Daily , Weekly | |
| Add GMRE to Watchlist: View: Get Complete GMRE Trend Analysis ➞ | |
 | GRC The Gorman-Rupp Company |
| Sector: Industrials | |
| SubSector: Diversified Machinery | |
| MarketCap: 729.616 Millions | |
| Recent Price: 42.77 Smart Investing & Trading Score: 60 | |
| Day Percent Change: 0% Day Change: 0 | |
| Week Change: -2.25% Year-to-date Change: 9.8% | |
| GRC Links: Profile News Message Board | |
| Charts:- Daily , Weekly | |
| Add GRC to Watchlist: View: Get Complete GRC Trend Analysis ➞ | |
 | OC Owens Corning |
| Sector: Industrials | |
| SubSector: General Building Materials | |
| MarketCap: 3686.73 Millions | |
| Recent Price: 150.17 Smart Investing & Trading Score: 60 | |
| Day Percent Change: -0.09% Day Change: -0.14 | |
| Week Change: -2.19% Year-to-date Change: -11.6% | |
| OC Links: Profile News Message Board | |
| Charts:- Daily , Weekly | |
| Add OC to Watchlist: View: Get Complete OC Trend Analysis ➞ | |
 | TPH TRI Pointe Group, Inc. |
| Sector: Industrials | |
| SubSector: Residential Construction | |
| MarketCap: 1140.06 Millions | |
| Recent Price: 35.33 Smart Investing & Trading Score: 60 | |
| Day Percent Change: -0.09% Day Change: -0.03 | |
| Week Change: -2.34% Year-to-date Change: -5.5% | |
| TPH Links: Profile News Message Board | |
| Charts:- Daily , Weekly | |
| Add TPH to Watchlist: View: Get Complete TPH Trend Analysis ➞ | |
 | AWI Armstrong World Industries, Inc. |
| Sector: Industrials | |
| SubSector: General Building Materials | |
| MarketCap: 3609.53 Millions | |
| Recent Price: 195.77 Smart Investing & Trading Score: 60 | |
| Day Percent Change: -0.19% Day Change: -0.36 | |
| Week Change: -0.32% Year-to-date Change: 37.7% | |
| AWI Links: Profile News Message Board | |
| Charts:- Daily , Weekly | |
| Add AWI to Watchlist: View: Get Complete AWI Trend Analysis ➞ | |
 | MIDD The Middleby Corporation |
| Sector: Industrials | |
| SubSector: Diversified Machinery | |
| MarketCap: 3070.36 Millions | |
| Recent Price: 136.85 Smart Investing & Trading Score: 60 | |
| Day Percent Change: -0.21% Day Change: -0.27 | |
| Week Change: -3.05% Year-to-date Change: -3.9% | |
| MIDD Links: Profile News Message Board | |
| Charts:- Daily , Weekly | |
| Add MIDD to Watchlist: View: Get Complete MIDD Trend Analysis ➞ | |
 | LECO Lincoln Electric Holdings, Inc. |
| Sector: Industrials | |
| SubSector: Small Tools & Accessories | |
| MarketCap: 4085.06 Millions | |
| Recent Price: 242.63 Smart Investing & Trading Score: 60 | |
| Day Percent Change: -0.24% Day Change: -0.58 | |
| Week Change: -2.25% Year-to-date Change: 28.0% | |
| LECO Links: Profile News Message Board | |
| Charts:- Daily , Weekly | |
| Add LECO to Watchlist: View: Get Complete LECO Trend Analysis ➞ | |
 | PH Parker-Hannifin Corporation |
| Sector: Industrials | |
| SubSector: Industrial Equipment & Components | |
| MarketCap: 14888.9 Millions | |
| Recent Price: 745.61 Smart Investing & Trading Score: 60 | |
| Day Percent Change: -0.58% Day Change: -4.32 | |
| Week Change: -1.81% Year-to-date Change: 6.0% | |
| PH Links: Profile News Message Board | |
| Charts:- Daily , Weekly | |
| Add PH to Watchlist: View: Get Complete PH Trend Analysis ➞ | |
 | ERII Energy Recovery, Inc. |
| Sector: Industrials | |
| SubSector: Pollution & Treatment Controls | |
| MarketCap: 429.375 Millions | |
| Recent Price: 14.21 Smart Investing & Trading Score: 60 | |
| Day Percent Change: -1.05% Day Change: -0.15 | |
| Week Change: -2.07% Year-to-date Change: -3.5% | |
| ERII Links: Profile News Message Board | |
| Charts:- Daily , Weekly | |
| Add ERII to Watchlist: View: Get Complete ERII Trend Analysis ➞ | |
 | MLI Mueller Industries, Inc. |
| Sector: Industrials | |
| SubSector: Metal Fabrication | |
| MarketCap: 1259.5 Millions | |
| Recent Price: 95.94 Smart Investing & Trading Score: 60 | |
| Day Percent Change: -1.09% Day Change: -1 | |
| Week Change: -1.63% Year-to-date Change: 15.0% | |
| MLI Links: Profile News Message Board | |
| Charts:- Daily , Weekly | |
| Add MLI to Watchlist: View: Get Complete MLI Trend Analysis ➞ | |
 | ASTE Astec Industries, Inc. |
| Sector: Industrials | |
| SubSector: Farm & Construction Machinery | |
| MarketCap: 731.607 Millions | |
| Recent Price: 46.29 Smart Investing & Trading Score: 60 | |
| Day Percent Change: -1.22% Day Change: -0.54 | |
| Week Change: -4.77% Year-to-date Change: 30.9% | |
| ASTE Links: Profile News Message Board | |
| Charts:- Daily , Weekly | |
| Add ASTE to Watchlist: View: Get Complete ASTE Trend Analysis ➞ | |
 | MLM Martin Marietta Materials, Inc. |
| Sector: Industrials | |
| SubSector: General Building Materials | |
| MarketCap: 10624.3 Millions | |
| Recent Price: 607.94 Smart Investing & Trading Score: 60 | |
| Day Percent Change: -1.37% Day Change: -8.44 | |
| Week Change: -1.37% Year-to-date Change: 12.1% | |
| MLM Links: Profile News Message Board | |
| Charts:- Daily , Weekly | |
| Add MLM to Watchlist: View: Get Complete MLM Trend Analysis ➞ | |
 | WTS Watts Water Technologies, Inc. |
| Sector: Industrials | |
| SubSector: Industrial Equipment & Components | |
| MarketCap: 2903.29 Millions | |
| Recent Price: 276.90 Smart Investing & Trading Score: 60 | |
| Day Percent Change: -1.83% Day Change: -5.06 | |
| Week Change: -1.17% Year-to-date Change: 34.0% | |
| WTS Links: Profile News Message Board | |
| Charts:- Daily , Weekly | |
| Add WTS to Watchlist: View: Get Complete WTS Trend Analysis ➞ | |
 | EVLV Evolv Technologies Holdings, Inc. |
| Sector: Industrials | |
| SubSector: Security & Protection Services | |
| MarketCap: 853 Millions | |
| Recent Price: 8.24 Smart Investing & Trading Score: 60 | |
| Day Percent Change: -1.88% Day Change: -0.15 | |
| Week Change: 6.24% Year-to-date Change: 98.2% | |
| EVLV Links: Profile News Message Board | |
| Charts:- Daily , Weekly | |
| Add EVLV to Watchlist: View: Get Complete EVLV Trend Analysis ➞ | |
 | PACK Ranpak Holdings Corp. |
| Sector: Industrials | |
| SubSector: Conglomerates | |
| MarketCap: 492.648 Millions | |
| Recent Price: 5.28 Smart Investing & Trading Score: 60 | |
| Day Percent Change: -2.05% Day Change: -0.09 | |
| Week Change: 0.94% Year-to-date Change: -37.4% | |
| PACK Links: Profile News Message Board | |
| Charts:- Daily , Weekly | |
| Add PACK to Watchlist: View: Get Complete PACK Trend Analysis ➞ | |
 | OSIS OSI Systems, Inc. |
| Sector: Industrials | |
| SubSector: Industrial Electrical Equipment | |
| MarketCap: 1100.39 Millions | |
| Recent Price: 230.05 Smart Investing & Trading Score: 60 | |
| Day Percent Change: -2.46% Day Change: -5.5 | |
| Week Change: -6.68% Year-to-date Change: 30.1% | |
| OSIS Links: Profile News Message Board | |
| Charts:- Daily , Weekly | |
| Add OSIS to Watchlist: View: Get Complete OSIS Trend Analysis ➞ | |
 | SFWL Shengfeng Development Limited |
| Sector: Industrials | |
| SubSector: Integrated Freight & Logistics | |
| MarketCap: 747 Millions | |
| Recent Price: 1.13 Smart Investing & Trading Score: 59 | |
| Day Percent Change: 2.94% Day Change: 0.03 | |
| Week Change: 0.94% Year-to-date Change: -3.7% | |
| SFWL Links: Profile News Message Board | |
| Charts:- Daily , Weekly | |
| Add SFWL to Watchlist: View: Get Complete SFWL Trend Analysis ➞ | |
 | ATMU Atmus Filtration Technologies Inc. |
| Sector: Industrials | |
| SubSector: Pollution & Treatment Controls | |
| MarketCap: 1830 Millions | |
| Recent Price: 44.52 Smart Investing & Trading Score: 56 | |
| Day Percent Change: -0.12% Day Change: -0.05 | |
| Week Change: -6.46% Year-to-date Change: 8.2% | |
| ATMU Links: Profile News Message Board | |
| Charts:- Daily , Weekly | |
| Add ATMU to Watchlist: View: Get Complete ATMU Trend Analysis ➞ | |
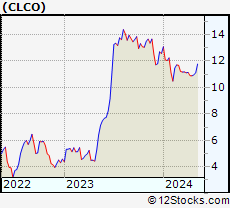 | CLCO Cool Company Ltd. |
| Sector: Industrials | |
| SubSector: Marine Shipping | |
| MarketCap: 736 Millions | |
| Recent Price: 8.09 Smart Investing & Trading Score: 53 | |
| Day Percent Change: 2.46% Day Change: 0.19 | |
| Week Change: 6.45% Year-to-date Change: -0.4% | |
| CLCO Links: Profile News Message Board | |
| Charts:- Daily , Weekly | |
| Add CLCO to Watchlist: View: Get Complete CLCO Trend Analysis ➞ | |
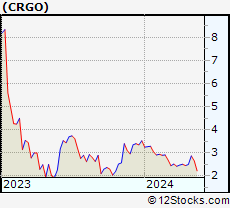 | CRGO Freightos Limited |
| Sector: Industrials | |
| SubSector: Integrated Freight & Logistics | |
| MarketCap: 149 Millions | |
| Recent Price: 3.28 Smart Investing & Trading Score: 53 | |
| Day Percent Change: -1.53% Day Change: -0.05 | |
| Week Change: -2.13% Year-to-date Change: 5.6% | |
| CRGO Links: Profile News Message Board | |
| Charts:- Daily , Weekly | |
| Add CRGO to Watchlist: View: Get Complete CRGO Trend Analysis ➞ | |
| For tabular summary view of above stock list: Summary View ➞ 0 - 25 , 25 - 50 , 50 - 75 , 75 - 100 , 100 - 125 , 125 - 150 , 150 - 175 , 175 - 200 , 200 - 225 , 225 - 250 , 250 - 275 , 275 - 300 | ||
| Click To Change The Sort Order: By Market Cap or Company Size Performance: Year-to-date, Week and Day | |
| Select Chart Type: | ||
|
Best Stocks Today 12Stocks.com |
© 2025 12Stocks.com Terms & Conditions Privacy Contact Us
All Information Provided Only For Education And Not To Be Used For Investing or Trading. See Terms & Conditions


One More Thing ... Get Best Stocks Delivered Daily!
Never Ever Miss A Move With Our Top Ten Stocks Lists
Find Best Stocks In Any Market - Bull or Bear Market
Take A Peek At Our Top Ten Stocks Lists: Daily, Weekly, Year-to-Date & Top Trends
Find Best Stocks In Any Market - Bull or Bear Market
Take A Peek At Our Top Ten Stocks Lists: Daily, Weekly, Year-to-Date & Top Trends
Industrial Stocks With Best Up Trends [0-bearish to 100-bullish]: Kanzhun [100], Xometry [100], Cementos Pacasmayo[100], Barnes [100], Hexcel [100], National Energy[100], Montrose Environmental[100], Seaboard [100], CEMEX S.A.B.[100], REX American[100], Eos Energy[100]
Best Industrial Stocks Year-to-Date:
LanzaTech Global[1484.67%], China Yuchai[231.9%], Amprius Technologies[142.5%], Tutor Perini[135.62%], Solid Power[128.57%], Astronics [123.06%], Evolv Technologies[98.23%], American Superconductor[97.28%], NuScale Power[86.78%], Symbotic [85.15%], Elbit Systems[78.5%] Best Industrial Stocks This Week:
LanzaTech Global[5701.71%], Twin Disc[25.39%], National Energy[23.8%], System1 [11.61%], Target Hospitality[10.9%], Kanzhun [10.41%], China Yuchai[8.53%], Astronics [8.27%], Barnes [8.09%], BiomX [7.55%], Cool [6.45%] Best Industrial Stocks Daily:
Twin Disc[30.05%], Bioceres Crop[8.89%], Novonix [7.08%], Kanzhun [6.61%], James Hardie[6.12%], Satellogic [5.65%], Solid Power[4.85%], System1 [4.83%], Xometry [4.58%], BiomX [4.06%], Astronics [3.46%]