
 Login Sign Up


| |||||
 |  | ||||

| 12Stocks.com Market Intelligence |
Best Industrial Stocks
| In a hurry? Industrial Stocks Lists: Performance Trends Table, Stock Charts
Sort Industrial stocks: Daily, Weekly, Year-to-Date, Market Cap & Trends. Filter Industrial stocks list by size:All Industrial Large Mid-Range Small |
| 12Stocks.com Industrial Stocks Performances & Trends Daily | |||||||||
|
|  The overall Smart Investing & Trading Score is 20 (0-bearish to 100-bullish) which puts Industrial sector in short term bearish trend. The Smart Investing & Trading Score from previous trading session is 60 and hence a deterioration of trend.
| ||||||||
Here are the Smart Investing & Trading Scores of the most requested Industrial stocks at 12Stocks.com (click stock name for detailed review):
|


| 12Stocks.com: Investing in Industrial sector with Stocks | |
|
The following table helps investors and traders sort through current performance and trends (as measured by Smart Investing & Trading Score) of various
stocks in the Industrial sector. Quick View: Move mouse or cursor over stock symbol (ticker) to view short-term Technical chart and over stock name to view long term chart. Click on  to add stock symbol to your watchlist and to add stock symbol to your watchlist and  to view watchlist. Click on any ticker or stock name for detailed market intelligence report for that stock. to view watchlist. Click on any ticker or stock name for detailed market intelligence report for that stock. |
12Stocks.com Performance of Stocks in Industrial Sector
| Ticker | Stock Name | Watchlist | Category | Recent Price | Smart Investing & Trading Score | Change % | Weekly Change% |
| DOOR | Masonite |   | Building Materials | 58.13 | 20 | 1.40% | -56.24% |
| USCR | U.S. Concrete | | Building Materials | 31.97 | 0 | 0.06% | -56.79% |
| TPIC | TPI Composites | | Machinery | 0.13 | 10 | -45.91% | -60.31% |
| POPE | Pope Resources | | Lumber, Wood | 18.73 | 0 | 0.48% | -60.79% |
| AJRD | Aerojet Rocketdyne | | Aerospace/Defense | 18.47 | 20 | 2.27% | -68.15% |
| MDC | M.D.C | | Residential | 19.87 | 0 | 0.91% | -68.44% |
| ARNC | Arconic | | Fabrication | 9.10 | 30 | 1.11% | -69.66% |
| LEV | Lion Electric | | Farm & Heavy Construction Machinery | 0.07 | 0 | -71.96% | -80.53% |
| UTX | United Technologies | | Aerospace/Defense | 9.25 | 10 | 0.00% | -82.82% |
| ROLL | RBC Bearings | | Machine Tools | 20.95 | 0 | 1.16% | -91.63% |
| INS | Intelligent Systems | | Machinery | 1.51 | 20 | 0.67% | -96.22% |
| HW | Headwaters | | Building Materials | 3.20 | 0 | -2.74% | -97.66% |
| For chart view version of above stock list: Chart View ➞ 0 - 25 , 25 - 50 , 50 - 75 , 75 - 100 , 100 - 125 , 125 - 150 , 150 - 175 , 175 - 200 , 200 - 225 , 225 - 250 , 250 - 275 , 275 - 300 , 300 - 325 , 325 - 350 , 350 - 375 , 375 - 400 , 400 - 425 , 425 - 450 , 450 - 475 , 475 - 500 , 500 - 525 | ||
 | Click To Change The Sort Order: By Market Cap or Company Size Performance: Year-to-date, Week and Day |  |
|
Get the most comprehensive stock market coverage daily at 12Stocks.com ➞ Best Stocks Today ➞ Best Stocks Weekly ➞ Best Stocks Year-to-Date ➞ Best Stocks Trends ➞  Best Stocks Today 12Stocks.com Best Nasdaq Stocks ➞ Best S&P 500 Stocks ➞ Best Tech Stocks ➞ Best Biotech Stocks ➞ |
| Detailed Overview of Industrial Stocks |
| Industrial Technical Overview, Leaders & Laggards, Top Industrial ETF Funds & Detailed Industrial Stocks List, Charts, Trends & More |
| Industrial Sector: Technical Analysis, Trends & YTD Performance | |
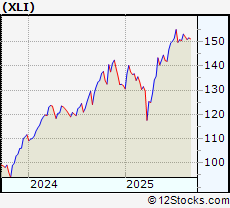
| Industrial sector is composed of stocks
from industrial machinery, aerospace, defense, farm/construction
and industrial services subsectors. Industrial sector, as represented by XLI, an exchange-traded fund [ETF] that holds basket of Industrial stocks (e.g, Caterpillar, Boeing) is up by 15.8152% and is currently outperforming the overall market by 2.6684% year-to-date. Below is a quick view of Technical charts and trends: |
|
 XLI Weekly Chart |
|
| Long Term Trend: Good | |
| Medium Term Trend: Not Good | |
 XLI Daily Chart |
|
| Short Term Trend: Not Good | |
| Overall Trend Score: 20 | |
| YTD Performance: 15.8152% | |
| **Trend Scores & Views Are Only For Educational Purposes And Not For Investing | |
| 12Stocks.com: Top Performing Industrial Sector Stocks | ||||||||||||||||||||||||||||||||||||||||||||||||
 The top performing Industrial sector stocks year to date are
Now, more recently, over last week, the top performing Industrial sector stocks on the move are


|
||||||||||||||||||||||||||||||||||||||||||||||||
| 12Stocks.com: Investing in Industrial Sector using Exchange Traded Funds | |
|
The following table shows list of key exchange traded funds (ETF) that
help investors track Industrial Index. For detailed view, check out our ETF Funds section of our website. Quick View: Move mouse or cursor over ETF symbol (ticker) to view short-term Technical chart and over ETF name to view long term chart. Click on ticker or stock name for detailed view. Click on to add stock symbol to your watchlist and to view watchlist. |
12Stocks.com List of ETFs that track Industrial Index
| Ticker | ETF Name | Watchlist | Recent Price | Smart Investing & Trading Score | Change % | Week % | Year-to-date % |
| CHII | China Industrials | | 9.80 | 20 | 0 | -0.0509944 | 0% |
| 12Stocks.com: Charts, Trends, Fundamental Data and Performances of Industrial Stocks | |
|
We now take in-depth look at all Industrial stocks including charts, multi-period performances and overall trends (as measured by Smart Investing & Trading Score). One can sort Industrial stocks (click link to choose) by Daily, Weekly and by Year-to-Date performances. Also, one can sort by size of the company or by market capitalization. |
| Select Your Default Chart Type: | |||||
| |||||
| Click on stock symbol or name for detailed view. Click on to add stock symbol to your watchlist and to view watchlist. Quick View: Move mouse or cursor over "Daily" to quickly view daily Technical stock chart and over "Weekly" to view weekly Technical stock chart. | |||||

 | DOOR Masonite International Corporation |
| Sector: Industrials | |
| SubSector: General Building Materials | |
| MarketCap: 1220.53 Millions | |
| Recent Price: 58.13 Smart Investing & Trading Score: 20 | |
| Day Percent Change: 1.39543% Day Change: -9999 | |
| Week Change: -56.2406% Year-to-date Change: 0.0% | |
| DOOR Links: Profile News Message Board | |
| Charts:- Daily , Weekly | |
| Add DOOR to Watchlist: View: Get Complete DOOR Trend Analysis ➞ | |
 | USCR U.S. Concrete, Inc. |
| Sector: Industrials | |
| SubSector: General Building Materials | |
| MarketCap: 260.553 Millions | |
| Recent Price: 31.97 Smart Investing & Trading Score: 0 | |
| Day Percent Change: 0.0625978% Day Change: -9999 | |
| Week Change: -56.7915% Year-to-date Change: 0.0% | |
| USCR Links: Profile News Message Board | |
| Charts:- Daily , Weekly | |
| Add USCR to Watchlist: View: Get Complete USCR Trend Analysis ➞ | |
 | TPIC TPI Composites, Inc. |
| Sector: Industrials | |
| SubSector: Diversified Machinery | |
| MarketCap: 451.016 Millions | |
| Recent Price: 0.13 Smart Investing & Trading Score: 10 | |
| Day Percent Change: -45.9149% Day Change: -9999 | |
| Week Change: -60.3061% Year-to-date Change: -92.9% | |
| TPIC Links: Profile News Message Board | |
| Charts:- Daily , Weekly | |
| Add TPIC to Watchlist: View: Get Complete TPIC Trend Analysis ➞ | |
 | POPE Pope Resources, A Delaware Limited Partnership |
| Sector: Industrials | |
| SubSector: Lumber, Wood Production | |
| MarketCap: 382.938 Millions | |
| Recent Price: 18.73 Smart Investing & Trading Score: 0 | |
| Day Percent Change: 0.482833% Day Change: -9999 | |
| Week Change: -60.7913% Year-to-date Change: 0.0% | |
| POPE Links: Profile News Message Board | |
| Charts:- Daily , Weekly | |
| Add POPE to Watchlist: View: Get Complete POPE Trend Analysis ➞ | |
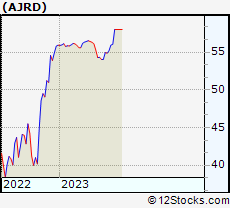 | AJRD Aerojet Rocketdyne Holdings, Inc. |
| Sector: Industrials | |
| SubSector: Aerospace/Defense - Major Diversified | |
| MarketCap: 3451.49 Millions | |
| Recent Price: 18.47 Smart Investing & Trading Score: 20 | |
| Day Percent Change: 2.27021% Day Change: -9999 | |
| Week Change: -68.1497% Year-to-date Change: 0.0% | |
| AJRD Links: Profile News Message Board | |
| Charts:- Daily , Weekly | |
| Add AJRD to Watchlist: View: Get Complete AJRD Trend Analysis ➞ | |
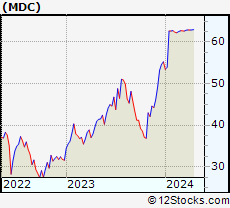 | MDC M.D.C. Holdings, Inc. |
| Sector: Industrials | |
| SubSector: Residential Construction | |
| MarketCap: 1606.26 Millions | |
| Recent Price: 19.87 Smart Investing & Trading Score: 0 | |
| Day Percent Change: 0.91417% Day Change: -9999 | |
| Week Change: -68.4353% Year-to-date Change: 0.0% | |
| MDC Links: Profile News Message Board | |
| Charts:- Daily , Weekly | |
| Add MDC to Watchlist: View: Get Complete MDC Trend Analysis ➞ | |
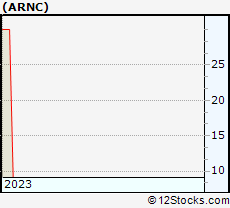 | ARNC Arconic Corporation |
| Sector: Industrials | |
| SubSector: Metal Fabrication | |
| MarketCap: 33627 Millions | |
| Recent Price: 9.10 Smart Investing & Trading Score: 30 | |
| Day Percent Change: 1.11111% Day Change: -9999 | |
| Week Change: -69.6566% Year-to-date Change: 0.0% | |
| ARNC Links: Profile News Message Board | |
| Charts:- Daily , Weekly | |
| Add ARNC to Watchlist: View: Get Complete ARNC Trend Analysis ➞ | |
 | LEV The Lion Electric Company |
| Sector: Industrials | |
| SubSector: Farm & Heavy Construction Machinery | |
| MarketCap: 414 Millions | |
| Recent Price: 0.07 Smart Investing & Trading Score: 0 | |
| Day Percent Change: -71.96% Day Change: -9999 | |
| Week Change: -80.5278% Year-to-date Change: 0.0% | |
| LEV Links: Profile News Message Board | |
| Charts:- Daily , Weekly | |
| Add LEV to Watchlist: View: Get Complete LEV Trend Analysis ➞ | |
 | UTX United Technologies Corporation |
| Sector: Industrials | |
| SubSector: Aerospace/Defense Products & Services | |
| MarketCap: 74904.2 Millions | |
| Recent Price: 9.25 Smart Investing & Trading Score: 10 | |
| Day Percent Change: 0% Day Change: -9999 | |
| Week Change: -82.8163% Year-to-date Change: 0.0% | |
| UTX Links: Profile News Message Board | |
| Charts:- Daily , Weekly | |
| Add UTX to Watchlist: View: Get Complete UTX Trend Analysis ➞ | |
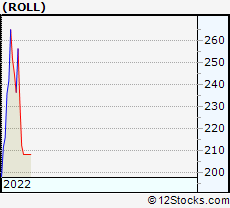 | ROLL RBC Bearings Incorporated |
| Sector: Industrials | |
| SubSector: Machine Tools & Accessories | |
| MarketCap: 2678.58 Millions | |
| Recent Price: 20.95 Smart Investing & Trading Score: 0 | |
| Day Percent Change: 1.15886% Day Change: -9999 | |
| Week Change: -91.6284% Year-to-date Change: 0.0% | |
| ROLL Links: Profile News Message Board | |
| Charts:- Daily , Weekly | |
| Add ROLL to Watchlist: View: Get Complete ROLL Trend Analysis ➞ | |
 | INS Intelligent Systems Corporation |
| Sector: Industrials | |
| SubSector: Diversified Machinery | |
| MarketCap: 291.716 Millions | |
| Recent Price: 1.51 Smart Investing & Trading Score: 20 | |
| Day Percent Change: 0.666667% Day Change: -9999 | |
| Week Change: -96.2222% Year-to-date Change: 0.0% | |
| INS Links: Profile News Message Board | |
| Charts:- Daily , Weekly | |
| Add INS to Watchlist: View: Get Complete INS Trend Analysis ➞ | |
 | HW Headwaters Incorporated |
| Sector: Industrials | |
| SubSector: General Building Materials | |
| MarketCap: 1758.27 Millions | |
| Recent Price: 3.20 Smart Investing & Trading Score: 0 | |
| Day Percent Change: -2.73556% Day Change: -9999 | |
| Week Change: -97.6634% Year-to-date Change: 0.0% | |
| HW Links: Profile News Message Board | |
| Charts:- Daily , Weekly | |
| Add HW to Watchlist: View: Get Complete HW Trend Analysis ➞ | |
| For tabular summary view of above stock list: Summary View ➞ 0 - 25 , 25 - 50 , 50 - 75 , 75 - 100 , 100 - 125 , 125 - 150 , 150 - 175 , 175 - 200 , 200 - 225 , 225 - 250 , 250 - 275 , 275 - 300 , 300 - 325 , 325 - 350 , 350 - 375 , 375 - 400 , 400 - 425 , 425 - 450 , 450 - 475 , 475 - 500 , 500 - 525 | ||
| Click To Change The Sort Order: By Market Cap or Company Size Performance: Year-to-date, Week and Day | |
| Select Chart Type: | ||
|
Best Stocks Today 12Stocks.com |
© 2025 12Stocks.com Terms & Conditions Privacy Contact Us
All Information Provided Only For Education And Not To Be Used For Investing or Trading. See Terms & Conditions


One More Thing ... Get Best Stocks Delivered Daily!
Never Ever Miss A Move With Our Top Ten Stocks Lists
Find Best Stocks In Any Market - Bull or Bear Market
Take A Peek At Our Top Ten Stocks Lists: Daily, Weekly, Year-to-Date & Top Trends
Find Best Stocks In Any Market - Bull or Bear Market
Take A Peek At Our Top Ten Stocks Lists: Daily, Weekly, Year-to-Date & Top Trends
Industrial Stocks With Best Up Trends [0-bearish to 100-bullish]: Brooge [100], Plug Power[100], Ballard Power[100], GrafTech [100], Bloom Energy[100], American Superconductor[100], PICO [100], Seanergy Maritime[100], Acco Brands[100], Controladora Vuela[100], Tetra Technologies[100]
Best Industrial Stocks Year-to-Date:
Triumph [1281.83%], GrafTech [600.581%], Tecogen [486.452%], Power [247.28%], Bloom Energy[240.907%], Lightbridge Corp[189.608%], Kratos Defense[187.111%], Willdan [170.86%], ESGL [170.593%], Tutor Perini[163.328%], Planet Labs[157.683%] Best Industrial Stocks This Week:
TRC [10149.1%], Advanced Emissions[3571.78%], L3 Technologies[1915.25%], Forterra [1845.47%], KLX [437.488%], Allegro Merger[402.182%], LMI Aerospace[291.621%], Chicago Bridge[205.472%], Covanta Holding[148.617%], MOOG [148.377%], Altra [103.372%] Best Industrial Stocks Daily:
Brooge [29.5547%], Plug Power[19.0476%], Ballard Power[14.5455%], GrafTech [11.9888%], Tecogen [10.989%], B/E Aerospace[8.86381%], Bloom Energy[8.70514%], American Superconductor[7.043%], Ads-Tec Energy[5.48272%], Planet Labs[4.92308%], William Lyon[4.78516%]