
 Login Sign Up


| |||||
 |  | ||||

| 12Stocks.com Market Intelligence |
Best Industrial Stocks
| In a hurry? Industrial Stocks Lists: Performance Trends Table, Stock Charts
Sort Industrial stocks: Daily, Weekly, Year-to-Date, Market Cap & Trends. Filter Industrial stocks list by size:All Industrial Large Mid-Range Small |
| 12Stocks.com Industrial Stocks Performances & Trends Daily | |||||||||
|
|  The overall Smart Investing & Trading Score is 70 (0-bearish to 100-bullish) which puts Industrial sector in short term neutral to bullish trend. The Smart Investing & Trading Score from previous trading session is 60 and an improvement of trend continues.
| ||||||||
Here are the Smart Investing & Trading Scores of the most requested Industrial stocks at 12Stocks.com (click stock name for detailed review):
|


| 12Stocks.com: Investing in Industrial sector with Stocks | |
|
The following table helps investors and traders sort through current performance and trends (as measured by Smart Investing & Trading Score) of various
stocks in the Industrial sector. Quick View: Move mouse or cursor over stock symbol (ticker) to view short-term Technical chart and over stock name to view long term chart. Click on  to add stock symbol to your watchlist and to add stock symbol to your watchlist and  to view watchlist. Click on any ticker or stock name for detailed market intelligence report for that stock. to view watchlist. Click on any ticker or stock name for detailed market intelligence report for that stock. |
12Stocks.com Performance of Stocks in Industrial Sector
| Ticker | Stock Name | Watchlist | Category | Recent Price | Smart Investing & Trading Score | Change % | YTD Change% |
| LMB | Limbach |   | Building Products & Equipment | 103.41 | 40 | -2.38 | 16.56% |
| DAL | Delta Air | | Airlines | 58.42 | 30 | -2.42 | -0.22% |
| GIFI | Gulf Island | | Fabrication | 7.44 | 60 | -2.49 | 4.79% |
| REVG | REV | | Farm & Heavy Construction Machinery | 60.27 | 40 | -2.49 | 89.88% |
| CBZ | Cbiz | | Specialty | 54.28 | 0 | -2.53 | -33.12% |
| RCMT | RCM Technologies | | Conglomerates | 26.56 | 30 | -2.57 | 18.20% |
| SATL | Satellogic | | Aerospace & Defense | 3.73 | 60 | -2.61 | 22.30% |
| CSL | Carlisle | | Building Products & Equipment | 355.97 | 0 | -2.65 | -2.32% |
| VRSK | Verisk Analytics | | Consulting | 255.08 | 0 | -2.72 | -6.42% |
| HW | Headwaters | | Building Materials | 3.20 | 0 | -2.74 | 0.00% |
| JBLU | Jetblue Airways | | Airlines | 4.91 | 30 | -2.77 | -34.36% |
| BAH | Booz Allen | | Consulting | 101.62 | 10 | -2.87 | -19.87% |
| HQI | HireQuest | | Staffing & Employment | 10.00 | 80 | -2.91 | -27.75% |
| OMAB | Grupo Aeroportuario | | Airports & Air | 108.79 | 60 | -2.92 | 58.33% |
| SKYW | Skywest | | Airlines | 104.51 | 10 | -2.93 | 3.39% |
| AAL | American Airlines | | Airlines | 12.53 | 30 | -2.94 | -26.29% |
| BLBD | Blue Bird | | Farm & Heavy Construction Machinery | 56.24 | 30 | -2.97 | 45.51% |
| HEBT | Hebron Technology | | Machinery | 10.75 | 20 | -2.98 | 0.00% |
| ATU | Actuant | | Machinery | 4.44 | 10 | -3.27 | 0.00% |
| HTZ | Hertz Global | | Rental & Leasing | 6.19 | 60 | -3.28 | 65.95% |
| EVEX | Eve Holding | | Aerospace & Defense | 3.82 | 46 | -3.41 | -27.21% |
| ESGL | ESGL | | Waste Mgmt | 3.56 | 80 | -3.57 | 170.59% |
| BAER | Bridger Aerospace | | Security & Protection | 1.82 | 10 | -3.70 | -9.90% |
| EVLV | Evolv Technologies | | Security & Protection | 8.43 | 90 | -3.77 | 112.34% |
| SNCY | Sun Country | | Airlines | 13.10 | 30 | -4.03 | -9.84% |
| For chart view version of above stock list: Chart View ➞ 0 - 25 , 25 - 50 , 50 - 75 , 75 - 100 , 100 - 125 , 125 - 150 , 150 - 175 , 175 - 200 , 200 - 225 , 225 - 250 , 250 - 275 , 275 - 300 , 300 - 325 , 325 - 350 , 350 - 375 , 375 - 400 , 400 - 425 , 425 - 450 , 450 - 475 , 475 - 500 , 500 - 525 | ||
 | Click To Change The Sort Order: By Market Cap or Company Size Performance: Year-to-date, Week and Day |  |
|
Get the most comprehensive stock market coverage daily at 12Stocks.com ➞ Best Stocks Today ➞ Best Stocks Weekly ➞ Best Stocks Year-to-Date ➞ Best Stocks Trends ➞  Best Stocks Today 12Stocks.com Best Nasdaq Stocks ➞ Best S&P 500 Stocks ➞ Best Tech Stocks ➞ Best Biotech Stocks ➞ |
| Detailed Overview of Industrial Stocks |
| Industrial Technical Overview, Leaders & Laggards, Top Industrial ETF Funds & Detailed Industrial Stocks List, Charts, Trends & More |
| Industrial Sector: Technical Analysis, Trends & YTD Performance | |
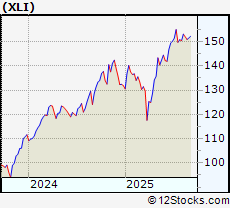
| Industrial sector is composed of stocks
from industrial machinery, aerospace, defense, farm/construction
and industrial services subsectors. Industrial sector, as represented by XLI, an exchange-traded fund [ETF] that holds basket of Industrial stocks (e.g, Caterpillar, Boeing) is up by 16.6888% and is currently outperforming the overall market by 3.288% year-to-date. Below is a quick view of Technical charts and trends: |
|
 XLI Weekly Chart |
|
| Long Term Trend: Good | |
| Medium Term Trend: Good | |
 XLI Daily Chart |
|
| Short Term Trend: Very Good | |
| Overall Trend Score: 70 | |
| YTD Performance: 16.6888% | |
| **Trend Scores & Views Are Only For Educational Purposes And Not For Investing | |
| 12Stocks.com: Top Performing Industrial Sector Stocks | ||||||||||||||||||||||||||||||||||||||||||||||||
 The top performing Industrial sector stocks year to date are
Now, more recently, over last week, the top performing Industrial sector stocks on the move are


|
||||||||||||||||||||||||||||||||||||||||||||||||
| 12Stocks.com: Investing in Industrial Sector using Exchange Traded Funds | |
|
The following table shows list of key exchange traded funds (ETF) that
help investors track Industrial Index. For detailed view, check out our ETF Funds section of our website. Quick View: Move mouse or cursor over ETF symbol (ticker) to view short-term Technical chart and over ETF name to view long term chart. Click on ticker or stock name for detailed view. Click on to add stock symbol to your watchlist and to view watchlist. |
12Stocks.com List of ETFs that track Industrial Index
| Ticker | ETF Name | Watchlist | Recent Price | Smart Investing & Trading Score | Change % | Week % | Year-to-date % |
| CHII | China Industrials | | 9.80 | 20 | 0 | -0.0509944 | 0% |
| 12Stocks.com: Charts, Trends, Fundamental Data and Performances of Industrial Stocks | |
|
We now take in-depth look at all Industrial stocks including charts, multi-period performances and overall trends (as measured by Smart Investing & Trading Score). One can sort Industrial stocks (click link to choose) by Daily, Weekly and by Year-to-Date performances. Also, one can sort by size of the company or by market capitalization. |
| Select Your Default Chart Type: | |||||
| |||||
| Click on stock symbol or name for detailed view. Click on to add stock symbol to your watchlist and to view watchlist. Quick View: Move mouse or cursor over "Daily" to quickly view daily Technical stock chart and over "Weekly" to view weekly Technical stock chart. | |||||

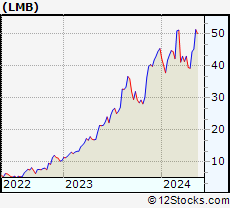 | LMB Limbach Holdings Inc |
| Sector: Industrials | |
| SubSector: Building Products & Equipment | |
| MarketCap: 1253.95 Millions | |
| Recent Price: 103.41 Smart Investing & Trading Score: 40 | |
| Day Percent Change: -2.37893% Day Change: 1.8 | |
| Week Change: -4.11683% Year-to-date Change: 16.6% | |
| LMB Links: Profile News Message Board | |
| Charts:- Daily , Weekly | |
| Add LMB to Watchlist: View: Get Complete LMB Trend Analysis ➞ | |
 | DAL Delta Air Lines, Inc |
| Sector: Industrials | |
| SubSector: Airlines | |
| MarketCap: 39947.4 Millions | |
| Recent Price: 58.42 Smart Investing & Trading Score: 30 | |
| Day Percent Change: -2.42191% Day Change: -1.38 | |
| Week Change: -4.51128% Year-to-date Change: -0.2% | |
| DAL Links: Profile News Message Board | |
| Charts:- Daily , Weekly | |
| Add DAL to Watchlist: View: Get Complete DAL Trend Analysis ➞ | |
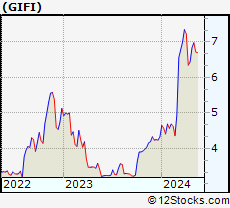 | GIFI Gulf Island Fabrication, Inc |
| Sector: Industrials | |
| SubSector: Metal Fabrication | |
| MarketCap: 117.53 Millions | |
| Recent Price: 7.44 Smart Investing & Trading Score: 60 | |
| Day Percent Change: -2.49017% Day Change: -0.01 | |
| Week Change: 1.50068% Year-to-date Change: 4.8% | |
| GIFI Links: Profile News Message Board | |
| Charts:- Daily , Weekly | |
| Add GIFI to Watchlist: View: Get Complete GIFI Trend Analysis ➞ | |
 | REVG REV Group Inc |
| Sector: Industrials | |
| SubSector: Farm & Heavy Construction Machinery | |
| MarketCap: 3050.87 Millions | |
| Recent Price: 60.27 Smart Investing & Trading Score: 40 | |
| Day Percent Change: -2.49151% Day Change: -0.41 | |
| Week Change: -3.59885% Year-to-date Change: 89.9% | |
| REVG Links: Profile News Message Board | |
| Charts:- Daily , Weekly | |
| Add REVG to Watchlist: View: Get Complete REVG Trend Analysis ➞ | |
 | CBZ Cbiz Inc |
| Sector: Industrials | |
| SubSector: Specialty Business Services | |
| MarketCap: 3230.96 Millions | |
| Recent Price: 54.28 Smart Investing & Trading Score: 0 | |
| Day Percent Change: -2.53187% Day Change: 0.7 | |
| Week Change: -9.32175% Year-to-date Change: -33.1% | |
| CBZ Links: Profile News Message Board | |
| Charts:- Daily , Weekly | |
| Add CBZ to Watchlist: View: Get Complete CBZ Trend Analysis ➞ | |
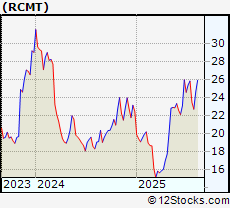 | RCMT RCM Technologies, Inc |
| Sector: Industrials | |
| SubSector: Conglomerates | |
| MarketCap: 203.12 Millions | |
| Recent Price: 26.56 Smart Investing & Trading Score: 30 | |
| Day Percent Change: -2.56786% Day Change: -0.03 | |
| Week Change: -3.10106% Year-to-date Change: 18.2% | |
| RCMT Links: Profile News Message Board | |
| Charts:- Daily , Weekly | |
| Add RCMT to Watchlist: View: Get Complete RCMT Trend Analysis ➞ | |
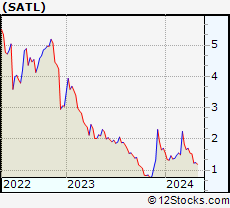 | SATL Satellogic Inc |
| Sector: Industrials | |
| SubSector: Aerospace & Defense | |
| MarketCap: 369.49 Millions | |
| Recent Price: 3.73 Smart Investing & Trading Score: 60 | |
| Day Percent Change: -2.61097% Day Change: 0.19 | |
| Week Change: 5.96591% Year-to-date Change: 22.3% | |
| SATL Links: Profile News Message Board | |
| Charts:- Daily , Weekly | |
| Add SATL to Watchlist: View: Get Complete SATL Trend Analysis ➞ | |
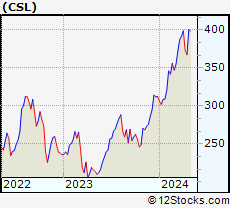 | CSL Carlisle Companies Inc |
| Sector: Industrials | |
| SubSector: Building Products & Equipment | |
| MarketCap: 16937.8 Millions | |
| Recent Price: 355.97 Smart Investing & Trading Score: 0 | |
| Day Percent Change: -2.65% Day Change: -9.04 | |
| Week Change: -10.154% Year-to-date Change: -2.3% | |
| CSL Links: Profile News Message Board | |
| Charts:- Daily , Weekly | |
| Add CSL to Watchlist: View: Get Complete CSL Trend Analysis ➞ | |
 | VRSK Verisk Analytics Inc |
| Sector: Industrials | |
| SubSector: Consulting Services | |
| MarketCap: 37766.4 Millions | |
| Recent Price: 255.08 Smart Investing & Trading Score: 0 | |
| Day Percent Change: -2.71548% Day Change: -5.55 | |
| Week Change: -5.63427% Year-to-date Change: -6.4% | |
| VRSK Links: Profile News Message Board | |
| Charts:- Daily , Weekly | |
| Add VRSK to Watchlist: View: Get Complete VRSK Trend Analysis ➞ | |
 | HW Headwaters Incorporated |
| Sector: Industrials | |
| SubSector: General Building Materials | |
| MarketCap: 1758.27 Millions | |
| Recent Price: 3.20 Smart Investing & Trading Score: 0 | |
| Day Percent Change: -2.73556% Day Change: -9999 | |
| Week Change: -97.6634% Year-to-date Change: 0.0% | |
| HW Links: Profile News Message Board | |
| Charts:- Daily , Weekly | |
| Add HW to Watchlist: View: Get Complete HW Trend Analysis ➞ | |
 | JBLU Jetblue Airways Corp |
| Sector: Industrials | |
| SubSector: Airlines | |
| MarketCap: 1847.42 Millions | |
| Recent Price: 4.91 Smart Investing & Trading Score: 30 | |
| Day Percent Change: -2.77228% Day Change: -0.06 | |
| Week Change: -3.34646% Year-to-date Change: -34.4% | |
| JBLU Links: Profile News Message Board | |
| Charts:- Daily , Weekly | |
| Add JBLU to Watchlist: View: Get Complete JBLU Trend Analysis ➞ | |
 | BAH Booz Allen Hamilton Holding Corp |
| Sector: Industrials | |
| SubSector: Consulting Services | |
| MarketCap: 12626.8 Millions | |
| Recent Price: 101.62 Smart Investing & Trading Score: 10 | |
| Day Percent Change: -2.86752% Day Change: -2.78 | |
| Week Change: -0.810151% Year-to-date Change: -19.9% | |
| BAH Links: Profile News Message Board | |
| Charts:- Daily , Weekly | |
| Add BAH to Watchlist: View: Get Complete BAH Trend Analysis ➞ | |
 | HQI HireQuest Inc |
| Sector: Industrials | |
| SubSector: Staffing & Employment Services | |
| MarketCap: 141.99 Millions | |
| Recent Price: 10.00 Smart Investing & Trading Score: 80 | |
| Day Percent Change: -2.91262% Day Change: -0.09 | |
| Week Change: 0.908174% Year-to-date Change: -27.8% | |
| HQI Links: Profile News Message Board | |
| Charts:- Daily , Weekly | |
| Add HQI to Watchlist: View: Get Complete HQI Trend Analysis ➞ | |
 | OMAB Grupo Aeroportuario del Centro Norte S.A.B de C.V. ADR |
| Sector: Industrials | |
| SubSector: Airports & Air Services | |
| MarketCap: 4432.91 Millions | |
| Recent Price: 108.79 Smart Investing & Trading Score: 60 | |
| Day Percent Change: -2.91808% Day Change: -0.27 | |
| Week Change: 3.19674% Year-to-date Change: 58.3% | |
| OMAB Links: Profile News Message Board | |
| Charts:- Daily , Weekly | |
| Add OMAB to Watchlist: View: Get Complete OMAB Trend Analysis ➞ | |
 | SKYW Skywest Inc |
| Sector: Industrials | |
| SubSector: Airlines | |
| MarketCap: 4813.9 Millions | |
| Recent Price: 104.51 Smart Investing & Trading Score: 10 | |
| Day Percent Change: -2.92588% Day Change: 1.03 | |
| Week Change: -12.3385% Year-to-date Change: 3.4% | |
| SKYW Links: Profile News Message Board | |
| Charts:- Daily , Weekly | |
| Add SKYW to Watchlist: View: Get Complete SKYW Trend Analysis ➞ | |
 | AAL American Airlines Group Inc |
| Sector: Industrials | |
| SubSector: Airlines | |
| MarketCap: 8630.56 Millions | |
| Recent Price: 12.53 Smart Investing & Trading Score: 30 | |
| Day Percent Change: -2.94345% Day Change: -0.32 | |
| Week Change: -4.20489% Year-to-date Change: -26.3% | |
| AAL Links: Profile News Message Board | |
| Charts:- Daily , Weekly | |
| Add AAL to Watchlist: View: Get Complete AAL Trend Analysis ➞ | |
 | BLBD Blue Bird Corp |
| Sector: Industrials | |
| SubSector: Farm & Heavy Construction Machinery | |
| MarketCap: 1865.38 Millions | |
| Recent Price: 56.24 Smart Investing & Trading Score: 30 | |
| Day Percent Change: -2.96756% Day Change: -0.54 | |
| Week Change: -4.40252% Year-to-date Change: 45.5% | |
| BLBD Links: Profile News Message Board | |
| Charts:- Daily , Weekly | |
| Add BLBD to Watchlist: View: Get Complete BLBD Trend Analysis ➞ | |
 | HEBT Hebron Technology Co., Ltd. |
| Sector: Industrials | |
| SubSector: Diversified Machinery | |
| MarketCap: 101.016 Millions | |
| Recent Price: 10.75 Smart Investing & Trading Score: 20 | |
| Day Percent Change: -2.97834% Day Change: -9999 | |
| Week Change: -47.1225% Year-to-date Change: 0.0% | |
| HEBT Links: Profile News Message Board | |
| Charts:- Daily , Weekly | |
| Add HEBT to Watchlist: View: Get Complete HEBT Trend Analysis ➞ | |
 | ATU Actuant Corporation |
| Sector: Industrials | |
| SubSector: Diversified Machinery | |
| MarketCap: 1674.8 Millions | |
| Recent Price: 4.44 Smart Investing & Trading Score: 10 | |
| Day Percent Change: -3.26797% Day Change: -9999 | |
| Week Change: -32.6252% Year-to-date Change: 0.0% | |
| ATU Links: Profile News Message Board | |
| Charts:- Daily , Weekly | |
| Add ATU to Watchlist: View: Get Complete ATU Trend Analysis ➞ | |
 | HTZ Hertz Global Holdings Inc |
| Sector: Industrials | |
| SubSector: Rental & Leasing Services | |
| MarketCap: 1700 Millions | |
| Recent Price: 6.19 Smart Investing & Trading Score: 60 | |
| Day Percent Change: -3.28125% Day Change: -0.18 | |
| Week Change: 13.1627% Year-to-date Change: 66.0% | |
| HTZ Links: Profile News Message Board | |
| Charts:- Daily , Weekly | |
| Add HTZ to Watchlist: View: Get Complete HTZ Trend Analysis ➞ | |
 | EVEX Eve Holding Inc |
| Sector: Industrials | |
| SubSector: Aerospace & Defense | |
| MarketCap: 1179.46 Millions | |
| Recent Price: 3.82 Smart Investing & Trading Score: 46 | |
| Day Percent Change: -3.41% Day Change: -0.14 | |
| Week Change: -10.41% Year-to-date Change: -27.2% | |
| EVEX Links: Profile News Message Board | |
| Charts:- Daily , Weekly | |
| Add EVEX to Watchlist: View: Get Complete EVEX Trend Analysis ➞ | |
 | ESGL ESGL Holdings Ltd |
| Sector: Industrials | |
| SubSector: Waste Management | |
| MarketCap: 157.21 Millions | |
| Recent Price: 3.56 Smart Investing & Trading Score: 80 | |
| Day Percent Change: -3.56911% Day Change: -9996.36 | |
| Week Change: 33.2697% Year-to-date Change: 170.6% | |
| ESGL Links: Profile News Message Board | |
| Charts:- Daily , Weekly | |
| Add ESGL to Watchlist: View: Get Complete ESGL Trend Analysis ➞ | |
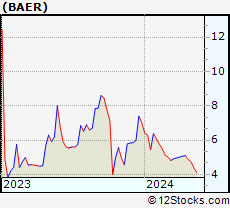 | BAER Bridger Aerospace Group Holdings Inc |
| Sector: Industrials | |
| SubSector: Security & Protection Services | |
| MarketCap: 112.72 Millions | |
| Recent Price: 1.82 Smart Investing & Trading Score: 10 | |
| Day Percent Change: -3.7037% Day Change: -0.01 | |
| Week Change: -10.3448% Year-to-date Change: -9.9% | |
| BAER Links: Profile News Message Board | |
| Charts:- Daily , Weekly | |
| Add BAER to Watchlist: View: Get Complete BAER Trend Analysis ➞ | |
 | EVLV Evolv Technologies Holdings Inc |
| Sector: Industrials | |
| SubSector: Security & Protection Services | |
| MarketCap: 1385.45 Millions | |
| Recent Price: 8.43 Smart Investing & Trading Score: 90 | |
| Day Percent Change: -3.76712% Day Change: -0.15 | |
| Week Change: 4.59057% Year-to-date Change: 112.3% | |
| EVLV Links: Profile News Message Board | |
| Charts:- Daily , Weekly | |
| Add EVLV to Watchlist: View: Get Complete EVLV Trend Analysis ➞ | |
 | SNCY Sun Country Airlines Holdings Inc |
| Sector: Industrials | |
| SubSector: Airlines | |
| MarketCap: 702.18 Millions | |
| Recent Price: 13.10 Smart Investing & Trading Score: 30 | |
| Day Percent Change: -4.0293% Day Change: -0.24 | |
| Week Change: -0.531511% Year-to-date Change: -9.8% | |
| SNCY Links: Profile News Message Board | |
| Charts:- Daily , Weekly | |
| Add SNCY to Watchlist: View: Get Complete SNCY Trend Analysis ➞ | |
| For tabular summary view of above stock list: Summary View ➞ 0 - 25 , 25 - 50 , 50 - 75 , 75 - 100 , 100 - 125 , 125 - 150 , 150 - 175 , 175 - 200 , 200 - 225 , 225 - 250 , 250 - 275 , 275 - 300 , 300 - 325 , 325 - 350 , 350 - 375 , 375 - 400 , 400 - 425 , 425 - 450 , 450 - 475 , 475 - 500 , 500 - 525 | ||
| Click To Change The Sort Order: By Market Cap or Company Size Performance: Year-to-date, Week and Day | |
| Select Chart Type: | ||
|
Best Stocks Today 12Stocks.com |
© 2025 12Stocks.com Terms & Conditions Privacy Contact Us
All Information Provided Only For Education And Not To Be Used For Investing or Trading. See Terms & Conditions


One More Thing ... Get Best Stocks Delivered Daily!
Never Ever Miss A Move With Our Top Ten Stocks Lists
Find Best Stocks In Any Market - Bull or Bear Market
Take A Peek At Our Top Ten Stocks Lists: Daily, Weekly, Year-to-Date & Top Trends
Find Best Stocks In Any Market - Bull or Bear Market
Take A Peek At Our Top Ten Stocks Lists: Daily, Weekly, Year-to-Date & Top Trends
Industrial Stocks With Best Up Trends [0-bearish to 100-bullish]: Brooge [100], Babcock & Wilcox Enterprises[100], Radiant Logistics[100], Ameresco [100], Ardmore Shipping[100], TAT Technologies[100], Powell Industries[100], Ballard Power[100], NAPCO Security[100], Comfort Systems[100], PICO [100]
Best Industrial Stocks Year-to-Date:
Triumph [1388.91%], GrafTech [509.884%], Tecogen [486.452%], Power [226.805%], Lightbridge Corp[205.49%], Bloom Energy[186.778%], ESGL [170.593%], Kratos Defense[168.158%], Tutor Perini[165.811%], Willdan [162.049%], Astronics Corp[153.325%] Best Industrial Stocks This Week:
TRC [10149.1%], Advanced Emissions[3571.78%], L3 Technologies[1915.25%], Forterra [1845.47%], KLX [437.488%], Allegro Merger[402.182%], LMI Aerospace[291.621%], Chicago Bridge[205.472%], Covanta Holding[148.617%], MOOG [148.377%], Altra [103.372%] Best Industrial Stocks Daily:
Brooge [29.5547%], Enovix [12.285%], Lightbridge Corp[11.5247%], Tecogen [10.989%], B/E Aerospace[8.86381%], Symbotic [7.62304%], NuScale Power[7.56742%], Zim Integrated[7.26339%], Babcock & Wilcox Enterprises[6.11511%], Radiant Logistics[5.52147%], Graham Corp[5.27823%]