
 Login Sign Up


| |||||
 |  | ||||

| 12Stocks.com Market Intelligence |
Best Industrial Stocks
| In a hurry? Industrial Stocks Lists: Performance Trends Table, Stock Charts
Sort Industrial stocks: Daily, Weekly, Year-to-Date, Market Cap & Trends. Filter Industrial stocks list by size:All Industrial Large Mid-Range Small |
| 12Stocks.com Industrial Stocks Performances & Trends Daily | |||||||||
|
|  The overall Smart Investing & Trading Score is 56 (0-bearish to 100-bullish) which puts Industrial sector in short term neutral trend. The Smart Investing & Trading Score from previous trading session is 63 and hence a deterioration of trend.
| ||||||||
Here are the Smart Investing & Trading Scores of the most requested Industrial stocks at 12Stocks.com (click stock name for detailed review):
|


| 12Stocks.com: Investing in Industrial sector with Stocks | |
|
The following table helps investors and traders sort through current performance and trends (as measured by Smart Investing & Trading Score) of various
stocks in the Industrial sector. Quick View: Move mouse or cursor over stock symbol (ticker) to view short-term Technical chart and over stock name to view long term chart. Click on  to add stock symbol to your watchlist and to add stock symbol to your watchlist and  to view watchlist. Click on any ticker or stock name for detailed market intelligence report for that stock. to view watchlist. Click on any ticker or stock name for detailed market intelligence report for that stock. |
12Stocks.com Performance of Stocks in Industrial Sector
| Ticker | Stock Name | Watchlist | Category | Recent Price | Smart Investing & Trading Score | Change % | YTD Change% |
| UFPI | Universal Forest |   | Lumber, Wood | 113.68 | 45 | -0.30 | -9.46% |
| THR | Thermon | | Machinery | 31.04 | 49 | -0.32 | -4.70% |
| WTTR | Select Energy | | Pollution & Treatment Controls | 9.36 | 61 | -0.32 | 23.32% |
| SKYH | Sky Harbour | | Aerospace & Defense | 8.98 | 32 | -0.33 | -7.76% |
| ROP | Roper Technologies | | Machinery | 537.79 | 38 | -0.34 | -1.35% |
| BECN | Beacon Roofing | | Building Materials | 97.21 | 68 | -0.35 | 11.71% |
| GTLS | Chart Industries | | Fabrication | 152.95 | 68 | -0.37 | 12.19% |
| ALG | Alamo | | Machinery | 204.20 | 10 | -0.39 | -2.85% |
| CDRE | Cadre | | Aerospace & Defense | 33.27 | 18 | -0.39 | 0.91% |
| SPXC | SPX | | Machinery | 119.88 | 63 | -0.40 | 18.68% |
| VMI | Valmont Industries | | Fabrication | 212.63 | 35 | -0.42 | -8.94% |
| WTS | Watts Water | | Equipment | 205.76 | 68 | -0.42 | -1.24% |
| HRT | HireRight | | Staffing & Employment | 14.27 | 68 | -0.42 | 6.10% |
| ASPN | Aspen Aerogels | | Building Materials | 16.56 | 85 | -0.42 | 4.94% |
| MLM | Martin Marietta | | Building Materials | 591.82 | 63 | -0.43 | 18.62% |
| PHM | Pulte | | Residential | 112.26 | 65 | -0.44 | 8.76% |
| AWI | Armstrong World | | Building Materials | 115.96 | 63 | -0.46 | 17.94% |
| EOSE | Eos Energy | | Electrical Equipment & Parts | 0.76 | 22 | -0.46 | -30.31% |
| NVR | NVR | | Residential | 7798.28 | 63 | -0.47 | 11.40% |
| CWST | Casella Waste | | Waste Mgmt | 94.98 | 76 | -0.47 | 11.14% |
| MIDD | Middleby | | Machinery | 144.68 | 63 | -0.47 | -1.69% |
| HI | Hillenbrand | | Machinery | 48.95 | 83 | -0.47 | 2.30% |
| PRLB | Proto Labs | | Machine Tools | 31.95 | 25 | -0.47 | -17.99% |
| ATKR | Atkore | | Electrical Equipment | 179.11 | 75 | -0.48 | 11.94% |
| DOV | Dover | | Machinery | 171.44 | 61 | -0.49 | 11.46% |
| For chart view version of above stock list: Chart View ➞ 0 - 25 , 25 - 50 , 50 - 75 , 75 - 100 , 100 - 125 , 125 - 150 , 150 - 175 , 175 - 200 , 200 - 225 , 225 - 250 , 250 - 275 , 275 - 300 | ||
 | Click To Change The Sort Order: By Market Cap or Company Size Performance: Year-to-date, Week and Day |  |
|
Get the most comprehensive stock market coverage daily at 12Stocks.com ➞ Best Stocks Today ➞ Best Stocks Weekly ➞ Best Stocks Year-to-Date ➞ Best Stocks Trends ➞  Best Stocks Today 12Stocks.com Best Nasdaq Stocks ➞ Best S&P 500 Stocks ➞ Best Tech Stocks ➞ Best Biotech Stocks ➞ |
| Detailed Overview of Industrial Stocks |
| Industrial Technical Overview, Leaders & Laggards, Top Industrial ETF Funds & Detailed Industrial Stocks List, Charts, Trends & More |
| Industrial Sector: Technical Analysis, Trends & YTD Performance | |
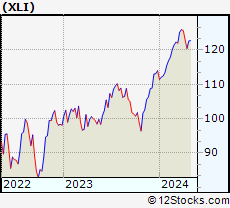
| Industrial sector is composed of stocks
from industrial machinery, aerospace, defense, farm/construction
and industrial services subsectors. Industrial sector, as represented by XLI, an exchange-traded fund [ETF] that holds basket of Industrial stocks (e.g, Caterpillar, Boeing) is up by 7.11% and is currently outperforming the overall market by 1.45% year-to-date. Below is a quick view of Technical charts and trends: |
|
 XLI Weekly Chart |
|
| Long Term Trend: Very Good | |
| Medium Term Trend: Not Good | |
 XLI Daily Chart |
|
| Short Term Trend: Very Good | |
| Overall Trend Score: 56 | |
| YTD Performance: 7.11% | |
| **Trend Scores & Views Are Only For Educational Purposes And Not For Investing | |
| 12Stocks.com: Top Performing Industrial Sector Stocks | ||||||||||||||||||||||||||||||||||||||||||||||||
 The top performing Industrial sector stocks year to date are
Now, more recently, over last week, the top performing Industrial sector stocks on the move are


|
||||||||||||||||||||||||||||||||||||||||||||||||
| 12Stocks.com: Investing in Industrial Sector using Exchange Traded Funds | |
|
The following table shows list of key exchange traded funds (ETF) that
help investors track Industrial Index. For detailed view, check out our ETF Funds section of our website. Quick View: Move mouse or cursor over ETF symbol (ticker) to view short-term Technical chart and over ETF name to view long term chart. Click on ticker or stock name for detailed view. Click on to add stock symbol to your watchlist and to view watchlist. |
12Stocks.com List of ETFs that track Industrial Index
| Ticker | ETF Name | Watchlist | Recent Price | Smart Investing & Trading Score | Change % | Week % | Year-to-date % |
| XLI | Industrial | | 122.09 | 56 | -0.80 | 1.34 | 7.11% |
| UXI | Industrials | | 32.00 | 56 | -2.85 | 1.43 | 11.13% |
| PPA | Aerospace & Defense | | 99.78 | 63 | -0.67 | 1.5 | 8.27% |
| ITA | Aerospace & Defense | | 128.51 | 56 | -0.66 | 0.4 | 1.51% |
| ITB | Home Construction | | 104.74 | 58 | -1.18 | 2.33 | 2.96% |
| XHB | Homebuilders | | 102.63 | 58 | -0.96 | 2.47 | 7.29% |
| SIJ | Short Industrials | | 9.82 | 32 | -0.20 | -4.04 | -13.4% |
| IYJ | Industrials | | 121.23 | 41 | -0.57 | 1.52 | 6.01% |
| EXI | Global Industrials | | 135.26 | 41 | -0.69 | 1.68 | 6.14% |
| VIS | Industrials | | 235.54 | 46 | -0.69 | 1.44 | 6.85% |
| PSCI | SmallCap Industrials | | 120.96 | 56 | -1.03 | 1.78 | 4.31% |
| XAR | Aerospace & Defense | | 134.64 | 43 | -0.39 | 1.82 | -0.58% |
| ARKQ | ARK Industrial Innovation | | 51.70 | 17 | 1.27 | 3.69 | -10.4% |
| 12Stocks.com: Charts, Trends, Fundamental Data and Performances of Industrial Stocks | |
|
We now take in-depth look at all Industrial stocks including charts, multi-period performances and overall trends (as measured by Smart Investing & Trading Score). One can sort Industrial stocks (click link to choose) by Daily, Weekly and by Year-to-Date performances. Also, one can sort by size of the company or by market capitalization. |
| Select Your Default Chart Type: | |||||
| |||||
| Click on stock symbol or name for detailed view. Click on to add stock symbol to your watchlist and to view watchlist. Quick View: Move mouse or cursor over "Daily" to quickly view daily Technical stock chart and over "Weekly" to view weekly Technical stock chart. | |||||

 | UFPI Universal Forest Products, Inc. |
| Sector: Industrials | |
| SubSector: Lumber, Wood Production | |
| MarketCap: 2263.38 Millions | |
| Recent Price: 113.68 Smart Investing & Trading Score: 45 | |
| Day Percent Change: -0.30% Day Change: -0.34 | |
| Week Change: 1.69% Year-to-date Change: -9.5% | |
| UFPI Links: Profile News Message Board | |
| Charts:- Daily , Weekly | |
| Add UFPI to Watchlist: View: Get Complete UFPI Trend Analysis ➞ | |
 | THR Thermon Group Holdings, Inc. |
| Sector: Industrials | |
| SubSector: Diversified Machinery | |
| MarketCap: 492.816 Millions | |
| Recent Price: 31.04 Smart Investing & Trading Score: 49 | |
| Day Percent Change: -0.32% Day Change: -0.10 | |
| Week Change: 4.37% Year-to-date Change: -4.7% | |
| THR Links: Profile News Message Board | |
| Charts:- Daily , Weekly | |
| Add THR to Watchlist: View: Get Complete THR Trend Analysis ➞ | |
 | WTTR Select Energy Services, Inc. |
| Sector: Industrials | |
| SubSector: Pollution & Treatment Controls | |
| MarketCap: 347.075 Millions | |
| Recent Price: 9.36 Smart Investing & Trading Score: 61 | |
| Day Percent Change: -0.32% Day Change: -0.03 | |
| Week Change: 0.21% Year-to-date Change: 23.3% | |
| WTTR Links: Profile News Message Board | |
| Charts:- Daily , Weekly | |
| Add WTTR to Watchlist: View: Get Complete WTTR Trend Analysis ➞ | |
 | SKYH Sky Harbour Group Corporation |
| Sector: Industrials | |
| SubSector: Aerospace & Defense | |
| MarketCap: 271 Millions | |
| Recent Price: 8.98 Smart Investing & Trading Score: 32 | |
| Day Percent Change: -0.33% Day Change: -0.03 | |
| Week Change: 1.93% Year-to-date Change: -7.8% | |
| SKYH Links: Profile News Message Board | |
| Charts:- Daily , Weekly | |
| Add SKYH to Watchlist: View: Get Complete SKYH Trend Analysis ➞ | |
 | ROP Roper Technologies, Inc. |
| Sector: Industrials | |
| SubSector: Diversified Machinery | |
| MarketCap: 33366.2 Millions | |
| Recent Price: 537.79 Smart Investing & Trading Score: 38 | |
| Day Percent Change: -0.34% Day Change: -1.83 | |
| Week Change: 0.64% Year-to-date Change: -1.4% | |
| ROP Links: Profile News Message Board | |
| Charts:- Daily , Weekly | |
| Add ROP to Watchlist: View: Get Complete ROP Trend Analysis ➞ | |
 | BECN Beacon Roofing Supply, Inc. |
| Sector: Industrials | |
| SubSector: General Building Materials | |
| MarketCap: 1210.13 Millions | |
| Recent Price: 97.21 Smart Investing & Trading Score: 68 | |
| Day Percent Change: -0.35% Day Change: -0.34 | |
| Week Change: 2.8% Year-to-date Change: 11.7% | |
| BECN Links: Profile News Message Board | |
| Charts:- Daily , Weekly | |
| Add BECN to Watchlist: View: Get Complete BECN Trend Analysis ➞ | |
 | GTLS Chart Industries, Inc. |
| Sector: Industrials | |
| SubSector: Metal Fabrication | |
| MarketCap: 751.15 Millions | |
| Recent Price: 152.95 Smart Investing & Trading Score: 68 | |
| Day Percent Change: -0.37% Day Change: -0.57 | |
| Week Change: 3.32% Year-to-date Change: 12.2% | |
| GTLS Links: Profile News Message Board | |
| Charts:- Daily , Weekly | |
| Add GTLS to Watchlist: View: Get Complete GTLS Trend Analysis ➞ | |
 | ALG Alamo Group Inc. |
| Sector: Industrials | |
| SubSector: Farm & Construction Machinery | |
| MarketCap: 964.107 Millions | |
| Recent Price: 204.20 Smart Investing & Trading Score: 10 | |
| Day Percent Change: -0.39% Day Change: -0.79 | |
| Week Change: 0.92% Year-to-date Change: -2.9% | |
| ALG Links: Profile News Message Board | |
| Charts:- Daily , Weekly | |
| Add ALG to Watchlist: View: Get Complete ALG Trend Analysis ➞ | |
 | CDRE Cadre Holdings, Inc. |
| Sector: Industrials | |
| SubSector: Aerospace & Defense | |
| MarketCap: 817 Millions | |
| Recent Price: 33.27 Smart Investing & Trading Score: 18 | |
| Day Percent Change: -0.39% Day Change: -0.13 | |
| Week Change: 1.25% Year-to-date Change: 0.9% | |
| CDRE Links: Profile News Message Board | |
| Charts:- Daily , Weekly | |
| Add CDRE to Watchlist: View: Get Complete CDRE Trend Analysis ➞ | |
 | SPXC SPX Corporation |
| Sector: Industrials | |
| SubSector: Diversified Machinery | |
| MarketCap: 1415.56 Millions | |
| Recent Price: 119.88 Smart Investing & Trading Score: 63 | |
| Day Percent Change: -0.40% Day Change: -0.48 | |
| Week Change: 3.14% Year-to-date Change: 18.7% | |
| SPXC Links: Profile News Message Board | |
| Charts:- Daily , Weekly | |
| Add SPXC to Watchlist: View: Get Complete SPXC Trend Analysis ➞ | |
 | VMI Valmont Industries, Inc. |
| Sector: Industrials | |
| SubSector: Metal Fabrication | |
| MarketCap: 2251.6 Millions | |
| Recent Price: 212.63 Smart Investing & Trading Score: 35 | |
| Day Percent Change: -0.42% Day Change: -0.90 | |
| Week Change: -0.27% Year-to-date Change: -8.9% | |
| VMI Links: Profile News Message Board | |
| Charts:- Daily , Weekly | |
| Add VMI to Watchlist: View: Get Complete VMI Trend Analysis ➞ | |
 | WTS Watts Water Technologies, Inc. |
| Sector: Industrials | |
| SubSector: Industrial Equipment & Components | |
| MarketCap: 2903.29 Millions | |
| Recent Price: 205.76 Smart Investing & Trading Score: 68 | |
| Day Percent Change: -0.42% Day Change: -0.86 | |
| Week Change: 1.25% Year-to-date Change: -1.2% | |
| WTS Links: Profile News Message Board | |
| Charts:- Daily , Weekly | |
| Add WTS to Watchlist: View: Get Complete WTS Trend Analysis ➞ | |
 | HRT HireRight Holdings Corporation |
| Sector: Industrials | |
| SubSector: Staffing & Employment Services | |
| MarketCap: 823 Millions | |
| Recent Price: 14.27 Smart Investing & Trading Score: 68 | |
| Day Percent Change: -0.42% Day Change: -0.06 | |
| Week Change: 0.21% Year-to-date Change: 6.1% | |
| HRT Links: Profile News Message Board | |
| Charts:- Daily , Weekly | |
| Add HRT to Watchlist: View: Get Complete HRT Trend Analysis ➞ | |
 | ASPN Aspen Aerogels, Inc. |
| Sector: Industrials | |
| SubSector: General Building Materials | |
| MarketCap: 150.153 Millions | |
| Recent Price: 16.56 Smart Investing & Trading Score: 85 | |
| Day Percent Change: -0.42% Day Change: -0.07 | |
| Week Change: 10.7% Year-to-date Change: 4.9% | |
| ASPN Links: Profile News Message Board | |
| Charts:- Daily , Weekly | |
| Add ASPN to Watchlist: View: Get Complete ASPN Trend Analysis ➞ | |
 | MLM Martin Marietta Materials, Inc. |
| Sector: Industrials | |
| SubSector: General Building Materials | |
| MarketCap: 10624.3 Millions | |
| Recent Price: 591.82 Smart Investing & Trading Score: 63 | |
| Day Percent Change: -0.43% Day Change: -2.57 | |
| Week Change: 2.77% Year-to-date Change: 18.6% | |
| MLM Links: Profile News Message Board | |
| Charts:- Daily , Weekly | |
| Add MLM to Watchlist: View: Get Complete MLM Trend Analysis ➞ | |
 | PHM PulteGroup, Inc. |
| Sector: Industrials | |
| SubSector: Residential Construction | |
| MarketCap: 6186.46 Millions | |
| Recent Price: 112.26 Smart Investing & Trading Score: 65 | |
| Day Percent Change: -0.44% Day Change: -0.50 | |
| Week Change: 6.48% Year-to-date Change: 8.8% | |
| PHM Links: Profile News Message Board | |
| Charts:- Daily , Weekly | |
| Add PHM to Watchlist: View: Get Complete PHM Trend Analysis ➞ | |
 | AWI Armstrong World Industries, Inc. |
| Sector: Industrials | |
| SubSector: General Building Materials | |
| MarketCap: 3609.53 Millions | |
| Recent Price: 115.96 Smart Investing & Trading Score: 63 | |
| Day Percent Change: -0.46% Day Change: -0.54 | |
| Week Change: 1.74% Year-to-date Change: 17.9% | |
| AWI Links: Profile News Message Board | |
| Charts:- Daily , Weekly | |
| Add AWI to Watchlist: View: Get Complete AWI Trend Analysis ➞ | |
 | EOSE Eos Energy Enterprises, Inc. |
| Sector: Industrials | |
| SubSector: Electrical Equipment & Parts | |
| MarketCap: 76627 Millions | |
| Recent Price: 0.76 Smart Investing & Trading Score: 22 | |
| Day Percent Change: -0.46% Day Change: 0.00 | |
| Week Change: -1.69% Year-to-date Change: -30.3% | |
| EOSE Links: Profile News Message Board | |
| Charts:- Daily , Weekly | |
| Add EOSE to Watchlist: View: Get Complete EOSE Trend Analysis ➞ | |
 | NVR NVR, Inc. |
| Sector: Industrials | |
| SubSector: Residential Construction | |
| MarketCap: 9912.56 Millions | |
| Recent Price: 7798.28 Smart Investing & Trading Score: 63 | |
| Day Percent Change: -0.47% Day Change: -36.83 | |
| Week Change: 1.47% Year-to-date Change: 11.4% | |
| NVR Links: Profile News Message Board | |
| Charts:- Daily , Weekly | |
| Add NVR to Watchlist: View: Get Complete NVR Trend Analysis ➞ | |
 | CWST Casella Waste Systems, Inc. |
| Sector: Industrials | |
| SubSector: Waste Management | |
| MarketCap: 2093.38 Millions | |
| Recent Price: 94.98 Smart Investing & Trading Score: 76 | |
| Day Percent Change: -0.47% Day Change: -0.45 | |
| Week Change: 1.66% Year-to-date Change: 11.1% | |
| CWST Links: Profile News Message Board | |
| Charts:- Daily , Weekly | |
| Add CWST to Watchlist: View: Get Complete CWST Trend Analysis ➞ | |
 | MIDD The Middleby Corporation |
| Sector: Industrials | |
| SubSector: Diversified Machinery | |
| MarketCap: 3070.36 Millions | |
| Recent Price: 144.68 Smart Investing & Trading Score: 63 | |
| Day Percent Change: -0.47% Day Change: -0.68 | |
| Week Change: 1.46% Year-to-date Change: -1.7% | |
| MIDD Links: Profile News Message Board | |
| Charts:- Daily , Weekly | |
| Add MIDD to Watchlist: View: Get Complete MIDD Trend Analysis ➞ | |
 | HI Hillenbrand, Inc. |
| Sector: Industrials | |
| SubSector: Diversified Machinery | |
| MarketCap: 1389.86 Millions | |
| Recent Price: 48.95 Smart Investing & Trading Score: 83 | |
| Day Percent Change: -0.47% Day Change: -0.23 | |
| Week Change: 1.94% Year-to-date Change: 2.3% | |
| HI Links: Profile News Message Board | |
| Charts:- Daily , Weekly | |
| Add HI to Watchlist: View: Get Complete HI Trend Analysis ➞ | |
 | PRLB Proto Labs, Inc. |
| Sector: Industrials | |
| SubSector: Machine Tools & Accessories | |
| MarketCap: 1944.78 Millions | |
| Recent Price: 31.95 Smart Investing & Trading Score: 25 | |
| Day Percent Change: -0.47% Day Change: -0.15 | |
| Week Change: -0.03% Year-to-date Change: -18.0% | |
| PRLB Links: Profile News Message Board | |
| Charts:- Daily , Weekly | |
| Add PRLB to Watchlist: View: Get Complete PRLB Trend Analysis ➞ | |
 | ATKR Atkore International Group Inc. |
| Sector: Industrials | |
| SubSector: Industrial Electrical Equipment | |
| MarketCap: 1086.79 Millions | |
| Recent Price: 179.11 Smart Investing & Trading Score: 75 | |
| Day Percent Change: -0.48% Day Change: -0.87 | |
| Week Change: 4.24% Year-to-date Change: 11.9% | |
| ATKR Links: Profile News Message Board | |
| Charts:- Daily , Weekly | |
| Add ATKR to Watchlist: View: Get Complete ATKR Trend Analysis ➞ | |
 | DOV Dover Corporation |
| Sector: Industrials | |
| SubSector: Diversified Machinery | |
| MarketCap: 10725.6 Millions | |
| Recent Price: 171.44 Smart Investing & Trading Score: 61 | |
| Day Percent Change: -0.49% Day Change: -0.85 | |
| Week Change: 0.94% Year-to-date Change: 11.5% | |
| DOV Links: Profile News Message Board | |
| Charts:- Daily , Weekly | |
| Add DOV to Watchlist: View: Get Complete DOV Trend Analysis ➞ | |
| For tabular summary view of above stock list: Summary View ➞ 0 - 25 , 25 - 50 , 50 - 75 , 75 - 100 , 100 - 125 , 125 - 150 , 150 - 175 , 175 - 200 , 200 - 225 , 225 - 250 , 250 - 275 , 275 - 300 | ||
| Click To Change The Sort Order: By Market Cap or Company Size Performance: Year-to-date, Week and Day | |
| Select Chart Type: | ||
|
Best Stocks Today 12Stocks.com |
© 2024 12Stocks.com Terms & Conditions Privacy Contact Us
All Information Provided Only For Education And Not To Be Used For Investing or Trading. See Terms & Conditions


One More Thing ... Get Best Stocks Delivered Daily!
Never Ever Miss A Move With Our Top Ten Stocks Lists
Find Best Stocks In Any Market - Bull or Bear Market
Take A Peek At Our Top Ten Stocks Lists: Daily, Weekly, Year-to-Date & Top Trends
Find Best Stocks In Any Market - Bull or Bear Market
Take A Peek At Our Top Ten Stocks Lists: Daily, Weekly, Year-to-Date & Top Trends
Industrial Stocks With Best Up Trends [0-bearish to 100-bullish]: Caesarstone [100], Crane Co[100], Mueller Industries[100], Generac [100], Mueller Water[100], AAR [100], Northrop Grumman[100], AeroVironment [100], AZZ [100], Powell Industries[95], NET Power[95]
Best Industrial Stocks Year-to-Date:
Intuitive Machines[121.6%], FTAI Infrastructure[91.26%], Caesarstone [79.95%], NuScale Power[72.09%], Powell Industries[68.78%], IES [62.5%], EMCOR [57.31%], Masonite [55.45%], Tutor Perini[52.86%], ADS-TEC Energy[50.77%], Comfort Systems[50.09%] Best Industrial Stocks This Week:
Caesarstone [18.28%], BiomX [14.8%], Powell Industries[14.47%], NuScale Power[14.43%], ZIM Integrated[13.72%], FTAI Infrastructure[11.54%], IES [11.44%], Mueller Industries[10.86%], Aspen Aerogels[10.7%], M/I Homes[10.2%], AZZ [10.2%] Best Industrial Stocks Daily:
Hertz Global[6.41%], Freightos [6.20%], Novonix [5.52%], GrafTech [5.10%], Satellogic [4.17%], Powell Industries[4.05%], Caesarstone [4.02%], MingZhu Logistics[2.95%], Crane Co[2.91%], M/I Homes[2.47%], Bridger Aerospace[2.27%]