
 Login Sign Up


| |||||
 |  | ||||

| 12Stocks.com Market Intelligence |
Best Industrial Stocks
| In a hurry? Industrial Stocks Lists: Performance Trends Table, Stock Charts
Sort Industrial stocks: Daily, Weekly, Year-to-Date, Market Cap & Trends. Filter Industrial stocks list by size:All Industrial Large Mid-Range Small |
| 12Stocks.com Industrial Stocks Performances & Trends Daily | |||||||||
|
|  The overall Smart Investing & Trading Score is 70 (0-bearish to 100-bullish) which puts Industrial sector in short term neutral to bullish trend. The Smart Investing & Trading Score from previous trading session is 60 and an improvement of trend continues.
| ||||||||
Here are the Smart Investing & Trading Scores of the most requested Industrial stocks at 12Stocks.com (click stock name for detailed review):
|


| 12Stocks.com: Investing in Industrial sector with Stocks | |
|
The following table helps investors and traders sort through current performance and trends (as measured by Smart Investing & Trading Score) of various
stocks in the Industrial sector. Quick View: Move mouse or cursor over stock symbol (ticker) to view short-term Technical chart and over stock name to view long term chart. Click on  to add stock symbol to your watchlist and to add stock symbol to your watchlist and  to view watchlist. Click on any ticker or stock name for detailed market intelligence report for that stock. to view watchlist. Click on any ticker or stock name for detailed market intelligence report for that stock. |
12Stocks.com Performance of Stocks in Industrial Sector
| Ticker | Stock Name | Watchlist | Category | Recent Price | Smart Investing & Trading Score | Change % | YTD Change% |
| SPCE | Virgin Galactic |   | Aerospace & Defense | 3.28 | 70 | -0.91 | -45.87% |
| WM | Waste Management | | Waste Mgmt | 216.13 | 0 | -0.93 | 8.55% |
| AZEK | AZEK | | Building Products & Equipment | 54.35 | 70 | -0.93 | 15.42% |
| ASR | Grupo Aeroportuario | | Airports & Air | 343.19 | 70 | -0.94 | 42.36% |
| TREX | TREX Co | | Building Products & Equipment | 59.88 | 20 | -0.94 | -12.26% |
| FA | First Advantage | | Specialty | 15.63 | 0 | -0.95 | -15.19% |
| CWST | Casella Waste | | Waste Mgmt | 90.26 | 0 | -0.95 | -13.38% |
| RYAAY | Ryanair | | Airlines | 58.12 | 20 | -0.95 | 38.13% |
| AEGN | Aegion | | Heavy Construction | 56.07 | 70 | -0.95 | 0.00% |
| LPX | Louisiana-Pacific Corp | | Building Products & Equipment | 94.97 | 30 | -0.98 | -8.04% |
| AAXN | Axon Enterprise | | Aerospace/Defense | 58.81 | 10 | -1.01 | 0.00% |
| TRI | Thomson-Reuters Corp | | Specialty | 171.22 | 20 | -1.02 | 6.85% |
| MYRG | MYR | | Engineering & Construction | 173.81 | 0 | -1.03 | 17.53% |
| ABB | ABB | | Machinery | 40.54 | 60 | -1.05 | 0.00% |
| DCO | Ducommun | | Aerospace & Defense | 92.04 | 60 | -1.06 | 44.74% |
| ISSC | Innovative | | Aerospace & Defense | 11.03 | 10 | -1.08 | 27.66% |
| HURC | Hurco | | Specialty Industrial Machinery | 17.55 | 40 | -1.13 | -11.27% |
| LECO | Loln Electric | | Tools & Accessories | 236.40 | 30 | -1.14 | 28.90% |
| JBHT | J.B. Hunt | | Integrated Freight & Logistics | 136.35 | 10 | -1.15 | -19.64% |
| ESLT | Elbit Systems | | Aerospace & Defense | 503.42 | 70 | -1.20 | 92.43% |
| KBR | KBR | | Engineering & Construction | 48.78 | 30 | -1.24 | -15.18% |
| TH | Target Hospitality | | Specialty | 8.72 | 50 | -1.25 | -10.01% |
| RHI | Robert Half | | Staffing & Employment | 34.98 | 20 | -1.30 | -47.77% |
| CTAS | Cintas | | Specialty | 199.71 | 0 | -1.31 | 10.09% |
| PAC | Grupo Aeroportuario | | Airports & Air | 251.21 | 60 | -1.37 | 40.76% |
| For chart view version of above stock list: Chart View ➞ 0 - 25 , 25 - 50 , 50 - 75 , 75 - 100 , 100 - 125 , 125 - 150 , 150 - 175 , 175 - 200 , 200 - 225 , 225 - 250 , 250 - 275 , 275 - 300 , 300 - 325 , 325 - 350 , 350 - 375 , 375 - 400 , 400 - 425 , 425 - 450 , 450 - 475 , 475 - 500 , 500 - 525 | ||
 | Click To Change The Sort Order: By Market Cap or Company Size Performance: Year-to-date, Week and Day |  |
|
Get the most comprehensive stock market coverage daily at 12Stocks.com ➞ Best Stocks Today ➞ Best Stocks Weekly ➞ Best Stocks Year-to-Date ➞ Best Stocks Trends ➞  Best Stocks Today 12Stocks.com Best Nasdaq Stocks ➞ Best S&P 500 Stocks ➞ Best Tech Stocks ➞ Best Biotech Stocks ➞ |
| Detailed Overview of Industrial Stocks |
| Industrial Technical Overview, Leaders & Laggards, Top Industrial ETF Funds & Detailed Industrial Stocks List, Charts, Trends & More |
| Industrial Sector: Technical Analysis, Trends & YTD Performance | |
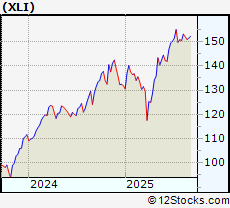
| Industrial sector is composed of stocks
from industrial machinery, aerospace, defense, farm/construction
and industrial services subsectors. Industrial sector, as represented by XLI, an exchange-traded fund [ETF] that holds basket of Industrial stocks (e.g, Caterpillar, Boeing) is up by 16.6888% and is currently outperforming the overall market by 3.288% year-to-date. Below is a quick view of Technical charts and trends: |
|
 XLI Weekly Chart |
|
| Long Term Trend: Good | |
| Medium Term Trend: Good | |
 XLI Daily Chart |
|
| Short Term Trend: Very Good | |
| Overall Trend Score: 70 | |
| YTD Performance: 16.6888% | |
| **Trend Scores & Views Are Only For Educational Purposes And Not For Investing | |
| 12Stocks.com: Top Performing Industrial Sector Stocks | ||||||||||||||||||||||||||||||||||||||||||||||||
 The top performing Industrial sector stocks year to date are
Now, more recently, over last week, the top performing Industrial sector stocks on the move are


|
||||||||||||||||||||||||||||||||||||||||||||||||
| 12Stocks.com: Investing in Industrial Sector using Exchange Traded Funds | |
|
The following table shows list of key exchange traded funds (ETF) that
help investors track Industrial Index. For detailed view, check out our ETF Funds section of our website. Quick View: Move mouse or cursor over ETF symbol (ticker) to view short-term Technical chart and over ETF name to view long term chart. Click on ticker or stock name for detailed view. Click on to add stock symbol to your watchlist and to view watchlist. |
12Stocks.com List of ETFs that track Industrial Index
| Ticker | ETF Name | Watchlist | Recent Price | Smart Investing & Trading Score | Change % | Week % | Year-to-date % |
| CHII | China Industrials | | 9.80 | 20 | 0 | -0.0509944 | 0% |
| 12Stocks.com: Charts, Trends, Fundamental Data and Performances of Industrial Stocks | |
|
We now take in-depth look at all Industrial stocks including charts, multi-period performances and overall trends (as measured by Smart Investing & Trading Score). One can sort Industrial stocks (click link to choose) by Daily, Weekly and by Year-to-Date performances. Also, one can sort by size of the company or by market capitalization. |
| Select Your Default Chart Type: | |||||
| |||||
| Click on stock symbol or name for detailed view. Click on to add stock symbol to your watchlist and to view watchlist. Quick View: Move mouse or cursor over "Daily" to quickly view daily Technical stock chart and over "Weekly" to view weekly Technical stock chart. | |||||

 | SPCE Virgin Galactic Holdings Inc |
| Sector: Industrials | |
| SubSector: Aerospace & Defense | |
| MarketCap: 185.44 Millions | |
| Recent Price: 3.28 Smart Investing & Trading Score: 70 | |
| Day Percent Change: -0.906344% Day Change: 0.01 | |
| Week Change: 1.86335% Year-to-date Change: -45.9% | |
| SPCE Links: Profile News Message Board | |
| Charts:- Daily , Weekly | |
| Add SPCE to Watchlist: View: Get Complete SPCE Trend Analysis ➞ | |
 | WM Waste Management, Inc |
| Sector: Industrials | |
| SubSector: Waste Management | |
| MarketCap: 88646.8 Millions | |
| Recent Price: 216.13 Smart Investing & Trading Score: 0 | |
| Day Percent Change: -0.93051% Day Change: -1.49 | |
| Week Change: -1.78588% Year-to-date Change: 8.5% | |
| WM Links: Profile News Message Board | |
| Charts:- Daily , Weekly | |
| Add WM to Watchlist: View: Get Complete WM Trend Analysis ➞ | |
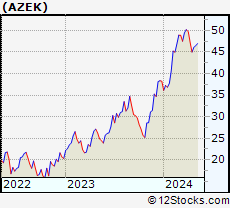 | AZEK The AZEK Company Inc. |
| Sector: Industrials | |
| SubSector: Building Products & Equipment | |
| MarketCap: 55127 Millions | |
| Recent Price: 54.35 Smart Investing & Trading Score: 70 | |
| Day Percent Change: -0.929639% Day Change: -9999 | |
| Week Change: 6.17308% Year-to-date Change: 15.4% | |
| AZEK Links: Profile News Message Board | |
| Charts:- Daily , Weekly | |
| Add AZEK to Watchlist: View: Get Complete AZEK Trend Analysis ➞ | |
 | ASR Grupo Aeroportuario Del Sureste S.A. ADR |
| Sector: Industrials | |
| SubSector: Airports & Air Services | |
| MarketCap: 9391.68 Millions | |
| Recent Price: 343.19 Smart Investing & Trading Score: 70 | |
| Day Percent Change: -0.943832% Day Change: 8.43 | |
| Week Change: 3.1778% Year-to-date Change: 42.4% | |
| ASR Links: Profile News Message Board | |
| Charts:- Daily , Weekly | |
| Add ASR to Watchlist: View: Get Complete ASR Trend Analysis ➞ | |
 | TREX TREX Co., Inc |
| Sector: Industrials | |
| SubSector: Building Products & Equipment | |
| MarketCap: 6927.34 Millions | |
| Recent Price: 59.88 Smart Investing & Trading Score: 20 | |
| Day Percent Change: -0.942928% Day Change: -0.5 | |
| Week Change: -7.3065% Year-to-date Change: -12.3% | |
| TREX Links: Profile News Message Board | |
| Charts:- Daily , Weekly | |
| Add TREX to Watchlist: View: Get Complete TREX Trend Analysis ➞ | |
 | FA First Advantage Corp |
| Sector: Industrials | |
| SubSector: Specialty Business Services | |
| MarketCap: 2794.29 Millions | |
| Recent Price: 15.63 Smart Investing & Trading Score: 0 | |
| Day Percent Change: -0.95057% Day Change: -0.19 | |
| Week Change: -2.67746% Year-to-date Change: -15.2% | |
| FA Links: Profile News Message Board | |
| Charts:- Daily , Weekly | |
| Add FA to Watchlist: View: Get Complete FA Trend Analysis ➞ | |
 | CWST Casella Waste Systems, Inc |
| Sector: Industrials | |
| SubSector: Waste Management | |
| MarketCap: 6011.89 Millions | |
| Recent Price: 90.26 Smart Investing & Trading Score: 0 | |
| Day Percent Change: -0.95468% Day Change: 0.52 | |
| Week Change: -4.67842% Year-to-date Change: -13.4% | |
| CWST Links: Profile News Message Board | |
| Charts:- Daily , Weekly | |
| Add CWST to Watchlist: View: Get Complete CWST Trend Analysis ➞ | |
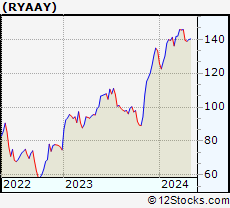 | RYAAY Ryanair Holdings Plc ADR |
| Sector: Industrials | |
| SubSector: Airlines | |
| MarketCap: 32112.1 Millions | |
| Recent Price: 58.12 Smart Investing & Trading Score: 20 | |
| Day Percent Change: -0.954329% Day Change: -0.24 | |
| Week Change: -3.94976% Year-to-date Change: 38.1% | |
| RYAAY Links: Profile News Message Board | |
| Charts:- Daily , Weekly | |
| Add RYAAY to Watchlist: View: Get Complete RYAAY Trend Analysis ➞ | |
 | AEGN Aegion Corporation |
| Sector: Industrials | |
| SubSector: Heavy Construction | |
| MarketCap: 473.995 Millions | |
| Recent Price: 56.07 Smart Investing & Trading Score: 70 | |
| Day Percent Change: -0.953895% Day Change: -9999 | |
| Week Change: 86.9623% Year-to-date Change: 0.0% | |
| AEGN Links: Profile News Message Board | |
| Charts:- Daily , Weekly | |
| Add AEGN to Watchlist: View: Get Complete AEGN Trend Analysis ➞ | |
 | LPX Louisiana-Pacific Corp |
| Sector: Industrials | |
| SubSector: Building Products & Equipment | |
| MarketCap: 6895.85 Millions | |
| Recent Price: 94.97 Smart Investing & Trading Score: 30 | |
| Day Percent Change: -0.980085% Day Change: -1.12 | |
| Week Change: -4.09008% Year-to-date Change: -8.0% | |
| LPX Links: Profile News Message Board | |
| Charts:- Daily , Weekly | |
| Add LPX to Watchlist: View: Get Complete LPX Trend Analysis ➞ | |
 | AAXN Axon Enterprise, Inc. |
| Sector: Industrials | |
| SubSector: Aerospace/Defense Products & Services | |
| MarketCap: 3857.41 Millions | |
| Recent Price: 58.81 Smart Investing & Trading Score: 10 | |
| Day Percent Change: -1.00993% Day Change: -9999 | |
| Week Change: -15.8535% Year-to-date Change: 0.0% | |
| AAXN Links: Profile News Message Board | |
| Charts:- Daily , Weekly | |
| Add AAXN to Watchlist: View: Get Complete AAXN Trend Analysis ➞ | |
 | TRI Thomson-Reuters Corp |
| Sector: Industrials | |
| SubSector: Specialty Business Services | |
| MarketCap: 78671.8 Millions | |
| Recent Price: 171.22 Smart Investing & Trading Score: 20 | |
| Day Percent Change: -1.02318% Day Change: 0.32 | |
| Week Change: -1.95831% Year-to-date Change: 6.9% | |
| TRI Links: Profile News Message Board | |
| Charts:- Daily , Weekly | |
| Add TRI to Watchlist: View: Get Complete TRI Trend Analysis ➞ | |
 | MYRG MYR Group Inc |
| Sector: Industrials | |
| SubSector: Engineering & Construction | |
| MarketCap: 2792.25 Millions | |
| Recent Price: 173.81 Smart Investing & Trading Score: 0 | |
| Day Percent Change: -1.03063% Day Change: 1.55 | |
| Week Change: -3.37447% Year-to-date Change: 17.5% | |
| MYRG Links: Profile News Message Board | |
| Charts:- Daily , Weekly | |
| Add MYRG to Watchlist: View: Get Complete MYRG Trend Analysis ➞ | |
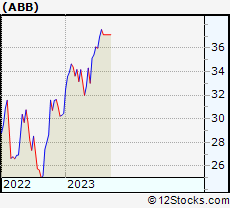 | ABB ABB Ltd |
| Sector: Industrials | |
| SubSector: Diversified Machinery | |
| MarketCap: 39187.2 Millions | |
| Recent Price: 40.54 Smart Investing & Trading Score: 60 | |
| Day Percent Change: -1.04955% Day Change: -9999 | |
| Week Change: 9.18395% Year-to-date Change: 0.0% | |
| ABB Links: Profile News Message Board | |
| Charts:- Daily , Weekly | |
| Add ABB to Watchlist: View: Get Complete ABB Trend Analysis ➞ | |
 | DCO Ducommun Inc |
| Sector: Industrials | |
| SubSector: Aerospace & Defense | |
| MarketCap: 1349.85 Millions | |
| Recent Price: 92.04 Smart Investing & Trading Score: 60 | |
| Day Percent Change: -1.06417% Day Change: 1.54 | |
| Week Change: 1.75788% Year-to-date Change: 44.7% | |
| DCO Links: Profile News Message Board | |
| Charts:- Daily , Weekly | |
| Add DCO to Watchlist: View: Get Complete DCO Trend Analysis ➞ | |
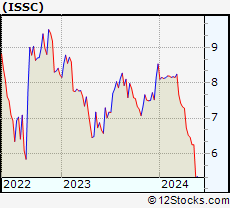 | ISSC Innovative Solutions And Support Inc |
| Sector: Industrials | |
| SubSector: Aerospace & Defense | |
| MarketCap: 204.84 Millions | |
| Recent Price: 11.03 Smart Investing & Trading Score: 10 | |
| Day Percent Change: -1.07623% Day Change: 0.32 | |
| Week Change: -8.91825% Year-to-date Change: 27.7% | |
| ISSC Links: Profile News Message Board | |
| Charts:- Daily , Weekly | |
| Add ISSC to Watchlist: View: Get Complete ISSC Trend Analysis ➞ | |
 | HURC Hurco Companies, Inc |
| Sector: Industrials | |
| SubSector: Specialty Industrial Machinery | |
| MarketCap: 116.67 Millions | |
| Recent Price: 17.55 Smart Investing & Trading Score: 40 | |
| Day Percent Change: -1.12676% Day Change: -0.2 | |
| Week Change: -2.11935% Year-to-date Change: -11.3% | |
| HURC Links: Profile News Message Board | |
| Charts:- Daily , Weekly | |
| Add HURC to Watchlist: View: Get Complete HURC Trend Analysis ➞ | |
 | LECO Lincoln Electric Holdings, Inc |
| Sector: Industrials | |
| SubSector: Tools & Accessories | |
| MarketCap: 13483.1 Millions | |
| Recent Price: 236.40 Smart Investing & Trading Score: 30 | |
| Day Percent Change: -1.14164% Day Change: -2.18 | |
| Week Change: -3.24165% Year-to-date Change: 28.9% | |
| LECO Links: Profile News Message Board | |
| Charts:- Daily , Weekly | |
| Add LECO to Watchlist: View: Get Complete LECO Trend Analysis ➞ | |
 | JBHT J.B. Hunt Transport Services, Inc |
| Sector: Industrials | |
| SubSector: Integrated Freight & Logistics | |
| MarketCap: 13913 Millions | |
| Recent Price: 136.35 Smart Investing & Trading Score: 10 | |
| Day Percent Change: -1.14551% Day Change: -1.98 | |
| Week Change: -5.13463% Year-to-date Change: -19.6% | |
| JBHT Links: Profile News Message Board | |
| Charts:- Daily , Weekly | |
| Add JBHT to Watchlist: View: Get Complete JBHT Trend Analysis ➞ | |
 | ESLT Elbit Systems Ltd |
| Sector: Industrials | |
| SubSector: Aerospace & Defense | |
| MarketCap: 22342.6 Millions | |
| Recent Price: 503.42 Smart Investing & Trading Score: 70 | |
| Day Percent Change: -1.20108% Day Change: 2.3 | |
| Week Change: 4.43532% Year-to-date Change: 92.4% | |
| ESLT Links: Profile News Message Board | |
| Charts:- Daily , Weekly | |
| Add ESLT to Watchlist: View: Get Complete ESLT Trend Analysis ➞ | |
 | KBR KBR Inc |
| Sector: Industrials | |
| SubSector: Engineering & Construction | |
| MarketCap: 6398.28 Millions | |
| Recent Price: 48.78 Smart Investing & Trading Score: 30 | |
| Day Percent Change: -1.23507% Day Change: -0.43 | |
| Week Change: -1.77205% Year-to-date Change: -15.2% | |
| KBR Links: Profile News Message Board | |
| Charts:- Daily , Weekly | |
| Add KBR to Watchlist: View: Get Complete KBR Trend Analysis ➞ | |
 | TH Target Hospitality Corp |
| Sector: Industrials | |
| SubSector: Specialty Business Services | |
| MarketCap: 876.06 Millions | |
| Recent Price: 8.72 Smart Investing & Trading Score: 50 | |
| Day Percent Change: -1.24575% Day Change: -0.15 | |
| Week Change: -0.683371% Year-to-date Change: -10.0% | |
| TH Links: Profile News Message Board | |
| Charts:- Daily , Weekly | |
| Add TH to Watchlist: View: Get Complete TH Trend Analysis ➞ | |
 | RHI Robert Half Inc |
| Sector: Industrials | |
| SubSector: Staffing & Employment Services | |
| MarketCap: 3767.38 Millions | |
| Recent Price: 34.98 Smart Investing & Trading Score: 20 | |
| Day Percent Change: -1.29797% Day Change: -0.33 | |
| Week Change: -5.53605% Year-to-date Change: -47.8% | |
| RHI Links: Profile News Message Board | |
| Charts:- Daily , Weekly | |
| Add RHI to Watchlist: View: Get Complete RHI Trend Analysis ➞ | |
 | CTAS Cintas Corporation |
| Sector: Industrials | |
| SubSector: Specialty Business Services | |
| MarketCap: 82409 Millions | |
| Recent Price: 199.71 Smart Investing & Trading Score: 0 | |
| Day Percent Change: -1.31442% Day Change: -2.27 | |
| Week Change: -2.3423% Year-to-date Change: 10.1% | |
| CTAS Links: Profile News Message Board | |
| Charts:- Daily , Weekly | |
| Add CTAS to Watchlist: View: Get Complete CTAS Trend Analysis ➞ | |
 | PAC Grupo Aeroportuario Del Pacifico SAB de CV ADR |
| Sector: Industrials | |
| SubSector: Airports & Air Services | |
| MarketCap: 10734.5 Millions | |
| Recent Price: 251.21 Smart Investing & Trading Score: 60 | |
| Day Percent Change: -1.37024% Day Change: -2.74 | |
| Week Change: 0.512143% Year-to-date Change: 40.8% | |
| PAC Links: Profile News Message Board | |
| Charts:- Daily , Weekly | |
| Add PAC to Watchlist: View: Get Complete PAC Trend Analysis ➞ | |
| For tabular summary view of above stock list: Summary View ➞ 0 - 25 , 25 - 50 , 50 - 75 , 75 - 100 , 100 - 125 , 125 - 150 , 150 - 175 , 175 - 200 , 200 - 225 , 225 - 250 , 250 - 275 , 275 - 300 , 300 - 325 , 325 - 350 , 350 - 375 , 375 - 400 , 400 - 425 , 425 - 450 , 450 - 475 , 475 - 500 , 500 - 525 | ||
| Click To Change The Sort Order: By Market Cap or Company Size Performance: Year-to-date, Week and Day | |
| Select Chart Type: | ||
|
Best Stocks Today 12Stocks.com |
© 2025 12Stocks.com Terms & Conditions Privacy Contact Us
All Information Provided Only For Education And Not To Be Used For Investing or Trading. See Terms & Conditions


One More Thing ... Get Best Stocks Delivered Daily!
Never Ever Miss A Move With Our Top Ten Stocks Lists
Find Best Stocks In Any Market - Bull or Bear Market
Take A Peek At Our Top Ten Stocks Lists: Daily, Weekly, Year-to-Date & Top Trends
Find Best Stocks In Any Market - Bull or Bear Market
Take A Peek At Our Top Ten Stocks Lists: Daily, Weekly, Year-to-Date & Top Trends
Industrial Stocks With Best Up Trends [0-bearish to 100-bullish]: Brooge [100], Babcock & Wilcox Enterprises[100], Radiant Logistics[100], Ameresco [100], Ardmore Shipping[100], TAT Technologies[100], Powell Industries[100], Ballard Power[100], NAPCO Security[100], Comfort Systems[100], PICO [100]
Best Industrial Stocks Year-to-Date:
Triumph [1388.91%], GrafTech [509.884%], Tecogen [486.452%], Power [226.805%], Lightbridge Corp[205.49%], Bloom Energy[186.778%], ESGL [170.593%], Kratos Defense[168.158%], Tutor Perini[165.811%], Willdan [162.049%], Astronics Corp[153.325%] Best Industrial Stocks This Week:
TRC [10149.1%], Advanced Emissions[3571.78%], L3 Technologies[1915.25%], Forterra [1845.47%], KLX [437.488%], Allegro Merger[402.182%], LMI Aerospace[291.621%], Chicago Bridge[205.472%], Covanta Holding[148.617%], MOOG [148.377%], Altra [103.372%] Best Industrial Stocks Daily:
Brooge [29.5547%], Enovix [12.285%], Lightbridge Corp[11.5247%], Tecogen [10.989%], B/E Aerospace[8.86381%], Symbotic [7.62304%], NuScale Power[7.56742%], Zim Integrated[7.26339%], Babcock & Wilcox Enterprises[6.11511%], Radiant Logistics[5.52147%], Graham Corp[5.27823%]