
 Login Sign Up


| |||||
 |  | ||||

| 12Stocks.com Market Intelligence |
Best Industrial Stocks
| In a hurry? Industrial Stocks Lists: Performance Trends Table, Stock Charts
Sort Industrial stocks: Daily, Weekly, Year-to-Date, Market Cap & Trends. Filter Industrial stocks list by size:All Industrial Large Mid-Range Small |
| 12Stocks.com Industrial Stocks Performances & Trends Daily | |||||||||
|
|  The overall Smart Investing & Trading Score is 56 (0-bearish to 100-bullish) which puts Industrial sector in short term neutral trend. The Smart Investing & Trading Score from previous trading session is 63 and hence a deterioration of trend.
| ||||||||
Here are the Smart Investing & Trading Scores of the most requested Industrial stocks at 12Stocks.com (click stock name for detailed review):
|


| 12Stocks.com: Investing in Industrial sector with Stocks | |
|
The following table helps investors and traders sort through current performance and trends (as measured by Smart Investing & Trading Score) of various
stocks in the Industrial sector. Quick View: Move mouse or cursor over stock symbol (ticker) to view short-term Technical chart and over stock name to view long term chart. Click on  to add stock symbol to your watchlist and to add stock symbol to your watchlist and  to view watchlist. Click on any ticker or stock name for detailed market intelligence report for that stock. to view watchlist. Click on any ticker or stock name for detailed market intelligence report for that stock. |
12Stocks.com Performance of Stocks in Industrial Sector
| Ticker | Stock Name | Watchlist | Category | Recent Price | Smart Investing & Trading Score | Change % | YTD Change% |
| NPK | National Presto |   | Aerospace/Defense | 83.39 | 93 | -0.06 | 3.87% |
| TDG | TransDigm | | Aerospace/Defense | 1241.62 | 78 | -0.06 | 22.74% |
| ESLT | Elbit Systems | | Aerospace/Defense | 203.09 | 42 | -0.06 | -4.76% |
| TGLS | Tecnoglass | | Building Materials | 55.90 | 73 | -0.07 | 22.29% |
| USLM | United States | | Building Materials | 304.00 | 68 | -0.09 | 31.97% |
| PCH | PotlatchDeltic | | Lumber, Wood | 41.41 | 25 | -0.10 | -15.66% |
| CMI | Cummins | | Machinery | 292.34 | 68 | -0.12 | 22.03% |
| EXP | Eagle Materials | | Cement | 253.13 | 58 | -0.13 | 24.79% |
| EMR | Emerson Electric | | Electrical Equipment | 109.62 | 68 | -0.14 | 12.63% |
| CRS | Carpenter Technology | | Fabrication | 80.40 | 90 | -0.14 | 13.56% |
| FLR | Fluor | | Heavy Construction | 40.30 | 63 | -0.17 | 2.88% |
| BIOX | Bioceres Crop | | Conglomerates | 11.92 | 10 | -0.17 | -13.18% |
| HAYN | Haynes | | Fabrication | 60.36 | 68 | -0.18 | 5.80% |
| GENC | Gencor Industries | | Machinery | 16.88 | 54 | -0.18 | 4.58% |
| GGG | Graco | | Machinery | 89.35 | 58 | -0.19 | 2.99% |
| NPO | EnPro Industries | | Equipment | 151.03 | 58 | -0.19 | -3.64% |
| LMT | Lockheed Martin | | Aerospace/Defense | 459.14 | 63 | -0.20 | 1.30% |
| AVAV | AeroVironment | | Aerospace/Defense | 157.99 | 100 | -0.20 | 25.35% |
| RBCP | RBC Bearings | | Tools & Accessories | 113.23 | 25 | -0.22 | -12.70% |
| TWIN | Twin Disc | | Machinery | 16.50 | 26 | -0.24 | 2.10% |
| HAYW | Hayward | | Electrical Equipment & Parts | 13.66 | 58 | -0.26 | 0.40% |
| CW | Curtiss-Wright | | Machinery | 252.64 | 75 | -0.27 | 13.40% |
| ROK | Rockwell Automation | | Machinery | 275.56 | 58 | -0.28 | -11.25% |
| ADSE | ADS-TEC Energy | | Electrical Equipment & Parts | 10.75 | 58 | -0.28 | 50.77% |
| BLDR | Builders FirstSource | | Building Materials | 186.69 | 65 | -0.29 | 11.83% |
| For chart view version of above stock list: Chart View ➞ 0 - 25 , 25 - 50 , 50 - 75 , 75 - 100 , 100 - 125 , 125 - 150 , 150 - 175 , 175 - 200 , 200 - 225 , 225 - 250 , 250 - 275 , 275 - 300 | ||
 | Click To Change The Sort Order: By Market Cap or Company Size Performance: Year-to-date, Week and Day |  |
|
Get the most comprehensive stock market coverage daily at 12Stocks.com ➞ Best Stocks Today ➞ Best Stocks Weekly ➞ Best Stocks Year-to-Date ➞ Best Stocks Trends ➞  Best Stocks Today 12Stocks.com Best Nasdaq Stocks ➞ Best S&P 500 Stocks ➞ Best Tech Stocks ➞ Best Biotech Stocks ➞ |
| Detailed Overview of Industrial Stocks |
| Industrial Technical Overview, Leaders & Laggards, Top Industrial ETF Funds & Detailed Industrial Stocks List, Charts, Trends & More |
| Industrial Sector: Technical Analysis, Trends & YTD Performance | |
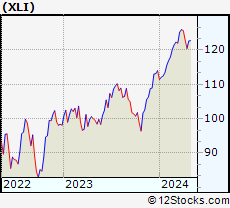
| Industrial sector is composed of stocks
from industrial machinery, aerospace, defense, farm/construction
and industrial services subsectors. Industrial sector, as represented by XLI, an exchange-traded fund [ETF] that holds basket of Industrial stocks (e.g, Caterpillar, Boeing) is up by 7.11% and is currently outperforming the overall market by 1.45% year-to-date. Below is a quick view of Technical charts and trends: |
|
 XLI Weekly Chart |
|
| Long Term Trend: Very Good | |
| Medium Term Trend: Not Good | |
 XLI Daily Chart |
|
| Short Term Trend: Very Good | |
| Overall Trend Score: 56 | |
| YTD Performance: 7.11% | |
| **Trend Scores & Views Are Only For Educational Purposes And Not For Investing | |
| 12Stocks.com: Top Performing Industrial Sector Stocks | ||||||||||||||||||||||||||||||||||||||||||||||||
 The top performing Industrial sector stocks year to date are
Now, more recently, over last week, the top performing Industrial sector stocks on the move are


|
||||||||||||||||||||||||||||||||||||||||||||||||
| 12Stocks.com: Investing in Industrial Sector using Exchange Traded Funds | |
|
The following table shows list of key exchange traded funds (ETF) that
help investors track Industrial Index. For detailed view, check out our ETF Funds section of our website. Quick View: Move mouse or cursor over ETF symbol (ticker) to view short-term Technical chart and over ETF name to view long term chart. Click on ticker or stock name for detailed view. Click on to add stock symbol to your watchlist and to view watchlist. |
12Stocks.com List of ETFs that track Industrial Index
| Ticker | ETF Name | Watchlist | Recent Price | Smart Investing & Trading Score | Change % | Week % | Year-to-date % |
| XLI | Industrial | | 122.09 | 56 | -0.80 | 1.34 | 7.11% |
| UXI | Industrials | | 32.00 | 56 | -2.85 | 1.43 | 11.13% |
| PPA | Aerospace & Defense | | 99.78 | 63 | -0.67 | 1.5 | 8.27% |
| ITA | Aerospace & Defense | | 128.51 | 56 | -0.66 | 0.4 | 1.51% |
| ITB | Home Construction | | 104.74 | 58 | -1.18 | 2.33 | 2.96% |
| XHB | Homebuilders | | 102.63 | 58 | -0.96 | 2.47 | 7.29% |
| SIJ | Short Industrials | | 9.96 | 32 | 1.22 | -2.67 | -12.17% |
| IYJ | Industrials | | 121.23 | 41 | -0.57 | 1.52 | 6.01% |
| EXI | Global Industrials | | 135.26 | 41 | -0.69 | 1.68 | 6.14% |
| VIS | Industrials | | 235.54 | 46 | -0.69 | 1.44 | 6.85% |
| PSCI | SmallCap Industrials | | 121.29 | 56 | -0.76 | 2.06 | 4.6% |
| XAR | Aerospace & Defense | | 134.64 | 43 | -0.39 | 1.82 | -0.58% |
| ARKQ | ARK Industrial Innovation | | 51.70 | 17 | 1.27 | 3.69 | -10.4% |
| 12Stocks.com: Charts, Trends, Fundamental Data and Performances of Industrial Stocks | |
|
We now take in-depth look at all Industrial stocks including charts, multi-period performances and overall trends (as measured by Smart Investing & Trading Score). One can sort Industrial stocks (click link to choose) by Daily, Weekly and by Year-to-Date performances. Also, one can sort by size of the company or by market capitalization. |
| Select Your Default Chart Type: | |||||
| |||||
| Click on stock symbol or name for detailed view. Click on to add stock symbol to your watchlist and to view watchlist. Quick View: Move mouse or cursor over "Daily" to quickly view daily Technical stock chart and over "Weekly" to view weekly Technical stock chart. | |||||

 | NPK National Presto Industries, Inc. |
| Sector: Industrials | |
| SubSector: Aerospace/Defense Products & Services | |
| MarketCap: 540.401 Millions | |
| Recent Price: 83.39 Smart Investing & Trading Score: 93 | |
| Day Percent Change: -0.06% Day Change: -0.05 | |
| Week Change: 2.19% Year-to-date Change: 3.9% | |
| NPK Links: Profile News Message Board | |
| Charts:- Daily , Weekly | |
| Add NPK to Watchlist: View: Get Complete NPK Trend Analysis ➞ | |
 | TDG TransDigm Group Incorporated |
| Sector: Industrials | |
| SubSector: Aerospace/Defense Products & Services | |
| MarketCap: 18441 Millions | |
| Recent Price: 1241.62 Smart Investing & Trading Score: 78 | |
| Day Percent Change: -0.06% Day Change: -0.78 | |
| Week Change: 4.54% Year-to-date Change: 22.7% | |
| TDG Links: Profile News Message Board | |
| Charts:- Daily , Weekly | |
| Add TDG to Watchlist: View: Get Complete TDG Trend Analysis ➞ | |
 | ESLT Elbit Systems Ltd. |
| Sector: Industrials | |
| SubSector: Aerospace/Defense Products & Services | |
| MarketCap: 5770.01 Millions | |
| Recent Price: 203.09 Smart Investing & Trading Score: 42 | |
| Day Percent Change: -0.06% Day Change: -0.12 | |
| Week Change: 0.79% Year-to-date Change: -4.8% | |
| ESLT Links: Profile News Message Board | |
| Charts:- Daily , Weekly | |
| Add ESLT to Watchlist: View: Get Complete ESLT Trend Analysis ➞ | |
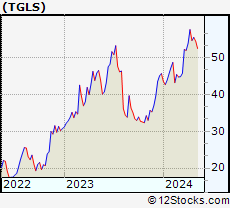 | TGLS Tecnoglass Inc. |
| Sector: Industrials | |
| SubSector: General Building Materials | |
| MarketCap: 135.853 Millions | |
| Recent Price: 55.90 Smart Investing & Trading Score: 73 | |
| Day Percent Change: -0.07% Day Change: -0.04 | |
| Week Change: 2.18% Year-to-date Change: 22.3% | |
| TGLS Links: Profile News Message Board | |
| Charts:- Daily , Weekly | |
| Add TGLS to Watchlist: View: Get Complete TGLS Trend Analysis ➞ | |
 | USLM United States Lime & Minerals, Inc. |
| Sector: Industrials | |
| SubSector: General Building Materials | |
| MarketCap: 427.653 Millions | |
| Recent Price: 304.00 Smart Investing & Trading Score: 68 | |
| Day Percent Change: -0.09% Day Change: -0.28 | |
| Week Change: 2.44% Year-to-date Change: 32.0% | |
| USLM Links: Profile News Message Board | |
| Charts:- Daily , Weekly | |
| Add USLM to Watchlist: View: Get Complete USLM Trend Analysis ➞ | |
 | PCH PotlatchDeltic Corporation |
| Sector: Industrials | |
| SubSector: Lumber, Wood Production | |
| MarketCap: 2314.68 Millions | |
| Recent Price: 41.41 Smart Investing & Trading Score: 25 | |
| Day Percent Change: -0.10% Day Change: -0.04 | |
| Week Change: 0.53% Year-to-date Change: -15.7% | |
| PCH Links: Profile News Message Board | |
| Charts:- Daily , Weekly | |
| Add PCH to Watchlist: View: Get Complete PCH Trend Analysis ➞ | |
 | CMI Cummins Inc. |
| Sector: Industrials | |
| SubSector: Diversified Machinery | |
| MarketCap: 19127.1 Millions | |
| Recent Price: 292.34 Smart Investing & Trading Score: 68 | |
| Day Percent Change: -0.12% Day Change: -0.36 | |
| Week Change: 1.66% Year-to-date Change: 22.0% | |
| CMI Links: Profile News Message Board | |
| Charts:- Daily , Weekly | |
| Add CMI to Watchlist: View: Get Complete CMI Trend Analysis ➞ | |
 | EXP Eagle Materials Inc. |
| Sector: Industrials | |
| SubSector: Cement | |
| MarketCap: 2234.73 Millions | |
| Recent Price: 253.13 Smart Investing & Trading Score: 58 | |
| Day Percent Change: -0.13% Day Change: -0.32 | |
| Week Change: 6.27% Year-to-date Change: 24.8% | |
| EXP Links: Profile News Message Board | |
| Charts:- Daily , Weekly | |
| Add EXP to Watchlist: View: Get Complete EXP Trend Analysis ➞ | |
 | EMR Emerson Electric Co. |
| Sector: Industrials | |
| SubSector: Industrial Electrical Equipment | |
| MarketCap: 30457.9 Millions | |
| Recent Price: 109.62 Smart Investing & Trading Score: 68 | |
| Day Percent Change: -0.14% Day Change: -0.15 | |
| Week Change: 0.96% Year-to-date Change: 12.6% | |
| EMR Links: Profile News Message Board | |
| Charts:- Daily , Weekly | |
| Add EMR to Watchlist: View: Get Complete EMR Trend Analysis ➞ | |
 | CRS Carpenter Technology Corporation |
| Sector: Industrials | |
| SubSector: Metal Fabrication | |
| MarketCap: 853.35 Millions | |
| Recent Price: 80.40 Smart Investing & Trading Score: 90 | |
| Day Percent Change: -0.14% Day Change: -0.11 | |
| Week Change: 3.02% Year-to-date Change: 13.6% | |
| CRS Links: Profile News Message Board | |
| Charts:- Daily , Weekly | |
| Add CRS to Watchlist: View: Get Complete CRS Trend Analysis ➞ | |
 | FLR Fluor Corporation |
| Sector: Industrials | |
| SubSector: Heavy Construction | |
| MarketCap: 891.495 Millions | |
| Recent Price: 40.30 Smart Investing & Trading Score: 63 | |
| Day Percent Change: -0.17% Day Change: -0.07 | |
| Week Change: 2.78% Year-to-date Change: 2.9% | |
| FLR Links: Profile News Message Board | |
| Charts:- Daily , Weekly | |
| Add FLR to Watchlist: View: Get Complete FLR Trend Analysis ➞ | |
 | BIOX Bioceres Crop Solutions Corp. |
| Sector: Industrials | |
| SubSector: Conglomerates | |
| MarketCap: 198.348 Millions | |
| Recent Price: 11.92 Smart Investing & Trading Score: 10 | |
| Day Percent Change: -0.17% Day Change: -0.02 | |
| Week Change: -1.69% Year-to-date Change: -13.2% | |
| BIOX Links: Profile News Message Board | |
| Charts:- Daily , Weekly | |
| Add BIOX to Watchlist: View: Get Complete BIOX Trend Analysis ➞ | |
 | HAYN Haynes International, Inc. |
| Sector: Industrials | |
| SubSector: Metal Fabrication | |
| MarketCap: 245.75 Millions | |
| Recent Price: 60.36 Smart Investing & Trading Score: 68 | |
| Day Percent Change: -0.18% Day Change: -0.11 | |
| Week Change: 0.18% Year-to-date Change: 5.8% | |
| HAYN Links: Profile News Message Board | |
| Charts:- Daily , Weekly | |
| Add HAYN to Watchlist: View: Get Complete HAYN Trend Analysis ➞ | |
 | GENC Gencor Industries, Inc. |
| Sector: Industrials | |
| SubSector: Farm & Construction Machinery | |
| MarketCap: 147.607 Millions | |
| Recent Price: 16.88 Smart Investing & Trading Score: 54 | |
| Day Percent Change: -0.18% Day Change: -0.03 | |
| Week Change: -1.06% Year-to-date Change: 4.6% | |
| GENC Links: Profile News Message Board | |
| Charts:- Daily , Weekly | |
| Add GENC to Watchlist: View: Get Complete GENC Trend Analysis ➞ | |
 | GGG Graco Inc. |
| Sector: Industrials | |
| SubSector: Diversified Machinery | |
| MarketCap: 7739.76 Millions | |
| Recent Price: 89.35 Smart Investing & Trading Score: 58 | |
| Day Percent Change: -0.19% Day Change: -0.17 | |
| Week Change: 1.1% Year-to-date Change: 3.0% | |
| GGG Links: Profile News Message Board | |
| Charts:- Daily , Weekly | |
| Add GGG to Watchlist: View: Get Complete GGG Trend Analysis ➞ | |
 | NPO EnPro Industries, Inc. |
| Sector: Industrials | |
| SubSector: Industrial Equipment & Components | |
| MarketCap: 734.309 Millions | |
| Recent Price: 151.03 Smart Investing & Trading Score: 58 | |
| Day Percent Change: -0.19% Day Change: -0.28 | |
| Week Change: 1.35% Year-to-date Change: -3.6% | |
| NPO Links: Profile News Message Board | |
| Charts:- Daily , Weekly | |
| Add NPO to Watchlist: View: Get Complete NPO Trend Analysis ➞ | |
 | LMT Lockheed Martin Corporation |
| Sector: Industrials | |
| SubSector: Aerospace/Defense Products & Services | |
| MarketCap: 94116.4 Millions | |
| Recent Price: 459.14 Smart Investing & Trading Score: 63 | |
| Day Percent Change: -0.20% Day Change: -0.94 | |
| Week Change: -1.02% Year-to-date Change: 1.3% | |
| LMT Links: Profile News Message Board | |
| Charts:- Daily , Weekly | |
| Add LMT to Watchlist: View: Get Complete LMT Trend Analysis ➞ | |
 | AVAV AeroVironment, Inc. |
| Sector: Industrials | |
| SubSector: Aerospace/Defense Products & Services | |
| MarketCap: 1502.41 Millions | |
| Recent Price: 157.99 Smart Investing & Trading Score: 100 | |
| Day Percent Change: -0.20% Day Change: -0.31 | |
| Week Change: 5.31% Year-to-date Change: 25.4% | |
| AVAV Links: Profile News Message Board | |
| Charts:- Daily , Weekly | |
| Add AVAV to Watchlist: View: Get Complete AVAV Trend Analysis ➞ | |
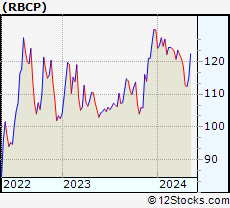 | RBCP RBC Bearings Incorporated |
| Sector: Industrials | |
| SubSector: Tools & Accessories | |
| MarketCap: 6310 Millions | |
| Recent Price: 113.23 Smart Investing & Trading Score: 25 | |
| Day Percent Change: -0.22% Day Change: -0.25 | |
| Week Change: 0.48% Year-to-date Change: -12.7% | |
| RBCP Links: Profile News Message Board | |
| Charts:- Daily , Weekly | |
| Add RBCP to Watchlist: View: Get Complete RBCP Trend Analysis ➞ | |
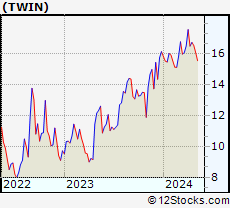 | TWIN Twin Disc, Incorporated |
| Sector: Industrials | |
| SubSector: Diversified Machinery | |
| MarketCap: 120.416 Millions | |
| Recent Price: 16.50 Smart Investing & Trading Score: 26 | |
| Day Percent Change: -0.24% Day Change: -0.04 | |
| Week Change: -1.55% Year-to-date Change: 2.1% | |
| TWIN Links: Profile News Message Board | |
| Charts:- Daily , Weekly | |
| Add TWIN to Watchlist: View: Get Complete TWIN Trend Analysis ➞ | |
 | HAYW Hayward Holdings, Inc. |
| Sector: Industrials | |
| SubSector: Electrical Equipment & Parts | |
| MarketCap: 2670 Millions | |
| Recent Price: 13.66 Smart Investing & Trading Score: 58 | |
| Day Percent Change: -0.26% Day Change: -0.04 | |
| Week Change: 3.44% Year-to-date Change: 0.4% | |
| HAYW Links: Profile News Message Board | |
| Charts:- Daily , Weekly | |
| Add HAYW to Watchlist: View: Get Complete HAYW Trend Analysis ➞ | |
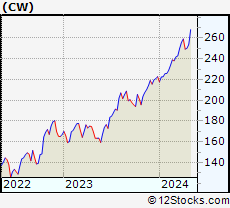 | CW Curtiss-Wright Corporation |
| Sector: Industrials | |
| SubSector: Diversified Machinery | |
| MarketCap: 4057.56 Millions | |
| Recent Price: 252.64 Smart Investing & Trading Score: 75 | |
| Day Percent Change: -0.27% Day Change: -0.68 | |
| Week Change: 0.96% Year-to-date Change: 13.4% | |
| CW Links: Profile News Message Board | |
| Charts:- Daily , Weekly | |
| Add CW to Watchlist: View: Get Complete CW Trend Analysis ➞ | |
 | ROK Rockwell Automation, Inc. |
| Sector: Industrials | |
| SubSector: Diversified Machinery | |
| MarketCap: 15666.1 Millions | |
| Recent Price: 275.56 Smart Investing & Trading Score: 58 | |
| Day Percent Change: -0.28% Day Change: -0.77 | |
| Week Change: 2.07% Year-to-date Change: -11.3% | |
| ROK Links: Profile News Message Board | |
| Charts:- Daily , Weekly | |
| Add ROK to Watchlist: View: Get Complete ROK Trend Analysis ➞ | |
 | ADSE ADS-TEC Energy PLC |
| Sector: Industrials | |
| SubSector: Electrical Equipment & Parts | |
| MarketCap: 329 Millions | |
| Recent Price: 10.75 Smart Investing & Trading Score: 58 | |
| Day Percent Change: -0.28% Day Change: -0.03 | |
| Week Change: -0.46% Year-to-date Change: 50.8% | |
| ADSE Links: Profile News Message Board | |
| Charts:- Daily , Weekly | |
| Add ADSE to Watchlist: View: Get Complete ADSE Trend Analysis ➞ | |
 | BLDR Builders FirstSource, Inc. |
| Sector: Industrials | |
| SubSector: General Building Materials | |
| MarketCap: 1714.63 Millions | |
| Recent Price: 186.69 Smart Investing & Trading Score: 65 | |
| Day Percent Change: -0.29% Day Change: -0.55 | |
| Week Change: 5.46% Year-to-date Change: 11.8% | |
| BLDR Links: Profile News Message Board | |
| Charts:- Daily , Weekly | |
| Add BLDR to Watchlist: View: Get Complete BLDR Trend Analysis ➞ | |
| For tabular summary view of above stock list: Summary View ➞ 0 - 25 , 25 - 50 , 50 - 75 , 75 - 100 , 100 - 125 , 125 - 150 , 150 - 175 , 175 - 200 , 200 - 225 , 225 - 250 , 250 - 275 , 275 - 300 | ||
| Click To Change The Sort Order: By Market Cap or Company Size Performance: Year-to-date, Week and Day | |
| Select Chart Type: | ||
|
Best Stocks Today 12Stocks.com |
© 2024 12Stocks.com Terms & Conditions Privacy Contact Us
All Information Provided Only For Education And Not To Be Used For Investing or Trading. See Terms & Conditions


One More Thing ... Get Best Stocks Delivered Daily!
Never Ever Miss A Move With Our Top Ten Stocks Lists
Find Best Stocks In Any Market - Bull or Bear Market
Take A Peek At Our Top Ten Stocks Lists: Daily, Weekly, Year-to-Date & Top Trends
Find Best Stocks In Any Market - Bull or Bear Market
Take A Peek At Our Top Ten Stocks Lists: Daily, Weekly, Year-to-Date & Top Trends
Industrial Stocks With Best Up Trends [0-bearish to 100-bullish]: Caesarstone [100], Crane Co[100], Mueller Industries[100], Generac [100], Mueller Water[100], AAR [100], Northrop Grumman[100], AeroVironment [100], AZZ [100], Powell Industries[95], NET Power[95]
Best Industrial Stocks Year-to-Date:
Intuitive Machines[121.6%], FTAI Infrastructure[91.26%], Caesarstone [79.95%], NuScale Power[72.09%], Powell Industries[68.81%], IES [62.47%], EMCOR [57.31%], Masonite [55.45%], Tutor Perini[52.86%], ADS-TEC Energy[50.77%], Comfort Systems[50.09%] Best Industrial Stocks This Week:
Caesarstone [18.28%], BiomX [14.8%], Powell Industries[14.49%], NuScale Power[14.43%], ZIM Integrated[13.72%], FTAI Infrastructure[11.54%], IES [11.43%], Aspen Aerogels[11.23%], Mueller Industries[10.86%], M/I Homes[10.2%], AZZ [10.2%] Best Industrial Stocks Daily:
Hertz Global[6.23%], Freightos [6.20%], Novonix [5.52%], GrafTech [5.10%], Satellogic [4.17%], Powell Industries[4.07%], Caesarstone [4.02%], MingZhu Logistics[2.95%], Crane Co[2.91%], M/I Homes[2.47%], Bridger Aerospace[2.27%]