
 Login Sign Up


| |||||
 |  | ||||

| 12Stocks.com Market Intelligence |
Best Industrial Stocks
| In a hurry? Industrial Stocks Lists: Performance Trends Table, Stock Charts
Sort Industrial stocks: Daily, Weekly, Year-to-Date, Market Cap & Trends. Filter Industrial stocks list by size:All Industrial Large Mid-Range Small |
| 12Stocks.com Industrial Stocks Performances & Trends Daily | |||||||||
|
|  The overall Smart Investing & Trading Score is 20 (0-bearish to 100-bullish) which puts Industrial sector in short term bearish trend. The Smart Investing & Trading Score from previous trading session is 60 and hence a deterioration of trend.
| ||||||||
Here are the Smart Investing & Trading Scores of the most requested Industrial stocks at 12Stocks.com (click stock name for detailed review):
|


| 12Stocks.com: Investing in Industrial sector with Stocks | |
|
The following table helps investors and traders sort through current performance and trends (as measured by Smart Investing & Trading Score) of various
stocks in the Industrial sector. Quick View: Move mouse or cursor over stock symbol (ticker) to view short-term Technical chart and over stock name to view long term chart. Click on  to add stock symbol to your watchlist and to add stock symbol to your watchlist and  to view watchlist. Click on any ticker or stock name for detailed market intelligence report for that stock. to view watchlist. Click on any ticker or stock name for detailed market intelligence report for that stock. |
12Stocks.com Performance of Stocks in Industrial Sector
| Ticker | Stock Name | Watchlist | Category | Recent Price | Smart Investing & Trading Score | Change % | Weekly Change% |
| DAC | Danaos |   | Marine Shipping | 94.93 | 50 | 0.30% | -1.26% |
| MG | Mistras | | Security & Protection | 9.41 | 30 | -1.16% | -1.26% |
| TH | Target Hospitality | | Specialty | 8.60 | 30 | -0.81% | -1.26% |
| HXL | Hexcel Corp | | Aerospace & Defense | 62.06 | 40 | -0.94% | -1.27% |
| MAS | Masco Corp | | Building Products & Equipment | 72.47 | 30 | -1.13% | -1.33% |
| JBLU | Jetblue Airways | | Airlines | 5.07 | 70 | 0.00% | -1.36% |
| DE | Deere & Co | | Farm & Heavy Construction Machinery | 469.12 | 10 | 0.09% | -1.36% |
| RADA | RADA Electronic | | Aerospace/Defense | 12.84 | 30 | -2.06% | -1.46% |
| IEX | Idex | | Specialty Industrial Machinery | 159.59 | 10 | -2.59% | -1.47% |
| BAH | Booz Allen | | Consulting | 101.58 | 20 | -0.25% | -1.49% |
| URI | United Rentals | | Rental & Leasing | 931.01 | 30 | -2.88% | -1.51% |
| CBZ | Cbiz | | Specialty | 56.80 | 40 | 2.53% | -1.51% |
| TRN | Trinity Industries | | Railroads | 27.74 | 30 | -0.39% | -1.53% |
| OSK | Oshkosh Corp | | Farm & Heavy Construction Machinery | 133.85 | 30 | -1.56% | -1.57% |
| WM | Waste Management | | Waste Mgmt | 215.66 | 10 | 0.83% | -1.60% |
| FAST | Fastenal Co | | Industrial Distribution | 47.12 | 30 | -0.28% | -1.63% |
| MEC | Mayville Engineering | | Fabrication | 14.16 | 10 | -2.95% | -1.67% |
| MAN | Manpower | | Staffing & Employment | 37.79 | 40 | -1.28% | -1.69% |
| KFRC | Kforce | | Staffing & Employment | 29.98 | 10 | -2.31% | -1.70% |
| ABM | ABM Industries | | Specialty | 45.11 | 10 | 0.74% | -1.70% |
| TRC | Tejon Ranch | | Conglomerates | 16.33 | 0 | -0.73% | -1.80% |
| DOV | Dover Corp | | Specialty Industrial Machinery | 171.45 | 20 | -0.65% | -1.85% |
| ESLT | Elbit Systems | | Aerospace & Defense | 479.93 | 20 | -5.52% | -1.91% |
| LECO | Loln Electric | | Tools & Accessories | 234.28 | 30 | 0.13% | -1.94% |
| TWIN | Twin Disc | | Specialty Industrial Machinery | 13.30 | 80 | -1.15% | -1.95% |
| For chart view version of above stock list: Chart View ➞ 0 - 25 , 25 - 50 , 50 - 75 , 75 - 100 , 100 - 125 , 125 - 150 , 150 - 175 , 175 - 200 , 200 - 225 , 225 - 250 , 250 - 275 , 275 - 300 , 300 - 325 , 325 - 350 , 350 - 375 , 375 - 400 , 400 - 425 , 425 - 450 , 450 - 475 , 475 - 500 , 500 - 525 | ||
 | Click To Change The Sort Order: By Market Cap or Company Size Performance: Year-to-date, Week and Day |  |
|
Get the most comprehensive stock market coverage daily at 12Stocks.com ➞ Best Stocks Today ➞ Best Stocks Weekly ➞ Best Stocks Year-to-Date ➞ Best Stocks Trends ➞  Best Stocks Today 12Stocks.com Best Nasdaq Stocks ➞ Best S&P 500 Stocks ➞ Best Tech Stocks ➞ Best Biotech Stocks ➞ |
| Detailed Overview of Industrial Stocks |
| Industrial Technical Overview, Leaders & Laggards, Top Industrial ETF Funds & Detailed Industrial Stocks List, Charts, Trends & More |
| Industrial Sector: Technical Analysis, Trends & YTD Performance | |
| Industrial sector is composed of stocks
from industrial machinery, aerospace, defense, farm/construction
and industrial services subsectors. Industrial sector, as represented by XLI, an exchange-traded fund [ETF] that holds basket of Industrial stocks (e.g, Caterpillar, Boeing) is up by 15.8152% and is currently outperforming the overall market by 2.6684% year-to-date. Below is a quick view of Technical charts and trends: |
|
 XLI Weekly Chart |
|
| Long Term Trend: Good | |
| Medium Term Trend: Not Good | |
 XLI Daily Chart |
|
| Short Term Trend: Not Good | |
| Overall Trend Score: 20 | |
| YTD Performance: 15.8152% | |
| **Trend Scores & Views Are Only For Educational Purposes And Not For Investing | |
| 12Stocks.com: Top Performing Industrial Sector Stocks | ||||||||||||||||||||||||||||||||||||||||||||||||
 The top performing Industrial sector stocks year to date are
Now, more recently, over last week, the top performing Industrial sector stocks on the move are


|
||||||||||||||||||||||||||||||||||||||||||||||||
| 12Stocks.com: Investing in Industrial Sector using Exchange Traded Funds | |
|
The following table shows list of key exchange traded funds (ETF) that
help investors track Industrial Index. For detailed view, check out our ETF Funds section of our website. Quick View: Move mouse or cursor over ETF symbol (ticker) to view short-term Technical chart and over ETF name to view long term chart. Click on ticker or stock name for detailed view. Click on to add stock symbol to your watchlist and to view watchlist. |
12Stocks.com List of ETFs that track Industrial Index
| Ticker | ETF Name | Watchlist | Recent Price | Smart Investing & Trading Score | Change % | Week % | Year-to-date % |
| CHII | China Industrials | | 9.80 | 20 | 0 | -0.0509944 | 0% |
| 12Stocks.com: Charts, Trends, Fundamental Data and Performances of Industrial Stocks | |
|
We now take in-depth look at all Industrial stocks including charts, multi-period performances and overall trends (as measured by Smart Investing & Trading Score). One can sort Industrial stocks (click link to choose) by Daily, Weekly and by Year-to-Date performances. Also, one can sort by size of the company or by market capitalization. |
| Select Your Default Chart Type: | |||||
| |||||
| Click on stock symbol or name for detailed view. Click on to add stock symbol to your watchlist and to view watchlist. Quick View: Move mouse or cursor over "Daily" to quickly view daily Technical stock chart and over "Weekly" to view weekly Technical stock chart. | |||||

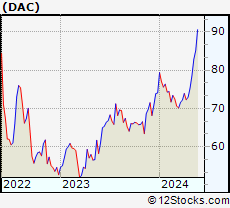 | DAC Danaos Corporation |
| Sector: Industrials | |
| SubSector: Marine Shipping | |
| MarketCap: 1747.84 Millions | |
| Recent Price: 94.93 Smart Investing & Trading Score: 50 | |
| Day Percent Change: 0.295827% Day Change: 0.55 | |
| Week Change: -1.25858% Year-to-date Change: 16.9% | |
| DAC Links: Profile News Message Board | |
| Charts:- Daily , Weekly | |
| Add DAC to Watchlist: View: Get Complete DAC Trend Analysis ➞ | |
 | MG Mistras Group Inc |
| Sector: Industrials | |
| SubSector: Security & Protection Services | |
| MarketCap: 306.87 Millions | |
| Recent Price: 9.41 Smart Investing & Trading Score: 30 | |
| Day Percent Change: -1.15546% Day Change: 0.05 | |
| Week Change: -1.25918% Year-to-date Change: 6.0% | |
| MG Links: Profile News Message Board | |
| Charts:- Daily , Weekly | |
| Add MG to Watchlist: View: Get Complete MG Trend Analysis ➞ | |
 | TH Target Hospitality Corp |
| Sector: Industrials | |
| SubSector: Specialty Business Services | |
| MarketCap: 876.06 Millions | |
| Recent Price: 8.60 Smart Investing & Trading Score: 30 | |
| Day Percent Change: -0.807382% Day Change: -0.15 | |
| Week Change: -1.26292% Year-to-date Change: -11.2% | |
| TH Links: Profile News Message Board | |
| Charts:- Daily , Weekly | |
| Add TH to Watchlist: View: Get Complete TH Trend Analysis ➞ | |
 | HXL Hexcel Corp |
| Sector: Industrials | |
| SubSector: Aerospace & Defense | |
| MarketCap: 5162.07 Millions | |
| Recent Price: 62.06 Smart Investing & Trading Score: 40 | |
| Day Percent Change: -0.94174% Day Change: -1.05 | |
| Week Change: -1.27267% Year-to-date Change: 1.3% | |
| HXL Links: Profile News Message Board | |
| Charts:- Daily , Weekly | |
| Add HXL to Watchlist: View: Get Complete HXL Trend Analysis ➞ | |
 | MAS Masco Corp |
| Sector: Industrials | |
| SubSector: Building Products & Equipment | |
| MarketCap: 15926.3 Millions | |
| Recent Price: 72.47 Smart Investing & Trading Score: 30 | |
| Day Percent Change: -1.13233% Day Change: -0.71 | |
| Week Change: -1.33424% Year-to-date Change: 2.6% | |
| MAS Links: Profile News Message Board | |
| Charts:- Daily , Weekly | |
| Add MAS to Watchlist: View: Get Complete MAS Trend Analysis ➞ | |
 | JBLU Jetblue Airways Corp |
| Sector: Industrials | |
| SubSector: Airlines | |
| MarketCap: 1847.42 Millions | |
| Recent Price: 5.07 Smart Investing & Trading Score: 70 | |
| Day Percent Change: 0% Day Change: -0.06 | |
| Week Change: -1.36187% Year-to-date Change: -32.2% | |
| JBLU Links: Profile News Message Board | |
| Charts:- Daily , Weekly | |
| Add JBLU to Watchlist: View: Get Complete JBLU Trend Analysis ➞ | |
 | DE Deere & Co |
| Sector: Industrials | |
| SubSector: Farm & Heavy Construction Machinery | |
| MarketCap: 127936 Millions | |
| Recent Price: 469.12 Smart Investing & Trading Score: 10 | |
| Day Percent Change: 0.0896096% Day Change: -1.84 | |
| Week Change: -1.36249% Year-to-date Change: 12.9% | |
| DE Links: Profile News Message Board | |
| Charts:- Daily , Weekly | |
| Add DE to Watchlist: View: Get Complete DE Trend Analysis ➞ | |
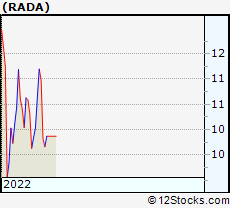 | RADA RADA Electronic Industries Ltd. |
| Sector: Industrials | |
| SubSector: Aerospace/Defense - Major Diversified | |
| MarketCap: 149.249 Millions | |
| Recent Price: 12.84 Smart Investing & Trading Score: 30 | |
| Day Percent Change: -2.0595% Day Change: -9999 | |
| Week Change: -1.45817% Year-to-date Change: 0.0% | |
| RADA Links: Profile News Message Board | |
| Charts:- Daily , Weekly | |
| Add RADA to Watchlist: View: Get Complete RADA Trend Analysis ➞ | |
 | IEX Idex Corporation |
| Sector: Industrials | |
| SubSector: Specialty Industrial Machinery | |
| MarketCap: 12417.1 Millions | |
| Recent Price: 159.59 Smart Investing & Trading Score: 10 | |
| Day Percent Change: -2.59399% Day Change: -3.08 | |
| Week Change: -1.46941% Year-to-date Change: -21.7% | |
| IEX Links: Profile News Message Board | |
| Charts:- Daily , Weekly | |
| Add IEX to Watchlist: View: Get Complete IEX Trend Analysis ➞ | |
 | BAH Booz Allen Hamilton Holding Corp |
| Sector: Industrials | |
| SubSector: Consulting Services | |
| MarketCap: 12626.8 Millions | |
| Recent Price: 101.58 Smart Investing & Trading Score: 20 | |
| Day Percent Change: -0.245507% Day Change: 0.2 | |
| Week Change: -1.49341% Year-to-date Change: -19.9% | |
| BAH Links: Profile News Message Board | |
| Charts:- Daily , Weekly | |
| Add BAH to Watchlist: View: Get Complete BAH Trend Analysis ➞ | |
 | URI United Rentals, Inc |
| Sector: Industrials | |
| SubSector: Rental & Leasing Services | |
| MarketCap: 62747.5 Millions | |
| Recent Price: 931.01 Smart Investing & Trading Score: 30 | |
| Day Percent Change: -2.88322% Day Change: -25.65 | |
| Week Change: -1.51481% Year-to-date Change: 35.6% | |
| URI Links: Profile News Message Board | |
| Charts:- Daily , Weekly | |
| Add URI to Watchlist: View: Get Complete URI Trend Analysis ➞ | |
 | CBZ Cbiz Inc |
| Sector: Industrials | |
| SubSector: Specialty Business Services | |
| MarketCap: 3230.96 Millions | |
| Recent Price: 56.80 Smart Investing & Trading Score: 40 | |
| Day Percent Change: 2.52708% Day Change: 0.7 | |
| Week Change: -1.50858% Year-to-date Change: -30.0% | |
| CBZ Links: Profile News Message Board | |
| Charts:- Daily , Weekly | |
| Add CBZ to Watchlist: View: Get Complete CBZ Trend Analysis ➞ | |
 | TRN Trinity Industries, Inc |
| Sector: Industrials | |
| SubSector: Railroads | |
| MarketCap: 2309.52 Millions | |
| Recent Price: 27.74 Smart Investing & Trading Score: 30 | |
| Day Percent Change: -0.394973% Day Change: -0.01 | |
| Week Change: -1.52645% Year-to-date Change: -18.5% | |
| TRN Links: Profile News Message Board | |
| Charts:- Daily , Weekly | |
| Add TRN to Watchlist: View: Get Complete TRN Trend Analysis ➞ | |
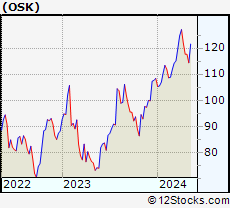 | OSK Oshkosh Corp |
| Sector: Industrials | |
| SubSector: Farm & Heavy Construction Machinery | |
| MarketCap: 8932.52 Millions | |
| Recent Price: 133.85 Smart Investing & Trading Score: 30 | |
| Day Percent Change: -1.55917% Day Change: -2.48 | |
| Week Change: -1.56641% Year-to-date Change: 44.5% | |
| OSK Links: Profile News Message Board | |
| Charts:- Daily , Weekly | |
| Add OSK to Watchlist: View: Get Complete OSK Trend Analysis ➞ | |
 | WM Waste Management, Inc |
| Sector: Industrials | |
| SubSector: Waste Management | |
| MarketCap: 88646.8 Millions | |
| Recent Price: 215.66 Smart Investing & Trading Score: 10 | |
| Day Percent Change: 0.832242% Day Change: 2.02 | |
| Week Change: -1.59701% Year-to-date Change: 8.3% | |
| WM Links: Profile News Message Board | |
| Charts:- Daily , Weekly | |
| Add WM to Watchlist: View: Get Complete WM Trend Analysis ➞ | |
 | FAST Fastenal Co |
| Sector: Industrials | |
| SubSector: Industrial Distribution | |
| MarketCap: 55075.1 Millions | |
| Recent Price: 47.12 Smart Investing & Trading Score: 30 | |
| Day Percent Change: -0.275132% Day Change: 0 | |
| Week Change: -1.62839% Year-to-date Change: 34.6% | |
| FAST Links: Profile News Message Board | |
| Charts:- Daily , Weekly | |
| Add FAST to Watchlist: View: Get Complete FAST Trend Analysis ➞ | |
 | MEC Mayville Engineering Company Inc |
| Sector: Industrials | |
| SubSector: Metal Fabrication | |
| MarketCap: 302.13 Millions | |
| Recent Price: 14.16 Smart Investing & Trading Score: 10 | |
| Day Percent Change: -2.94722% Day Change: -0.17 | |
| Week Change: -1.66667% Year-to-date Change: -8.9% | |
| MEC Links: Profile News Message Board | |
| Charts:- Daily , Weekly | |
| Add MEC to Watchlist: View: Get Complete MEC Trend Analysis ➞ | |
 | MAN ManpowerGroup |
| Sector: Industrials | |
| SubSector: Staffing & Employment Services | |
| MarketCap: 1909.97 Millions | |
| Recent Price: 37.79 Smart Investing & Trading Score: 40 | |
| Day Percent Change: -1.28004% Day Change: -0.52 | |
| Week Change: -1.69095% Year-to-date Change: -32.6% | |
| MAN Links: Profile News Message Board | |
| Charts:- Daily , Weekly | |
| Add MAN to Watchlist: View: Get Complete MAN Trend Analysis ➞ | |
 | KFRC Kforce Inc |
| Sector: Industrials | |
| SubSector: Staffing & Employment Services | |
| MarketCap: 597.59 Millions | |
| Recent Price: 29.98 Smart Investing & Trading Score: 10 | |
| Day Percent Change: -2.31346% Day Change: -0.38 | |
| Week Change: -1.70492% Year-to-date Change: -44.9% | |
| KFRC Links: Profile News Message Board | |
| Charts:- Daily , Weekly | |
| Add KFRC to Watchlist: View: Get Complete KFRC Trend Analysis ➞ | |
 | ABM ABM Industries Inc |
| Sector: Industrials | |
| SubSector: Specialty Business Services | |
| MarketCap: 3004.57 Millions | |
| Recent Price: 45.11 Smart Investing & Trading Score: 10 | |
| Day Percent Change: 0.736936% Day Change: -0.31 | |
| Week Change: -1.69972% Year-to-date Change: -10.8% | |
| ABM Links: Profile News Message Board | |
| Charts:- Daily , Weekly | |
| Add ABM to Watchlist: View: Get Complete ABM Trend Analysis ➞ | |
 | TRC Tejon Ranch Co |
| Sector: Industrials | |
| SubSector: Conglomerates | |
| MarketCap: 446.44 Millions | |
| Recent Price: 16.33 Smart Investing & Trading Score: 0 | |
| Day Percent Change: -0.729483% Day Change: 0.26 | |
| Week Change: -1.80397% Year-to-date Change: 3.3% | |
| TRC Links: Profile News Message Board | |
| Charts:- Daily , Weekly | |
| Add TRC to Watchlist: View: Get Complete TRC Trend Analysis ➞ | |
 | DOV Dover Corp |
| Sector: Industrials | |
| SubSector: Specialty Industrial Machinery | |
| MarketCap: 24375.7 Millions | |
| Recent Price: 171.45 Smart Investing & Trading Score: 20 | |
| Day Percent Change: -0.649012% Day Change: -1.26 | |
| Week Change: -1.8491% Year-to-date Change: -7.1% | |
| DOV Links: Profile News Message Board | |
| Charts:- Daily , Weekly | |
| Add DOV to Watchlist: View: Get Complete DOV Trend Analysis ➞ | |
 | ESLT Elbit Systems Ltd |
| Sector: Industrials | |
| SubSector: Aerospace & Defense | |
| MarketCap: 22342.6 Millions | |
| Recent Price: 479.93 Smart Investing & Trading Score: 20 | |
| Day Percent Change: -5.51728% Day Change: 2.3 | |
| Week Change: -1.90598% Year-to-date Change: 83.4% | |
| ESLT Links: Profile News Message Board | |
| Charts:- Daily , Weekly | |
| Add ESLT to Watchlist: View: Get Complete ESLT Trend Analysis ➞ | |
 | LECO Lincoln Electric Holdings, Inc |
| Sector: Industrials | |
| SubSector: Tools & Accessories | |
| MarketCap: 13483.1 Millions | |
| Recent Price: 234.28 Smart Investing & Trading Score: 30 | |
| Day Percent Change: 0.128216% Day Change: -1.76 | |
| Week Change: -1.94207% Year-to-date Change: 27.7% | |
| LECO Links: Profile News Message Board | |
| Charts:- Daily , Weekly | |
| Add LECO to Watchlist: View: Get Complete LECO Trend Analysis ➞ | |
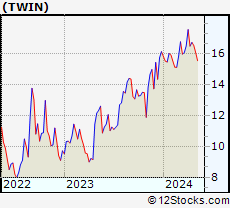 | TWIN Twin Disc Incorporated |
| Sector: Industrials | |
| SubSector: Specialty Industrial Machinery | |
| MarketCap: 184.2 Millions | |
| Recent Price: 13.30 Smart Investing & Trading Score: 80 | |
| Day Percent Change: -1.15156% Day Change: 2.59 | |
| Week Change: -1.95284% Year-to-date Change: 15.8% | |
| TWIN Links: Profile News Message Board | |
| Charts:- Daily , Weekly | |
| Add TWIN to Watchlist: View: Get Complete TWIN Trend Analysis ➞ | |
| For tabular summary view of above stock list: Summary View ➞ 0 - 25 , 25 - 50 , 50 - 75 , 75 - 100 , 100 - 125 , 125 - 150 , 150 - 175 , 175 - 200 , 200 - 225 , 225 - 250 , 250 - 275 , 275 - 300 , 300 - 325 , 325 - 350 , 350 - 375 , 375 - 400 , 400 - 425 , 425 - 450 , 450 - 475 , 475 - 500 , 500 - 525 | ||
| Click To Change The Sort Order: By Market Cap or Company Size Performance: Year-to-date, Week and Day | |
| Select Chart Type: | ||
|
Best Stocks Today 12Stocks.com |
© 2025 12Stocks.com Terms & Conditions Privacy Contact Us
All Information Provided Only For Education And Not To Be Used For Investing or Trading. See Terms & Conditions


One More Thing ... Get Best Stocks Delivered Daily!
Never Ever Miss A Move With Our Top Ten Stocks Lists
Find Best Stocks In Any Market - Bull or Bear Market
Take A Peek At Our Top Ten Stocks Lists: Daily, Weekly, Year-to-Date & Top Trends
Find Best Stocks In Any Market - Bull or Bear Market
Take A Peek At Our Top Ten Stocks Lists: Daily, Weekly, Year-to-Date & Top Trends
Industrial Stocks With Best Up Trends [0-bearish to 100-bullish]: Brooge [100], Plug Power[100], Ballard Power[100], GrafTech [100], Bloom Energy[100], American Superconductor[100], PICO [100], Seanergy Maritime[100], Acco Brands[100], Controladora Vuela[100], Tetra Technologies[100]
Best Industrial Stocks Year-to-Date:
Triumph [1281.83%], GrafTech [600.581%], Tecogen [486.452%], Power [247.28%], Bloom Energy[240.907%], Lightbridge Corp[189.608%], Kratos Defense[187.111%], Willdan [170.86%], ESGL [170.593%], Tutor Perini[163.328%], Planet Labs[157.683%] Best Industrial Stocks This Week:
TRC [10149.1%], Advanced Emissions[3571.78%], L3 Technologies[1915.25%], Forterra [1845.47%], KLX [437.488%], Allegro Merger[402.182%], LMI Aerospace[291.621%], Chicago Bridge[205.472%], Covanta Holding[148.617%], MOOG [148.377%], Altra [103.372%] Best Industrial Stocks Daily:
Brooge [29.5547%], Plug Power[19.0476%], Ballard Power[14.5455%], GrafTech [11.9888%], Tecogen [10.989%], B/E Aerospace[8.86381%], Bloom Energy[8.70514%], American Superconductor[7.043%], Ads-Tec Energy[5.48272%], Planet Labs[4.92308%], William Lyon[4.78516%]