
 Login Sign Up


| |||||
 |  | ||||

| 12Stocks.com Market Intelligence |
Best Healthcare Stocks
 | "Discover best trending healthcare stocks with 12Stocks.com." |
| - Subu Vdaygiri, Founder, 12Stocks.com |
| In a hurry? Healthcare Stocks Lists: Performance Trends Table, Stock Charts
Sort Healthcare stocks: Daily, Weekly, Year-to-Date, Market Cap & Trends. Filter Healthcare stocks list by size:All Healthcare Large Mid-Range Small |
| 12Stocks.com Healthcare Stocks Performances & Trends Daily | |||||||||
|
|  The overall Smart Investing & Trading Score is 30 (0-bearish to 100-bullish) which puts Healthcare sector in short term bearish to neutral trend. The Smart Investing & Trading Score from previous trading session is 38 and hence a deterioration of trend.
| ||||||||
Here are the Smart Investing & Trading Scores of the most requested Healthcare stocks at 12Stocks.com (click stock name for detailed review):
|


| 12Stocks.com: Investing in Healthcare sector with Stocks | |
|
The following table helps investors and traders sort through current performance and trends (as measured by Smart Investing & Trading Score) of various
stocks in the Healthcare sector. Quick View: Move mouse or cursor over stock symbol (ticker) to view short-term Technical chart and over stock name to view long term chart. Click on  to add stock symbol to your watchlist and to add stock symbol to your watchlist and  to view watchlist. Click on any ticker or stock name for detailed market intelligence report for that stock. to view watchlist. Click on any ticker or stock name for detailed market intelligence report for that stock. |
12Stocks.com Performance of Stocks in Healthcare Sector
| Ticker | Stock Name | Watchlist | Category | Recent Price | Smart Investing & Trading Score | Change % | YTD Change% |
| MLTX | MoonLake Immuno |   | Biotechnology | 42.47 | 20 | 0.52 | -32.35% |
| XGN | Exagen | | Laboratories | 1.41 | 27 | 0.50 | -29.05% |
| OCS | Oculis Holding | | Biotechnology | 12.01 | 47 | 0.50 | 8.19% |
| GSK | GlaxoSmithKline | | Pharmaceutical | 41.11 | 70 | 0.49 | 10.93% |
| PBH | Prestige Consumer | | Equipment | 70.47 | 83 | 0.47 | 15.11% |
| BRKR | Bruker | | Laboratories | 80.97 | 58 | 0.47 | 10.19% |
| BCLI | Brainstorm Cell | | Biotechnology | 0.53 | 54 | 0.47 | 95.79% |
| BDX | Becton Dickinson | | Instruments | 231.55 | 10 | 0.46 | -5.04% |
| ARAY | Accuray | | Equipment | 2.19 | 32 | 0.46 | -22.61% |
| KRMD | Repro Med | | Instruments | 2.19 | 80 | 0.46 | -10.79% |
| GLPG | Galapagos NV | | Biotechnology | 28.76 | 27 | 0.45 | -29.25% |
| MTD | Mettler-Toledo | | Instruments | 1238.09 | 61 | 0.42 | 2.07% |
| NTRA | Natera | | Laboratories | 91.66 | 68 | 0.42 | 46.33% |
| NATR | Nature s | | Pharmaceutical | 19.50 | 70 | 0.41 | 12.78% |
| CDMO | Avid Bioservices | | Biotechnology | 7.35 | 75 | 0.41 | 13.08% |
| MDXG | MiMedx | | Equipment | 6.27 | 29 | 0.40 | -28.51% |
| FLGT | Fulgent Genetics | | Laboratories | 20.10 | 52 | 0.40 | -30.47% |
| DSGN | Design | | Biotechnology | 3.77 | 50 | 0.40 | 42.18% |
| CIVI | Civitas | | Long-Term | 74.01 | 22 | 0.39 | 8.23% |
| CDXS | Codexis | | Biotechnology | 2.66 | 48 | 0.38 | -12.79% |
| IQV | IQVIA | | Laboratories | 234.88 | 53 | 0.38 | 1.51% |
| MRK | Merck | | Pharmaceutical | 131.20 | 100 | 0.37 | 20.34% |
| ABUS | Arbutus Biopharma | | Biotechnology | 2.73 | 68 | 0.37 | 9.20% |
| HOLX | Hologic | | Instruments | 75.98 | 36 | 0.36 | 6.34% |
| DVAX | Dynavax Technologies | | Biotechnology | 11.21 | 10 | 0.36 | -19.81% |
| For chart view version of above stock list: Chart View ➞ 0 - 25 , 25 - 50 , 50 - 75 , 75 - 100 , 100 - 125 , 125 - 150 , 150 - 175 , 175 - 200 , 200 - 225 , 225 - 250 , 250 - 275 , 275 - 300 , 300 - 325 , 325 - 350 , 350 - 375 , 375 - 400 , 400 - 425 , 425 - 450 , 450 - 475 , 475 - 500 , 500 - 525 , 525 - 550 , 550 - 575 , 575 - 600 , 600 - 625 , 625 - 650 , 650 - 675 , 675 - 700 , 700 - 725 | ||
 | Click To Change The Sort Order: By Market Cap or Company Size Performance: Year-to-date, Week and Day |  |
|
Get the most comprehensive stock market coverage daily at 12Stocks.com ➞ Best Stocks Today ➞ Best Stocks Weekly ➞ Best Stocks Year-to-Date ➞ Best Stocks Trends ➞  Best Stocks Today 12Stocks.com Best Nasdaq Stocks ➞ Best S&P 500 Stocks ➞ Best Tech Stocks ➞ Best Biotech Stocks ➞ |
| Detailed Overview of Healthcare Stocks |
| Healthcare Technical Overview, Leaders & Laggards, Top Healthcare ETF Funds & Detailed Healthcare Stocks List, Charts, Trends & More |
| Healthcare Sector: Technical Analysis, Trends & YTD Performance | |
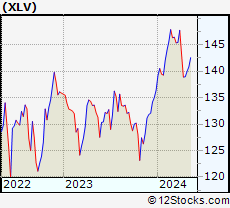
| Healthcare sector is composed of stocks
from pharmaceutical, biotech, diagnostics labs, insurance providers
and healthcare services. Healthcare sector, as represented by XLV, an exchange-traded fund [ETF] that holds basket of Healthcare stocks (e.g, Merck, Amgen) is up by 2.63% and is currently underperforming the overall market by -3.51% year-to-date. Below is a quick view of Technical charts and trends: |
|
 XLV Weekly Chart |
|
| Long Term Trend: Not Good | |
| Medium Term Trend: Not Good | |
 XLV Daily Chart |
|
| Short Term Trend: Deteriorating | |
| Overall Trend Score: 30 | |
| YTD Performance: 2.63% | |
| **Trend Scores & Views Are Only For Educational Purposes And Not For Investing | |
| 12Stocks.com: Top Performing Healthcare Sector Stocks | ||||||||||||||||||||||||||||||||||||||||||||||||
 The top performing Healthcare sector stocks year to date are
Now, more recently, over last week, the top performing Healthcare sector stocks on the move are


|
||||||||||||||||||||||||||||||||||||||||||||||||
| 12Stocks.com: Investing in Healthcare Sector using Exchange Traded Funds | |
|
The following table shows list of key exchange traded funds (ETF) that
help investors track Healthcare Index. For detailed view, check out our ETF Funds section of our website. Quick View: Move mouse or cursor over ETF symbol (ticker) to view short-term Technical chart and over ETF name to view long term chart. Click on ticker or stock name for detailed view. Click on to add stock symbol to your watchlist and to view watchlist. |
12Stocks.com List of ETFs that track Healthcare Index
| Ticker | ETF Name | Watchlist | Recent Price | Smart Investing & Trading Score | Change % | Week % | Year-to-date % |
| XLV | Health Care | | 139.96 | 30 | 0.03 | 0.73 | 2.63% |
| XBI | Biotech | | 83.49 | 32 | 1.54 | 0.8 | -6.5% |
| IBB | Biotechnology | | 126.49 | 10 | 0.65 | 1.42 | -6.89% |
| BBH | Biotech | | 155.65 | 7 | 0.67 | 2.16 | -5.84% |
| VHT | Health Care | | 255.32 | 45 | 0.03 | 0.79 | 1.84% |
| IYH | Healthcare | | 58.61 | 45 | -0.12 | 0.77 | 2.38% |
| IHF | Healthcare Providers | | 51.92 | 35 | -0.36 | -0.56 | -1.12% |
| IHI | Medical Devices | | 55.53 | 50 | 0.47 | 2.15 | 2.89% |
| BIB | Biotechnology | | 49.66 | 24 | 1.70 | 3.03 | -12.95% |
| BIS | Short Biotech | | 20.22 | 76 | -1.80 | -3.23 | 11.9% |
| XHE | Health Care Equipment | | 82.43 | 35 | 0.81 | 1.43 | -2.17% |
| CURE | Healthcare Bull 3X | | 105.31 | 17 | -0.01 | 1.91 | 3.5% |
| LABU | Biotech Bull 3X | | 87.51 | 32 | 4.53 | 1.7 | -28.25% |
| LABD | Biotech Bear 3X | | 10.52 | 68 | -4.62 | -2.59 | 8.57% |
| PSCH | SmallCap Health Care | | 40.70 | 42 | 0.97 | 1.29 | -4.91% |
| XHS | Health Care Services | | 87.87 | 75 | 0.22 | 0.9 | -1.21% |
| PTH | DWA Healthcare Momentum | | 39.89 | 53 | 0.73 | 0.91 | 1.92% |
| BTEC | Principal Healthcare Innovators | | 34.25 | 32 | 0.11 | 1.15 | -5.73% |
| RXL | Health Care | | 94.83 | 24 | 0.32 | 1.72 | 3.74% |
| RXD | Short Health Care | | 11.45 | 78 | -0.04 | -1.63 | -3.98% |
| 12Stocks.com: Charts, Trends, Fundamental Data and Performances of Healthcare Stocks | |
|
We now take in-depth look at all Healthcare stocks including charts, multi-period performances and overall trends (as measured by Smart Investing & Trading Score). One can sort Healthcare stocks (click link to choose) by Daily, Weekly and by Year-to-Date performances. Also, one can sort by size of the company or by market capitalization. |
| Select Your Default Chart Type: | |||||
| |||||
| Click on stock symbol or name for detailed view. Click on to add stock symbol to your watchlist and to view watchlist. Quick View: Move mouse or cursor over "Daily" to quickly view daily Technical stock chart and over "Weekly" to view weekly Technical stock chart. | |||||

 | MLTX MoonLake Immunotherapeutics |
| Sector: Health Care | |
| SubSector: Biotechnology | |
| MarketCap: 2670 Millions | |
| Recent Price: 42.47 Smart Investing & Trading Score: 20 | |
| Day Percent Change: 0.52% Day Change: 0.22 | |
| Week Change: 0.66% Year-to-date Change: -32.4% | |
| MLTX Links: Profile News Message Board | |
| Charts:- Daily , Weekly | |
| Add MLTX to Watchlist: View: Get Complete MLTX Trend Analysis ➞ | |
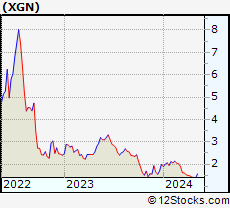 | XGN Exagen Inc. |
| Sector: Health Care | |
| SubSector: Medical Laboratories & Research | |
| MarketCap: 231.7 Millions | |
| Recent Price: 1.41 Smart Investing & Trading Score: 27 | |
| Day Percent Change: 0.50% Day Change: 0.01 | |
| Week Change: -0.56% Year-to-date Change: -29.1% | |
| XGN Links: Profile News Message Board | |
| Charts:- Daily , Weekly | |
| Add XGN to Watchlist: View: Get Complete XGN Trend Analysis ➞ | |
 | OCS Oculis Holding AG |
| Sector: Health Care | |
| SubSector: Biotechnology | |
| MarketCap: 460 Millions | |
| Recent Price: 12.01 Smart Investing & Trading Score: 47 | |
| Day Percent Change: 0.50% Day Change: 0.06 | |
| Week Change: 1.95% Year-to-date Change: 8.2% | |
| OCS Links: Profile News Message Board | |
| Charts:- Daily , Weekly | |
| Add OCS to Watchlist: View: Get Complete OCS Trend Analysis ➞ | |
 | GSK GlaxoSmithKline plc |
| Sector: Health Care | |
| SubSector: Drug Manufacturers - Major | |
| MarketCap: 89428.2 Millions | |
| Recent Price: 41.11 Smart Investing & Trading Score: 70 | |
| Day Percent Change: 0.49% Day Change: 0.20 | |
| Week Change: 3.42% Year-to-date Change: 10.9% | |
| GSK Links: Profile News Message Board | |
| Charts:- Daily , Weekly | |
| Add GSK to Watchlist: View: Get Complete GSK Trend Analysis ➞ | |
 | PBH Prestige Consumer Healthcare Inc. |
| Sector: Health Care | |
| SubSector: Medical Appliances & Equipment | |
| MarketCap: 1639.6 Millions | |
| Recent Price: 70.47 Smart Investing & Trading Score: 83 | |
| Day Percent Change: 0.47% Day Change: 0.33 | |
| Week Change: 1.15% Year-to-date Change: 15.1% | |
| PBH Links: Profile News Message Board | |
| Charts:- Daily , Weekly | |
| Add PBH to Watchlist: View: Get Complete PBH Trend Analysis ➞ | |
 | BRKR Bruker Corporation |
| Sector: Health Care | |
| SubSector: Medical Laboratories & Research | |
| MarketCap: 5932 Millions | |
| Recent Price: 80.97 Smart Investing & Trading Score: 58 | |
| Day Percent Change: 0.47% Day Change: 0.38 | |
| Week Change: 4.13% Year-to-date Change: 10.2% | |
| BRKR Links: Profile News Message Board | |
| Charts:- Daily , Weekly | |
| Add BRKR to Watchlist: View: Get Complete BRKR Trend Analysis ➞ | |
 | BCLI Brainstorm Cell Therapeutics Inc. |
| Sector: Health Care | |
| SubSector: Biotechnology | |
| MarketCap: 141.285 Millions | |
| Recent Price: 0.53 Smart Investing & Trading Score: 54 | |
| Day Percent Change: 0.47% Day Change: 0.00 | |
| Week Change: 0.47% Year-to-date Change: 95.8% | |
| BCLI Links: Profile News Message Board | |
| Charts:- Daily , Weekly | |
| Add BCLI to Watchlist: View: Get Complete BCLI Trend Analysis ➞ | |
 | BDX Becton, Dickinson and Company |
| Sector: Health Care | |
| SubSector: Medical Instruments & Supplies | |
| MarketCap: 62758.4 Millions | |
| Recent Price: 231.55 Smart Investing & Trading Score: 10 | |
| Day Percent Change: 0.46% Day Change: 1.07 | |
| Week Change: -1.1% Year-to-date Change: -5.0% | |
| BDX Links: Profile News Message Board | |
| Charts:- Daily , Weekly | |
| Add BDX to Watchlist: View: Get Complete BDX Trend Analysis ➞ | |
 | ARAY Accuray Incorporated |
| Sector: Health Care | |
| SubSector: Medical Appliances & Equipment | |
| MarketCap: 169.58 Millions | |
| Recent Price: 2.19 Smart Investing & Trading Score: 32 | |
| Day Percent Change: 0.46% Day Change: 0.01 | |
| Week Change: 2.34% Year-to-date Change: -22.6% | |
| ARAY Links: Profile News Message Board | |
| Charts:- Daily , Weekly | |
| Add ARAY to Watchlist: View: Get Complete ARAY Trend Analysis ➞ | |
 | KRMD Repro Med Systems, Inc. |
| Sector: Health Care | |
| SubSector: Medical Instruments & Supplies | |
| MarketCap: 340.06 Millions | |
| Recent Price: 2.19 Smart Investing & Trading Score: 80 | |
| Day Percent Change: 0.46% Day Change: 0.01 | |
| Week Change: 6.31% Year-to-date Change: -10.8% | |
| KRMD Links: Profile News Message Board | |
| Charts:- Daily , Weekly | |
| Add KRMD to Watchlist: View: Get Complete KRMD Trend Analysis ➞ | |
 | GLPG Galapagos NV |
| Sector: Health Care | |
| SubSector: Biotechnology | |
| MarketCap: 9541.55 Millions | |
| Recent Price: 28.76 Smart Investing & Trading Score: 27 | |
| Day Percent Change: 0.45% Day Change: 0.13 | |
| Week Change: -1.1% Year-to-date Change: -29.3% | |
| GLPG Links: Profile News Message Board | |
| Charts:- Daily , Weekly | |
| Add GLPG to Watchlist: View: Get Complete GLPG Trend Analysis ➞ | |
 | MTD Mettler-Toledo International Inc. |
| Sector: Health Care | |
| SubSector: Medical Instruments & Supplies | |
| MarketCap: 15973.1 Millions | |
| Recent Price: 1238.09 Smart Investing & Trading Score: 61 | |
| Day Percent Change: 0.42% Day Change: 5.18 | |
| Week Change: 4.17% Year-to-date Change: 2.1% | |
| MTD Links: Profile News Message Board | |
| Charts:- Daily , Weekly | |
| Add MTD to Watchlist: View: Get Complete MTD Trend Analysis ➞ | |
 | NTRA Natera, Inc. |
| Sector: Health Care | |
| SubSector: Medical Laboratories & Research | |
| MarketCap: 2152.1 Millions | |
| Recent Price: 91.66 Smart Investing & Trading Score: 68 | |
| Day Percent Change: 0.42% Day Change: 0.38 | |
| Week Change: 7.48% Year-to-date Change: 46.3% | |
| NTRA Links: Profile News Message Board | |
| Charts:- Daily , Weekly | |
| Add NTRA to Watchlist: View: Get Complete NTRA Trend Analysis ➞ | |
 | NATR Nature s Sunshine Products, Inc. |
| Sector: Health Care | |
| SubSector: Drugs - Generic | |
| MarketCap: 153.285 Millions | |
| Recent Price: 19.50 Smart Investing & Trading Score: 70 | |
| Day Percent Change: 0.41% Day Change: 0.08 | |
| Week Change: 1.09% Year-to-date Change: 12.8% | |
| NATR Links: Profile News Message Board | |
| Charts:- Daily , Weekly | |
| Add NATR to Watchlist: View: Get Complete NATR Trend Analysis ➞ | |
 | CDMO Avid Bioservices, Inc. |
| Sector: Health Care | |
| SubSector: Biotechnology | |
| MarketCap: 203.685 Millions | |
| Recent Price: 7.35 Smart Investing & Trading Score: 75 | |
| Day Percent Change: 0.41% Day Change: 0.03 | |
| Week Change: 14.66% Year-to-date Change: 13.1% | |
| CDMO Links: Profile News Message Board | |
| Charts:- Daily , Weekly | |
| Add CDMO to Watchlist: View: Get Complete CDMO Trend Analysis ➞ | |
 | MDXG MiMedx Group, Inc. |
| Sector: Health Care | |
| SubSector: Medical Appliances & Equipment | |
| MarketCap: 371.08 Millions | |
| Recent Price: 6.27 Smart Investing & Trading Score: 29 | |
| Day Percent Change: 0.40% Day Change: 0.02 | |
| Week Change: -0.32% Year-to-date Change: -28.5% | |
| MDXG Links: Profile News Message Board | |
| Charts:- Daily , Weekly | |
| Add MDXG to Watchlist: View: Get Complete MDXG Trend Analysis ➞ | |
 | FLGT Fulgent Genetics, Inc. |
| Sector: Health Care | |
| SubSector: Medical Laboratories & Research | |
| MarketCap: 222.2 Millions | |
| Recent Price: 20.10 Smart Investing & Trading Score: 52 | |
| Day Percent Change: 0.40% Day Change: 0.08 | |
| Week Change: -1.18% Year-to-date Change: -30.5% | |
| FLGT Links: Profile News Message Board | |
| Charts:- Daily , Weekly | |
| Add FLGT to Watchlist: View: Get Complete FLGT Trend Analysis ➞ | |
 | DSGN Design Therapeutics, Inc. |
| Sector: Health Care | |
| SubSector: Biotechnology | |
| MarketCap: 367 Millions | |
| Recent Price: 3.77 Smart Investing & Trading Score: 50 | |
| Day Percent Change: 0.40% Day Change: 0.02 | |
| Week Change: 2.03% Year-to-date Change: 42.2% | |
| DSGN Links: Profile News Message Board | |
| Charts:- Daily , Weekly | |
| Add DSGN to Watchlist: View: Get Complete DSGN Trend Analysis ➞ | |
 | CIVI Civitas Solutions, Inc. |
| Sector: Health Care | |
| SubSector: Long-Term Care Facilities | |
| MarketCap: 625.74 Millions | |
| Recent Price: 74.01 Smart Investing & Trading Score: 22 | |
| Day Percent Change: 0.39% Day Change: 0.29 | |
| Week Change: 1.9% Year-to-date Change: 8.2% | |
| CIVI Links: Profile News Message Board | |
| Charts:- Daily , Weekly | |
| Add CIVI to Watchlist: View: Get Complete CIVI Trend Analysis ➞ | |
 | CDXS Codexis, Inc. |
| Sector: Health Care | |
| SubSector: Biotechnology | |
| MarketCap: 592.185 Millions | |
| Recent Price: 2.66 Smart Investing & Trading Score: 48 | |
| Day Percent Change: 0.38% Day Change: 0.01 | |
| Week Change: -6.01% Year-to-date Change: -12.8% | |
| CDXS Links: Profile News Message Board | |
| Charts:- Daily , Weekly | |
| Add CDXS to Watchlist: View: Get Complete CDXS Trend Analysis ➞ | |
 | IQV IQVIA Holdings Inc. |
| Sector: Health Care | |
| SubSector: Medical Laboratories & Research | |
| MarketCap: 19616.5 Millions | |
| Recent Price: 234.88 Smart Investing & Trading Score: 53 | |
| Day Percent Change: 0.38% Day Change: 0.90 | |
| Week Change: 2.98% Year-to-date Change: 1.5% | |
| IQV Links: Profile News Message Board | |
| Charts:- Daily , Weekly | |
| Add IQV to Watchlist: View: Get Complete IQV Trend Analysis ➞ | |
 | MRK Merck & Co., Inc. |
| Sector: Health Care | |
| SubSector: Drug Manufacturers - Major | |
| MarketCap: 192657 Millions | |
| Recent Price: 131.20 Smart Investing & Trading Score: 100 | |
| Day Percent Change: 0.37% Day Change: 0.48 | |
| Week Change: 4.31% Year-to-date Change: 20.3% | |
| MRK Links: Profile News Message Board | |
| Charts:- Daily , Weekly | |
| Add MRK to Watchlist: View: Get Complete MRK Trend Analysis ➞ | |
 | ABUS Arbutus Biopharma Corporation |
| Sector: Health Care | |
| SubSector: Biotechnology | |
| MarketCap: 110.885 Millions | |
| Recent Price: 2.73 Smart Investing & Trading Score: 68 | |
| Day Percent Change: 0.37% Day Change: 0.01 | |
| Week Change: 0.37% Year-to-date Change: 9.2% | |
| ABUS Links: Profile News Message Board | |
| Charts:- Daily , Weekly | |
| Add ABUS to Watchlist: View: Get Complete ABUS Trend Analysis ➞ | |
 | HOLX Hologic, Inc. |
| Sector: Health Care | |
| SubSector: Medical Instruments & Supplies | |
| MarketCap: 9075.2 Millions | |
| Recent Price: 75.98 Smart Investing & Trading Score: 36 | |
| Day Percent Change: 0.36% Day Change: 0.27 | |
| Week Change: 0.8% Year-to-date Change: 6.3% | |
| HOLX Links: Profile News Message Board | |
| Charts:- Daily , Weekly | |
| Add HOLX to Watchlist: View: Get Complete HOLX Trend Analysis ➞ | |
 | DVAX Dynavax Technologies Corporation |
| Sector: Health Care | |
| SubSector: Biotechnology | |
| MarketCap: 276.885 Millions | |
| Recent Price: 11.21 Smart Investing & Trading Score: 10 | |
| Day Percent Change: 0.36% Day Change: 0.04 | |
| Week Change: -5% Year-to-date Change: -19.8% | |
| DVAX Links: Profile News Message Board | |
| Charts:- Daily , Weekly | |
| Add DVAX to Watchlist: View: Get Complete DVAX Trend Analysis ➞ | |
| For tabular summary view of above stock list: Summary View ➞ 0 - 25 , 25 - 50 , 50 - 75 , 75 - 100 , 100 - 125 , 125 - 150 , 150 - 175 , 175 - 200 , 200 - 225 , 225 - 250 , 250 - 275 , 275 - 300 , 300 - 325 , 325 - 350 , 350 - 375 , 375 - 400 , 400 - 425 , 425 - 450 , 450 - 475 , 475 - 500 , 500 - 525 , 525 - 550 , 550 - 575 , 575 - 600 , 600 - 625 , 625 - 650 , 650 - 675 , 675 - 700 , 700 - 725 | ||
| Click To Change The Sort Order: By Market Cap or Company Size Performance: Year-to-date, Week and Day | |
| Select Chart Type: | ||
|
Best Stocks Today 12Stocks.com |
© 2024 12Stocks.com Terms & Conditions Privacy Contact Us
All Information Provided Only For Education And Not To Be Used For Investing or Trading. See Terms & Conditions


One More Thing ... Get Best Stocks Delivered Daily!
Never Ever Miss A Move With Our Top Ten Stocks Lists
Find Best Stocks In Any Market - Bull or Bear Market
Take A Peek At Our Top Ten Stocks Lists: Daily, Weekly, Year-to-Date & Top Trends
Find Best Stocks In Any Market - Bull or Bear Market
Take A Peek At Our Top Ten Stocks Lists: Daily, Weekly, Year-to-Date & Top Trends
Healthcare Stocks With Best Up Trends [0-bearish to 100-bullish]: Annovis Bio[100], Cullinan Oncology[100], ResMed [100], Haemonetics [100], Brookdale Senior[100], Pieris [100], Merck [100], AstraZeneca [100], Avadel [100], Glaukos [100], Oscar Health[100]
Best Healthcare Stocks Year-to-Date:
Pieris [6339.56%], Avenue [3688.82%], Precision BioSciences[2469.86%], Inovio [1972.55%], Assembly Biosciences[1442.49%], Agenus [1312.01%], Aurora Cannabis[1306.97%], NuCana [1252.27%], Adverum Biotechnologies[1120.78%], Affimed N.V[704.8%], CareMax [568.04%] Best Healthcare Stocks This Week:
Pieris [7982.76%], Avenue [4610.42%], Agenus [120.15%], Annovis Bio[72.7%], Cullinan Oncology[60.86%], VolitionRx [48.33%], Seres [47.35%], Zura Bio[38.67%], IGM Biosciences[30.56%], CareMax [26.07%], Sharecare [23.65%] Best Healthcare Stocks Daily:
Avenue [6753.93%], Agenus [40.84%], Annovis Bio[32.85%], Zura Bio[31.90%], Cullinan Oncology[30.86%], IGM Biosciences[23.36%], ResMed [18.89%], Concord [17.13%], Zhongchao [15.95%], Black Diamond[15.26%], CareMax [13.09%]