
 Login Sign Up


| |||||
 |  | ||||

| 12Stocks.com Market Intelligence |
Best Healthcare Stocks
 | "Discover best trending healthcare stocks with 12Stocks.com." |
| - Subu Vdaygiri, Founder, 12Stocks.com |
| In a hurry? Healthcare Stocks Lists: Performance Trends Table, Stock Charts
Sort Healthcare stocks: Daily, Weekly, Year-to-Date, Market Cap & Trends. Filter Healthcare stocks list by size:All Healthcare Large Mid-Range Small |
| 12Stocks.com Healthcare Stocks Performances & Trends Daily | |||||||||
|
|  The overall Smart Investing & Trading Score is 52 (0-bearish to 100-bullish) which puts Healthcare sector in short term neutral trend. The Smart Investing & Trading Score from previous trading session is 38 and hence an improvement of trend.
| ||||||||
Here are the Smart Investing & Trading Scores of the most requested Healthcare stocks at 12Stocks.com (click stock name for detailed review):
|


| 12Stocks.com: Investing in Healthcare sector with Stocks | |
|
The following table helps investors and traders sort through current performance and trends (as measured by Smart Investing & Trading Score) of various
stocks in the Healthcare sector. Quick View: Move mouse or cursor over stock symbol (ticker) to view short-term Technical chart and over stock name to view long term chart. Click on  to add stock symbol to your watchlist and to add stock symbol to your watchlist and  to view watchlist. Click on any ticker or stock name for detailed market intelligence report for that stock. to view watchlist. Click on any ticker or stock name for detailed market intelligence report for that stock. |
12Stocks.com Performance of Stocks in Healthcare Sector
| Ticker | Stock Name | Watchlist | Category | Recent Price | Smart Investing & Trading Score | Change % | YTD Change% |
| SIGA | SIGA Technologies |   | Biotechnology | 8.77 | 68 | 4.97 | 56.52% |
| DYN | Dyne | | Biotechnology | 26.10 | 27 | 4.95 | 96.24% |
| ABOS | Acumen | | Biotechnology | 3.29 | 63 | 4.95 | -14.45% |
| BRKR | Bruker | | Laboratories | 81.90 | 58 | 4.93 | 11.46% |
| MGNX | MacroGenics | | Biotechnology | 16.17 | 56 | 4.93 | 68.09% |
| ADMA | ADMA Biologics | | Biotechnology | 6.50 | 90 | 4.92 | 43.92% |
| MLTX | MoonLake Immuno | | Biotechnology | 43.03 | 27 | 4.90 | -31.46% |
| CRSP | CRISPR | | Biotechnology | 58.38 | 32 | 4.89 | -6.74% |
| CRBU | Caribou Biosciences | | Biotechnology | 4.18 | 42 | 4.89 | -26.71% |
| FGEN | FibroGen | | Biotechnology | 1.20 | 42 | 4.82 | 34.83% |
| CGEN | Compugen | | Biotechnology | 1.98 | 32 | 4.76 | 0.00% |
| DGX | Quest Diagnostics | | Laboratories | 136.25 | 100 | 4.74 | -1.18% |
| INO | Inovio | | Biotechnology | 10.49 | 68 | 4.74 | NA |
| NBIX | Neurocrine Biosciences | | Biotechnology | 139.95 | 82 | 4.71 | 6.22% |
| ZURA | Zura Bio | | Biotechnology | 3.46 | 66 | 4.68 | -26.04% |
| LBPH | Longboard | | Biotechnology | 19.53 | 64 | 4.61 | 219.64% |
| HUMA | Humacyte | | Biotechnology | 3.87 | 81 | 4.46 | 36.09% |
| NUVL | Nuvalent | | Biotechnology | 67.36 | 49 | 4.46 | -8.33% |
| NEOG | Neogen | | Diagnostic | 12.30 | 42 | 4.41 | -38.84% |
| HLTH | Nobilis Health | | Hospitals | 0.14 | 42 | 4.32 | -10.77% |
| ME | 23andMe Holding | | Diagnostics & Research | 0.48 | 20 | 4.26 | -46.15% |
| WVE | Wave Life | | Biotechnology | 5.04 | 58 | 4.24 | -0.10% |
| WAT | Waters | | Instruments | 311.85 | 32 | 4.22 | -5.28% |
| OMER | Omeros | | Biotechnology | 3.21 | 17 | 4.22 | -1.83% |
| SANA | Sana Biotechnology | | Biotechnology | 8.27 | 58 | 4.22 | 99.88% |
| For chart view version of above stock list: Chart View ➞ 0 - 25 , 25 - 50 , 50 - 75 , 75 - 100 , 100 - 125 , 125 - 150 , 150 - 175 , 175 - 200 , 200 - 225 , 225 - 250 , 250 - 275 , 275 - 300 , 300 - 325 , 325 - 350 , 350 - 375 , 375 - 400 , 400 - 425 , 425 - 450 , 450 - 475 | ||
 | Click To Change The Sort Order: By Market Cap or Company Size Performance: Year-to-date, Week and Day |  |
|
Get the most comprehensive stock market coverage daily at 12Stocks.com ➞ Best Stocks Today ➞ Best Stocks Weekly ➞ Best Stocks Year-to-Date ➞ Best Stocks Trends ➞  Best Stocks Today 12Stocks.com Best Nasdaq Stocks ➞ Best S&P 500 Stocks ➞ Best Tech Stocks ➞ Best Biotech Stocks ➞ |
| Detailed Overview of Healthcare Stocks |
| Healthcare Technical Overview, Leaders & Laggards, Top Healthcare ETF Funds & Detailed Healthcare Stocks List, Charts, Trends & More |
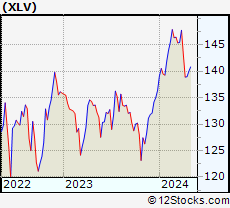
| Healthcare Sector: Technical Analysis, Trends & YTD Performance | |
| Healthcare sector is composed of stocks
from pharmaceutical, biotech, diagnostics labs, insurance providers
and healthcare services. Healthcare sector, as represented by XLV, an exchange-traded fund [ETF] that holds basket of Healthcare stocks (e.g, Merck, Amgen) is up by 3.46% and is currently underperforming the overall market by -2.03% year-to-date. Below is a quick view of Technical charts and trends: |
|
 XLV Weekly Chart |
|
| Long Term Trend: Good | |
| Medium Term Trend: Not Good | |
 XLV Daily Chart |
|
| Short Term Trend: Very Good | |
| Overall Trend Score: 52 | |
| YTD Performance: 3.46% | |
| **Trend Scores & Views Are Only For Educational Purposes And Not For Investing | |
| 12Stocks.com: Top Performing Healthcare Sector Stocks | ||||||||||||||||||||||||||||||||||||||||||||||||
 The top performing Healthcare sector stocks year to date are
Now, more recently, over last week, the top performing Healthcare sector stocks on the move are


|
||||||||||||||||||||||||||||||||||||||||||||||||
| 12Stocks.com: Investing in Healthcare Sector using Exchange Traded Funds | |
|
The following table shows list of key exchange traded funds (ETF) that
help investors track Healthcare Index. For detailed view, check out our ETF Funds section of our website. Quick View: Move mouse or cursor over ETF symbol (ticker) to view short-term Technical chart and over ETF name to view long term chart. Click on ticker or stock name for detailed view. Click on to add stock symbol to your watchlist and to view watchlist. |
12Stocks.com List of ETFs that track Healthcare Index
| Ticker | ETF Name | Watchlist | Recent Price | Smart Investing & Trading Score | Change % | Week % | Year-to-date % |
| XLV | Health Care | | 141.10 | 52 | 1.16 | 1.55 | 3.46% |
| XBI | Biotech | | 85.97 | 32 | 3.82 | 3.79 | -3.72% |
| IBB | Biotechnology | | 128.51 | 32 | 1.90 | 3.03 | -5.41% |
| BBH | Biotech | | 157.27 | 42 | 1.75 | 3.22 | -4.86% |
| VHT | Health Care | | 257.77 | 52 | 1.27 | 1.75 | 2.82% |
| IYH | Healthcare | | 59.25 | 65 | 1.40 | 1.87 | 3.5% |
| IHF | Healthcare Providers | | 52.59 | 90 | 0.99 | 0.73 | 0.15% |
| IHI | Medical Devices | | 55.20 | 37 | 0.91 | 1.55 | 2.28% |
| BIB | Biotechnology | | 50.72 | 49 | 3.30 | 5.23 | -11.1% |
| BIS | Short Biotech | | 19.81 | 63 | -3.22 | -5.19 | 9.63% |
| XHE | Health Care Equipment | | 82.78 | 42 | 1.35 | 1.86 | -1.75% |
| CURE | Healthcare Bull 3X | | 108.27 | 39 | 3.66 | 4.78 | 6.42% |
| LABU | Biotech Bull 3X | | 95.31 | 32 | 10.28 | 10.77 | -21.85% |
| LABD | Biotech Bear 3X | | 9.59 | 42 | -10.79 | -11.2 | -1.03% |
| PSCH | SmallCap Health Care | | 40.42 | 35 | 0.07 | 0.6 | -5.56% |
| XHS | Health Care Services | | 88.61 | 75 | 1.33 | 1.75 | -0.38% |
| RXL | Health Care | | 95.83 | 39 | 0.53 | 2.79 | 4.84% |
| 12Stocks.com: Charts, Trends, Fundamental Data and Performances of Healthcare Stocks | |
|
We now take in-depth look at all Healthcare stocks including charts, multi-period performances and overall trends (as measured by Smart Investing & Trading Score). One can sort Healthcare stocks (click link to choose) by Daily, Weekly and by Year-to-Date performances. Also, one can sort by size of the company or by market capitalization. |
| Select Your Default Chart Type: | |||||
| |||||
| Click on stock symbol or name for detailed view. Click on to add stock symbol to your watchlist and to view watchlist. Quick View: Move mouse or cursor over "Daily" to quickly view daily Technical stock chart and over "Weekly" to view weekly Technical stock chart. | |||||

 | SIGA SIGA Technologies, Inc. |
| Sector: Health Care | |
| SubSector: Biotechnology | |
| MarketCap: 424.285 Millions | |
| Recent Price: 8.77 Smart Investing & Trading Score: 68 | |
| Day Percent Change: 4.97% Day Change: 0.42 | |
| Week Change: 5.1% Year-to-date Change: 56.5% | |
| SIGA Links: Profile News Message Board | |
| Charts:- Daily , Weekly | |
| Add SIGA to Watchlist: View: Get Complete SIGA Trend Analysis ➞ | |
 | DYN Dyne Therapeutics, Inc. |
| Sector: Health Care | |
| SubSector: Biotechnology | |
| MarketCap: 88487 Millions | |
| Recent Price: 26.10 Smart Investing & Trading Score: 27 | |
| Day Percent Change: 4.95% Day Change: 1.23 | |
| Week Change: 9.39% Year-to-date Change: 96.2% | |
| DYN Links: Profile News Message Board | |
| Charts:- Daily , Weekly | |
| Add DYN to Watchlist: View: Get Complete DYN Trend Analysis ➞ | |
 | ABOS Acumen Pharmaceuticals, Inc. |
| Sector: Health Care | |
| SubSector: Biotechnology | |
| MarketCap: 199 Millions | |
| Recent Price: 3.29 Smart Investing & Trading Score: 63 | |
| Day Percent Change: 4.95% Day Change: 0.16 | |
| Week Change: 4.29% Year-to-date Change: -14.5% | |
| ABOS Links: Profile News Message Board | |
| Charts:- Daily , Weekly | |
| Add ABOS to Watchlist: View: Get Complete ABOS Trend Analysis ➞ | |
 | BRKR Bruker Corporation |
| Sector: Health Care | |
| SubSector: Medical Laboratories & Research | |
| MarketCap: 5932 Millions | |
| Recent Price: 81.90 Smart Investing & Trading Score: 58 | |
| Day Percent Change: 4.93% Day Change: 3.85 | |
| Week Change: 5.32% Year-to-date Change: 11.5% | |
| BRKR Links: Profile News Message Board | |
| Charts:- Daily , Weekly | |
| Add BRKR to Watchlist: View: Get Complete BRKR Trend Analysis ➞ | |
 | MGNX MacroGenics, Inc. |
| Sector: Health Care | |
| SubSector: Biotechnology | |
| MarketCap: 262.785 Millions | |
| Recent Price: 16.17 Smart Investing & Trading Score: 56 | |
| Day Percent Change: 4.93% Day Change: 0.76 | |
| Week Change: 3.59% Year-to-date Change: 68.1% | |
| MGNX Links: Profile News Message Board | |
| Charts:- Daily , Weekly | |
| Add MGNX to Watchlist: View: Get Complete MGNX Trend Analysis ➞ | |
 | ADMA ADMA Biologics, Inc. |
| Sector: Health Care | |
| SubSector: Biotechnology | |
| MarketCap: 204.985 Millions | |
| Recent Price: 6.50 Smart Investing & Trading Score: 90 | |
| Day Percent Change: 4.92% Day Change: 0.30 | |
| Week Change: 3.75% Year-to-date Change: 43.9% | |
| ADMA Links: Profile News Message Board | |
| Charts:- Daily , Weekly | |
| Add ADMA to Watchlist: View: Get Complete ADMA Trend Analysis ➞ | |
 | MLTX MoonLake Immunotherapeutics |
| Sector: Health Care | |
| SubSector: Biotechnology | |
| MarketCap: 2670 Millions | |
| Recent Price: 43.03 Smart Investing & Trading Score: 27 | |
| Day Percent Change: 4.90% Day Change: 2.01 | |
| Week Change: 1.99% Year-to-date Change: -31.5% | |
| MLTX Links: Profile News Message Board | |
| Charts:- Daily , Weekly | |
| Add MLTX to Watchlist: View: Get Complete MLTX Trend Analysis ➞ | |
 | CRSP CRISPR Therapeutics AG |
| Sector: Health Care | |
| SubSector: Biotechnology | |
| MarketCap: 2691.35 Millions | |
| Recent Price: 58.38 Smart Investing & Trading Score: 32 | |
| Day Percent Change: 4.89% Day Change: 2.72 | |
| Week Change: 6.05% Year-to-date Change: -6.7% | |
| CRSP Links: Profile News Message Board | |
| Charts:- Daily , Weekly | |
| Add CRSP to Watchlist: View: Get Complete CRSP Trend Analysis ➞ | |
 | CRBU Caribou Biosciences, Inc. |
| Sector: Health Care | |
| SubSector: Biotechnology | |
| MarketCap: 258 Millions | |
| Recent Price: 4.18 Smart Investing & Trading Score: 42 | |
| Day Percent Change: 4.89% Day Change: 0.19 | |
| Week Change: 8.7% Year-to-date Change: -26.7% | |
| CRBU Links: Profile News Message Board | |
| Charts:- Daily , Weekly | |
| Add CRBU to Watchlist: View: Get Complete CRBU Trend Analysis ➞ | |
 | FGEN FibroGen, Inc. |
| Sector: Health Care | |
| SubSector: Biotechnology | |
| MarketCap: 2502.95 Millions | |
| Recent Price: 1.20 Smart Investing & Trading Score: 42 | |
| Day Percent Change: 4.82% Day Change: 0.06 | |
| Week Change: 3.91% Year-to-date Change: 34.8% | |
| FGEN Links: Profile News Message Board | |
| Charts:- Daily , Weekly | |
| Add FGEN to Watchlist: View: Get Complete FGEN Trend Analysis ➞ | |
 | CGEN Compugen Ltd. |
| Sector: Health Care | |
| SubSector: Biotechnology | |
| MarketCap: 634.285 Millions | |
| Recent Price: 1.98 Smart Investing & Trading Score: 32 | |
| Day Percent Change: 4.76% Day Change: 0.09 | |
| Week Change: 4.21% Year-to-date Change: 0.0% | |
| CGEN Links: Profile News Message Board | |
| Charts:- Daily , Weekly | |
| Add CGEN to Watchlist: View: Get Complete CGEN Trend Analysis ➞ | |
 | DGX Quest Diagnostics Incorporated |
| Sector: Health Care | |
| SubSector: Medical Laboratories & Research | |
| MarketCap: 11076.1 Millions | |
| Recent Price: 136.25 Smart Investing & Trading Score: 100 | |
| Day Percent Change: 4.74% Day Change: 6.16 | |
| Week Change: 6.08% Year-to-date Change: -1.2% | |
| DGX Links: Profile News Message Board | |
| Charts:- Daily , Weekly | |
| Add DGX to Watchlist: View: Get Complete DGX Trend Analysis ➞ | |
 | INO Inovio Pharmaceuticals, Inc. |
| Sector: Health Care | |
| SubSector: Biotechnology | |
| MarketCap: 876.385 Millions | |
| Recent Price: 10.49 Smart Investing & Trading Score: 68 | |
| Day Percent Change: 4.74% Day Change: 0.47 | |
| Week Change: 8.42% Year-to-date Change: 1,957.8% | |
| INO Links: Profile News Message Board | |
| Charts:- Daily , Weekly | |
| Add INO to Watchlist: View: Get Complete INO Trend Analysis ➞ | |
 | NBIX Neurocrine Biosciences, Inc. |
| Sector: Health Care | |
| SubSector: Biotechnology | |
| MarketCap: 7897.85 Millions | |
| Recent Price: 139.95 Smart Investing & Trading Score: 82 | |
| Day Percent Change: 4.71% Day Change: 6.29 | |
| Week Change: 6.02% Year-to-date Change: 6.2% | |
| NBIX Links: Profile News Message Board | |
| Charts:- Daily , Weekly | |
| Add NBIX to Watchlist: View: Get Complete NBIX Trend Analysis ➞ | |
 | ZURA Zura Bio Limited |
| Sector: Health Care | |
| SubSector: Biotechnology | |
| MarketCap: 242 Millions | |
| Recent Price: 3.46 Smart Investing & Trading Score: 66 | |
| Day Percent Change: 4.68% Day Change: 0.15 | |
| Week Change: 4.68% Year-to-date Change: -26.0% | |
| ZURA Links: Profile News Message Board | |
| Charts:- Daily , Weekly | |
| Add ZURA to Watchlist: View: Get Complete ZURA Trend Analysis ➞ | |
 | LBPH Longboard Pharmaceuticals, Inc. |
| Sector: Health Care | |
| SubSector: Biotechnology | |
| MarketCap: 169 Millions | |
| Recent Price: 19.53 Smart Investing & Trading Score: 64 | |
| Day Percent Change: 4.61% Day Change: 0.86 | |
| Week Change: 11.98% Year-to-date Change: 219.6% | |
| LBPH Links: Profile News Message Board | |
| Charts:- Daily , Weekly | |
| Add LBPH to Watchlist: View: Get Complete LBPH Trend Analysis ➞ | |
 | HUMA Humacyte, Inc. |
| Sector: Health Care | |
| SubSector: Biotechnology | |
| MarketCap: 297 Millions | |
| Recent Price: 3.87 Smart Investing & Trading Score: 81 | |
| Day Percent Change: 4.46% Day Change: 0.17 | |
| Week Change: 4.46% Year-to-date Change: 36.1% | |
| HUMA Links: Profile News Message Board | |
| Charts:- Daily , Weekly | |
| Add HUMA to Watchlist: View: Get Complete HUMA Trend Analysis ➞ | |
 | NUVL Nuvalent, Inc. |
| Sector: Health Care | |
| SubSector: Biotechnology | |
| MarketCap: 2400 Millions | |
| Recent Price: 67.36 Smart Investing & Trading Score: 49 | |
| Day Percent Change: 4.46% Day Change: 2.88 | |
| Week Change: 7.34% Year-to-date Change: -8.3% | |
| NUVL Links: Profile News Message Board | |
| Charts:- Daily , Weekly | |
| Add NUVL to Watchlist: View: Get Complete NUVL Trend Analysis ➞ | |
 | NEOG Neogen Corporation |
| Sector: Health Care | |
| SubSector: Diagnostic Substances | |
| MarketCap: 3234.71 Millions | |
| Recent Price: 12.30 Smart Investing & Trading Score: 42 | |
| Day Percent Change: 4.41% Day Change: 0.52 | |
| Week Change: 5.94% Year-to-date Change: -38.8% | |
| NEOG Links: Profile News Message Board | |
| Charts:- Daily , Weekly | |
| Add NEOG to Watchlist: View: Get Complete NEOG Trend Analysis ➞ | |
 | HLTH Nobilis Health Corp. |
| Sector: Health Care | |
| SubSector: Hospitals | |
| MarketCap: 124.22 Millions | |
| Recent Price: 0.14 Smart Investing & Trading Score: 42 | |
| Day Percent Change: 4.32% Day Change: 0.01 | |
| Week Change: -0.07% Year-to-date Change: -10.8% | |
| HLTH Links: Profile News Message Board | |
| Charts:- Daily , Weekly | |
| Add HLTH to Watchlist: View: Get Complete HLTH Trend Analysis ➞ | |
 | ME 23andMe Holding Co. |
| Sector: Health Care | |
| SubSector: Diagnostics & Research | |
| MarketCap: 802 Millions | |
| Recent Price: 0.48 Smart Investing & Trading Score: 20 | |
| Day Percent Change: 4.26% Day Change: 0.02 | |
| Week Change: -0.6% Year-to-date Change: -46.2% | |
| ME Links: Profile News Message Board | |
| Charts:- Daily , Weekly | |
| Add ME to Watchlist: View: Get Complete ME Trend Analysis ➞ | |
 | WVE Wave Life Sciences Ltd. |
| Sector: Health Care | |
| SubSector: Biotechnology | |
| MarketCap: 452.785 Millions | |
| Recent Price: 5.04 Smart Investing & Trading Score: 58 | |
| Day Percent Change: 4.24% Day Change: 0.21 | |
| Week Change: 3.59% Year-to-date Change: -0.1% | |
| WVE Links: Profile News Message Board | |
| Charts:- Daily , Weekly | |
| Add WVE to Watchlist: View: Get Complete WVE Trend Analysis ➞ | |
 | WAT Waters Corporation |
| Sector: Health Care | |
| SubSector: Medical Instruments & Supplies | |
| MarketCap: 11882 Millions | |
| Recent Price: 311.85 Smart Investing & Trading Score: 32 | |
| Day Percent Change: 4.22% Day Change: 12.62 | |
| Week Change: 5.32% Year-to-date Change: -5.3% | |
| WAT Links: Profile News Message Board | |
| Charts:- Daily , Weekly | |
| Add WAT to Watchlist: View: Get Complete WAT Trend Analysis ➞ | |
 | OMER Omeros Corporation |
| Sector: Health Care | |
| SubSector: Biotechnology | |
| MarketCap: 759.585 Millions | |
| Recent Price: 3.21 Smart Investing & Trading Score: 17 | |
| Day Percent Change: 4.22% Day Change: 0.13 | |
| Week Change: 5.25% Year-to-date Change: -1.8% | |
| OMER Links: Profile News Message Board | |
| Charts:- Daily , Weekly | |
| Add OMER to Watchlist: View: Get Complete OMER Trend Analysis ➞ | |
 | SANA Sana Biotechnology, Inc. |
| Sector: Health Care | |
| SubSector: Biotechnology | |
| MarketCap: 1210 Millions | |
| Recent Price: 8.27 Smart Investing & Trading Score: 58 | |
| Day Percent Change: 4.22% Day Change: 0.34 | |
| Week Change: 8.61% Year-to-date Change: 99.9% | |
| SANA Links: Profile News Message Board | |
| Charts:- Daily , Weekly | |
| Add SANA to Watchlist: View: Get Complete SANA Trend Analysis ➞ | |
| For tabular summary view of above stock list: Summary View ➞ 0 - 25 , 25 - 50 , 50 - 75 , 75 - 100 , 100 - 125 , 125 - 150 , 150 - 175 , 175 - 200 , 200 - 225 , 225 - 250 , 250 - 275 , 275 - 300 , 300 - 325 , 325 - 350 , 350 - 375 , 375 - 400 , 400 - 425 , 425 - 450 , 450 - 475 | ||
| Click To Change The Sort Order: By Market Cap or Company Size Performance: Year-to-date, Week and Day | |
| Select Chart Type: | ||
|
Best Stocks Today 12Stocks.com |
© 2024 12Stocks.com Terms & Conditions Privacy Contact Us
All Information Provided Only For Education And Not To Be Used For Investing or Trading. See Terms & Conditions


One More Thing ... Get Best Stocks Delivered Daily!
Never Ever Miss A Move With Our Top Ten Stocks Lists
Find Best Stocks In Any Market - Bull or Bear Market
Take A Peek At Our Top Ten Stocks Lists: Daily, Weekly, Year-to-Date & Top Trends
Find Best Stocks In Any Market - Bull or Bear Market
Take A Peek At Our Top Ten Stocks Lists: Daily, Weekly, Year-to-Date & Top Trends
Healthcare Stocks With Best Up Trends [0-bearish to 100-bullish]: Pieris [100], PureTech Health[100], NewAmsterdam Pharma[100], BioLife [100], Oscar Health[100], Quest Diagnostics[100], Avadel [100], Fresenius [100], Agios [100], BioMarin [100], Centene [100]
Best Healthcare Stocks Year-to-Date:
Pieris [6658.24%], Inovio [1957.84%], Assembly Biosciences[1483.95%], Adverum Biotechnologies[1435.6%], Affimed N.V[700%], Agenus [656.13%], CareMax [611.34%], Corbus [540.23%], Mesoblast [449.09%], Janux [365.24%], GeneDx [313.24%] Best Healthcare Stocks This Week:
Pieris [8382.76%], Regencell Bioscience[41.62%], MSP Recovery[39.24%], CareMax [34.24%], VolitionRx [31.53%], ProKidney [25.74%], Seres [21.4%], Agenus [17.89%], Molecular Partners[16.87%], GeneDx [16.6%], Syros [15.97%] Best Healthcare Stocks Daily:
Pieris [8318.89%], VolitionRx [34.50%], Regencell Bioscience[22.05%], Heron [17.95%], PureTech Health[10.55%], Summit [9.31%], Mesoblast [9.22%], Repligen [8.96%], Seres [8.82%], Agenus [8.49%], MSP Recovery[8.20%]