
 Login Sign Up


| |||||
 |  | ||||

| 12Stocks.com Market Intelligence |
Best Healthcare Stocks
 | "Discover best trending healthcare stocks with 12Stocks.com." |
| - Subu Vdaygiri, Founder, 12Stocks.com |
| In a hurry? Healthcare Stocks Lists: Performance Trends Table, Stock Charts
Sort Healthcare stocks: Daily, Weekly, Year-to-Date, Market Cap & Trends. Filter Healthcare stocks list by size:All Healthcare Large Mid-Range Small |
| 12Stocks.com Healthcare Stocks Performances & Trends Daily | |||||||||
|
|  The overall Smart Investing & Trading Score is 100 (0-bearish to 100-bullish) which puts Healthcare sector in short term bullish trend. The Smart Investing & Trading Score from previous trading session is 70 and an improvement of trend continues.
| ||||||||
Here are the Smart Investing & Trading Scores of the most requested Healthcare stocks at 12Stocks.com (click stock name for detailed review):
|


| 12Stocks.com: Investing in Healthcare sector with Stocks | |
|
The following table helps investors and traders sort through current performance and trends (as measured by Smart Investing & Trading Score) of various
stocks in the Healthcare sector. Quick View: Move mouse or cursor over stock symbol (ticker) to view short-term Technical chart and over stock name to view long term chart. Click on  to add stock symbol to your watchlist and to add stock symbol to your watchlist and  to view watchlist. Click on any ticker or stock name for detailed market intelligence report for that stock. to view watchlist. Click on any ticker or stock name for detailed market intelligence report for that stock. |
12Stocks.com Performance of Stocks in Healthcare Sector
| Ticker | Stock Name | Watchlist | Category | Recent Price | Smart Investing & Trading Score | Change % | Weekly Change% |
| LOGC | LogicBio |   | Biotechnology | 7.41 | 30 | -0.54% | 0.14% |
| PINC | Premier | | Health Information | 27.83 | 70 | 0.11% | 0.14% |
| GTHX | G1 | | Biotechnology | 7.15 | 50 | 0.00% | 0.14% |
| NARI | Inari | | Medical Devices | 79.97 | 60 | 0.00% | 0.14% |
| ITCI | Intra-Cellular Therapies | | Biotechnology | 131.87 | 50 | -0.04% | 0.13% |
| CMRX | Chimerix | | Biotechnology | 8.54 | 50 | -0.12% | 0.12% |
| ITGR | Integer | | Medical Devices | 103.09 | 60 | 0.17% | 0.12% |
| DCPH | Deciphera | | Biotechnology | 25.59 | 60 | 0.00% | 0.12% |
| NVST | Envista | | Instruments | 20.57 | 50 | 1.03% | 0.10% |
| TNXP | Tonix | | Biotechnology | 24.72 | 10 | 1.54% | 0.08% |
| XOMAO | XOMA | | Biotechnology | 25.39 | 40 | -0.70% | 0.08% |
| COR | Cencora | | Medical Distribution | 308.57 | 60 | -1.03% | 0.07% |
| TBPH | Theravance Biopharma | | Biotechnology | 14.06 | 40 | -2.50% | 0.07% |
| SWTX | SpringWorks | | Biotechnology | 46.99 | 50 | 0.02% | 0.06% |
| IRTC | iRhythm Technologies | | Medical Devices | 174.00 | 70 | 3.91% | 0.04% |
| LH | Labcorp | | Diagnostics & Research | 279.44 | 40 | 0.14% | 0.03% |
| PPD | PPD | | Drug Manufacturers Specialty & Generic | 47.28 | 30 | 0.00% | 0.00% |
| TARO | Taro | | Pharmaceutical | 42.97 | 20 | 0.00% | 0.00% |
| PKI | PerkinElmer | | Laboratories | 115.24 | 10 | 0.00% | 0.00% |
| STSA | Satsuma | | Biotechnology | 1.10 | 30 | 0.00% | 0.00% |
| DEPO | Depomed | | Pharmaceutical | 7.30 | 0 | 0.00% | 0.00% |
| PPHM | Peregrine | | Biotechnology | 4.22 | 10 | 0.00% | 0.00% |
| ABMD | Abiomed | | Equipment | 381.02 | 30 | 0.00% | 0.00% |
| QSII | Quality Systems | | HealthcareIT | 22.35 | 20 | 0.00% | 0.00% |
| NVO | Novo Nordisk | | Drug Manufacturers - General | 58.74 | 90 | -0.73% | 0.00% |
| For chart view version of above stock list: Chart View ➞ 0 - 25 , 25 - 50 , 50 - 75 , 75 - 100 , 100 - 125 , 125 - 150 , 150 - 175 , 175 - 200 , 200 - 225 , 225 - 250 , 250 - 275 , 275 - 300 , 300 - 325 , 325 - 350 , 350 - 375 , 375 - 400 , 400 - 425 , 425 - 450 , 450 - 475 , 475 - 500 , 500 - 525 , 525 - 550 , 550 - 575 , 575 - 600 , 600 - 625 , 625 - 650 , 650 - 675 , 675 - 700 , 700 - 725 , 725 - 750 , 750 - 775 , 775 - 800 , 800 - 825 , 825 - 850 , 850 - 875 , 875 - 900 , 900 - 925 , 925 - 950 , 950 - 975 , 975 - 1000 | ||
 | Click To Change The Sort Order: By Market Cap or Company Size Performance: Year-to-date, Week and Day |  |
|
Get the most comprehensive stock market coverage daily at 12Stocks.com ➞ Best Stocks Today ➞ Best Stocks Weekly ➞ Best Stocks Year-to-Date ➞ Best Stocks Trends ➞  Best Stocks Today 12Stocks.com Best Nasdaq Stocks ➞ Best S&P 500 Stocks ➞ Best Tech Stocks ➞ Best Biotech Stocks ➞ |
| Detailed Overview of Healthcare Stocks |
| Healthcare Technical Overview, Leaders & Laggards, Top Healthcare ETF Funds & Detailed Healthcare Stocks List, Charts, Trends & More |
| Healthcare Sector: Technical Analysis, Trends & YTD Performance | |
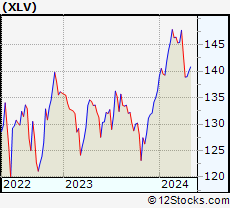
| Healthcare sector is composed of stocks
from pharmaceutical, biotech, diagnostics labs, insurance providers
and healthcare services. Healthcare sector, as represented by XLV, an exchange-traded fund [ETF] that holds basket of Healthcare stocks (e.g, Merck, Amgen) is up by 4.95646% and is currently underperforming the overall market by -9.80144% year-to-date. Below is a quick view of Technical charts and trends: |
|
 XLV Weekly Chart |
|
| Long Term Trend: Very Good | |
| Medium Term Trend: Very Good | |
 XLV Daily Chart |
|
| Short Term Trend: Very Good | |
| Overall Trend Score: 100 | |
| YTD Performance: 4.95646% | |
| **Trend Scores & Views Are Only For Educational Purposes And Not For Investing | |
| 12Stocks.com: Top Performing Healthcare Sector Stocks | ||||||||||||||||||||||||||||||||||||||||||||||
 The top performing Healthcare sector stocks year to date are
Now, more recently, over last week, the top performing Healthcare sector stocks on the move are


|
||||||||||||||||||||||||||||||||||||||||||||||
| 12Stocks.com: Investing in Healthcare Sector using Exchange Traded Funds | |
|
The following table shows list of key exchange traded funds (ETF) that
help investors track Healthcare Index. For detailed view, check out our ETF Funds section of our website. Quick View: Move mouse or cursor over ETF symbol (ticker) to view short-term Technical chart and over ETF name to view long term chart. Click on ticker or stock name for detailed view. Click on to add stock symbol to your watchlist and to view watchlist. |
12Stocks.com List of ETFs that track Healthcare Index
| Ticker | ETF Name | Watchlist | Recent Price | Smart Investing & Trading Score | Change % | Week % | Year-to-date % |
| BTEC | Principal Healthcare Innovators | | 39.49 | 30 | 0 | 1.02328 | 0% |
| 12Stocks.com: Charts, Trends, Fundamental Data and Performances of Healthcare Stocks | |
|
We now take in-depth look at all Healthcare stocks including charts, multi-period performances and overall trends (as measured by Smart Investing & Trading Score). One can sort Healthcare stocks (click link to choose) by Daily, Weekly and by Year-to-Date performances. Also, one can sort by size of the company or by market capitalization. |
| Select Your Default Chart Type: | |||||
| |||||
| Click on stock symbol or name for detailed view. Click on to add stock symbol to your watchlist and to view watchlist. Quick View: Move mouse or cursor over "Daily" to quickly view daily Technical stock chart and over "Weekly" to view weekly Technical stock chart. | |||||

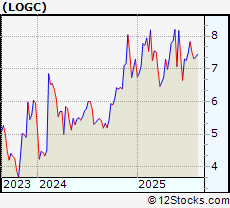 | LOGC LogicBio Therapeutics, Inc. |
| Sector: Health Care | |
| SubSector: Biotechnology | |
| MarketCap: 203.485 Millions | |
| Recent Price: 7.41 Smart Investing & Trading Score: 30 | |
| Day Percent Change: -0.536913% Day Change: -9999 | |
| Week Change: 0.135135% Year-to-date Change: 6.9% | |
| LOGC Links: Profile News Message Board | |
| Charts:- Daily , Weekly | |
| Add LOGC to Watchlist: View: Get Complete LOGC Trend Analysis ➞ | |
 | PINC Premier Inc |
| Sector: Health Care | |
| SubSector: Health Information Services | |
| MarketCap: 2133.91 Millions | |
| Recent Price: 27.83 Smart Investing & Trading Score: 70 | |
| Day Percent Change: 0.107914% Day Change: -0.03 | |
| Week Change: 0.143937% Year-to-date Change: 33.0% | |
| PINC Links: Profile News Message Board | |
| Charts:- Daily , Weekly | |
| Add PINC to Watchlist: View: Get Complete PINC Trend Analysis ➞ | |
 | GTHX G1 Therapeutics, Inc. |
| Sector: Health Care | |
| SubSector: Biotechnology | |
| MarketCap: 484.085 Millions | |
| Recent Price: 7.15 Smart Investing & Trading Score: 50 | |
| Day Percent Change: 0% Day Change: -9999 | |
| Week Change: 0.140056% Year-to-date Change: 0.0% | |
| GTHX Links: Profile News Message Board | |
| Charts:- Daily , Weekly | |
| Add GTHX to Watchlist: View: Get Complete GTHX Trend Analysis ➞ | |
 | NARI Inari Medical, Inc. |
| Sector: Health Care | |
| SubSector: Medical Devices | |
| MarketCap: 33287 Millions | |
| Recent Price: 79.97 Smart Investing & Trading Score: 60 | |
| Day Percent Change: 0% Day Change: -9999 | |
| Week Change: 0.137741% Year-to-date Change: 54.4% | |
| NARI Links: Profile News Message Board | |
| Charts:- Daily , Weekly | |
| Add NARI to Watchlist: View: Get Complete NARI Trend Analysis ➞ | |
 | ITCI Intra-Cellular Therapies, Inc. |
| Sector: Health Care | |
| SubSector: Biotechnology | |
| MarketCap: 991.885 Millions | |
| Recent Price: 131.87 Smart Investing & Trading Score: 50 | |
| Day Percent Change: -0.0379018% Day Change: -9999 | |
| Week Change: 0.129081% Year-to-date Change: 56.5% | |
| ITCI Links: Profile News Message Board | |
| Charts:- Daily , Weekly | |
| Add ITCI to Watchlist: View: Get Complete ITCI Trend Analysis ➞ | |
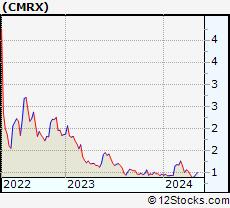 | CMRX Chimerix, Inc. |
| Sector: Health Care | |
| SubSector: Biotechnology | |
| MarketCap: 81.3785 Millions | |
| Recent Price: 8.54 Smart Investing & Trading Score: 50 | |
| Day Percent Change: -0.116959% Day Change: -9999 | |
| Week Change: 0.117233% Year-to-date Change: 151.9% | |
| CMRX Links: Profile News Message Board | |
| Charts:- Daily , Weekly | |
| Add CMRX to Watchlist: View: Get Complete CMRX Trend Analysis ➞ | |
 | ITGR Integer Holdings Corp |
| Sector: Health Care | |
| SubSector: Medical Devices | |
| MarketCap: 3746.62 Millions | |
| Recent Price: 103.09 Smart Investing & Trading Score: 60 | |
| Day Percent Change: 0.165177% Day Change: -0.47 | |
| Week Change: 0.116539% Year-to-date Change: -22.0% | |
| ITGR Links: Profile News Message Board | |
| Charts:- Daily , Weekly | |
| Add ITGR to Watchlist: View: Get Complete ITGR Trend Analysis ➞ | |
 | DCPH Deciphera Pharmaceuticals, Inc. |
| Sector: Health Care | |
| SubSector: Biotechnology | |
| MarketCap: 2329.95 Millions | |
| Recent Price: 25.59 Smart Investing & Trading Score: 60 | |
| Day Percent Change: 0% Day Change: -9999 | |
| Week Change: 0.117371% Year-to-date Change: 0.0% | |
| DCPH Links: Profile News Message Board | |
| Charts:- Daily , Weekly | |
| Add DCPH to Watchlist: View: Get Complete DCPH Trend Analysis ➞ | |
 | NVST Envista Holdings Corp |
| Sector: Health Care | |
| SubSector: Medical Instruments & Supplies | |
| MarketCap: 3541.33 Millions | |
| Recent Price: 20.57 Smart Investing & Trading Score: 50 | |
| Day Percent Change: 1.03143% Day Change: 0.21 | |
| Week Change: 0.0973236% Year-to-date Change: 7.6% | |
| NVST Links: Profile News Message Board | |
| Charts:- Daily , Weekly | |
| Add NVST to Watchlist: View: Get Complete NVST Trend Analysis ➞ | |
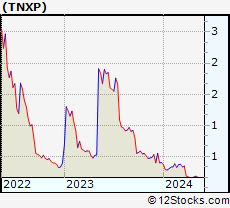 | TNXP Tonix Pharmaceuticals Holding Corp |
| Sector: Health Care | |
| SubSector: Biotechnology | |
| MarketCap: 232.65 Millions | |
| Recent Price: 24.72 Smart Investing & Trading Score: 10 | |
| Day Percent Change: 1.53702% Day Change: -0.2 | |
| Week Change: 0.0809717% Year-to-date Change: -21.3% | |
| TNXP Links: Profile News Message Board | |
| Charts:- Daily , Weekly | |
| Add TNXP to Watchlist: View: Get Complete TNXP Trend Analysis ➞ | |
 | XOMAO XOMA Corporation |
| Sector: Health Care | |
| SubSector: Biotechnology | |
| MarketCap: 217 Millions | |
| Recent Price: 25.39 Smart Investing & Trading Score: 40 | |
| Day Percent Change: -0.703562% Day Change: 0.25 | |
| Week Change: 0.0788333% Year-to-date Change: 5.4% | |
| XOMAO Links: Profile News Message Board | |
| Charts:- Daily , Weekly | |
| Add XOMAO to Watchlist: View: Get Complete XOMAO Trend Analysis ➞ | |
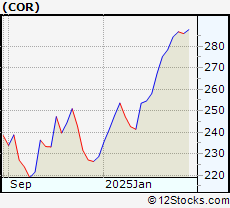 | COR Cencora Inc |
| Sector: Health Care | |
| SubSector: Medical Distribution | |
| MarketCap: 56709.3 Millions | |
| Recent Price: 308.57 Smart Investing & Trading Score: 60 | |
| Day Percent Change: -1.0264% Day Change: -3.06 | |
| Week Change: 0.0681022% Year-to-date Change: 37.9% | |
| COR Links: Profile News Message Board | |
| Charts:- Daily , Weekly | |
| Add COR to Watchlist: View: Get Complete COR Trend Analysis ➞ | |
 | TBPH Theravance Biopharma Inc |
| Sector: Health Care | |
| SubSector: Biotechnology | |
| MarketCap: 702.54 Millions | |
| Recent Price: 14.06 Smart Investing & Trading Score: 40 | |
| Day Percent Change: -2.49653% Day Change: 0.27 | |
| Week Change: 0.0711744% Year-to-date Change: 51.5% | |
| TBPH Links: Profile News Message Board | |
| Charts:- Daily , Weekly | |
| Add TBPH to Watchlist: View: Get Complete TBPH Trend Analysis ➞ | |
 | SWTX SpringWorks Therapeutics, Inc. |
| Sector: Health Care | |
| SubSector: Biotechnology | |
| MarketCap: 1311.85 Millions | |
| Recent Price: 46.99 Smart Investing & Trading Score: 50 | |
| Day Percent Change: 0.0212857% Day Change: -9999 | |
| Week Change: 0.0638842% Year-to-date Change: 30.2% | |
| SWTX Links: Profile News Message Board | |
| Charts:- Daily , Weekly | |
| Add SWTX to Watchlist: View: Get Complete SWTX Trend Analysis ➞ | |
 | IRTC iRhythm Technologies Inc |
| Sector: Health Care | |
| SubSector: Medical Devices | |
| MarketCap: 5816.73 Millions | |
| Recent Price: 174.00 Smart Investing & Trading Score: 70 | |
| Day Percent Change: 3.91162% Day Change: 3.48 | |
| Week Change: 0.0402461% Year-to-date Change: 94.5% | |
| IRTC Links: Profile News Message Board | |
| Charts:- Daily , Weekly | |
| Add IRTC to Watchlist: View: Get Complete IRTC Trend Analysis ➞ | |
 | LH Labcorp Holdings Inc |
| Sector: Health Care | |
| SubSector: Diagnostics & Research | |
| MarketCap: 23157.5 Millions | |
| Recent Price: 279.44 Smart Investing & Trading Score: 40 | |
| Day Percent Change: 0.136171% Day Change: 0.64 | |
| Week Change: 0.0322176% Year-to-date Change: 23.2% | |
| LH Links: Profile News Message Board | |
| Charts:- Daily , Weekly | |
| Add LH to Watchlist: View: Get Complete LH Trend Analysis ➞ | |
 | PPD PPD, Inc. |
| Sector: Health Care | |
| SubSector: Drug Manufacturers Specialty & Generic | |
| MarketCap: 12287 Millions | |
| Recent Price: 47.28 Smart Investing & Trading Score: 30 | |
| Day Percent Change: 0% Day Change: -9999 | |
| Week Change: 0% Year-to-date Change: 0.0% | |
| PPD Links: Profile News Message Board | |
| Charts:- Daily , Weekly | |
| Add PPD to Watchlist: View: Get Complete PPD Trend Analysis ➞ | |
 | TARO Taro Pharmaceutical Industries Ltd. |
| Sector: Health Care | |
| SubSector: Drug Manufacturers - Other | |
| MarketCap: 2379.33 Millions | |
| Recent Price: 42.97 Smart Investing & Trading Score: 20 | |
| Day Percent Change: 0% Day Change: -9999 | |
| Week Change: 0% Year-to-date Change: 0.0% | |
| TARO Links: Profile News Message Board | |
| Charts:- Daily , Weekly | |
| Add TARO to Watchlist: View: Get Complete TARO Trend Analysis ➞ | |
 | PKI PerkinElmer, Inc. |
| Sector: Health Care | |
| SubSector: Medical Laboratories & Research | |
| MarketCap: 8157 Millions | |
| Recent Price: 115.24 Smart Investing & Trading Score: 10 | |
| Day Percent Change: 0% Day Change: -9999 | |
| Week Change: 0% Year-to-date Change: 0.0% | |
| PKI Links: Profile News Message Board | |
| Charts:- Daily , Weekly | |
| Add PKI to Watchlist: View: Get Complete PKI Trend Analysis ➞ | |
 | STSA Satsuma Pharmaceuticals, Inc. |
| Sector: Health Care | |
| SubSector: Biotechnology | |
| MarketCap: 836.185 Millions | |
| Recent Price: 1.10 Smart Investing & Trading Score: 30 | |
| Day Percent Change: 0% Day Change: -9999 | |
| Week Change: 0% Year-to-date Change: 0.0% | |
| STSA Links: Profile News Message Board | |
| Charts:- Daily , Weekly | |
| Add STSA to Watchlist: View: Get Complete STSA Trend Analysis ➞ | |
 | DEPO Depomed, Inc. |
| Sector: Health Care | |
| SubSector: Drug Manufacturers - Other | |
| MarketCap: 997.04 Millions | |
| Recent Price: 7.30 Smart Investing & Trading Score: 0 | |
| Day Percent Change: 0% Day Change: -9999 | |
| Week Change: 0% Year-to-date Change: 0.0% | |
| DEPO Links: Profile News Message Board | |
| Charts:- Daily , Weekly | |
| Add DEPO to Watchlist: View: Get Complete DEPO Trend Analysis ➞ | |
 | PPHM Peregrine Pharmaceuticals, Inc. |
| Sector: Health Care | |
| SubSector: Biotechnology | |
| MarketCap: 168.51 Millions | |
| Recent Price: 4.22 Smart Investing & Trading Score: 10 | |
| Day Percent Change: 0% Day Change: -9999 | |
| Week Change: 0% Year-to-date Change: 0.0% | |
| PPHM Links: Profile News Message Board | |
| Charts:- Daily , Weekly | |
| Add PPHM to Watchlist: View: Get Complete PPHM Trend Analysis ➞ | |
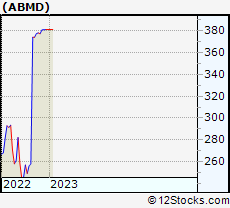 | ABMD Abiomed, Inc. |
| Sector: Health Care | |
| SubSector: Medical Appliances & Equipment | |
| MarketCap: 6488.9 Millions | |
| Recent Price: 381.02 Smart Investing & Trading Score: 30 | |
| Day Percent Change: 0% Day Change: -9999 | |
| Week Change: 0% Year-to-date Change: 0.0% | |
| ABMD Links: Profile News Message Board | |
| Charts:- Daily , Weekly | |
| Add ABMD to Watchlist: View: Get Complete ABMD Trend Analysis ➞ | |
 | QSII Quality Systems, Inc. |
| Sector: Health Care | |
| SubSector: Healthcare Information Services | |
| MarketCap: 943.44 Millions | |
| Recent Price: 22.35 Smart Investing & Trading Score: 20 | |
| Day Percent Change: 0% Day Change: -9999 | |
| Week Change: 0% Year-to-date Change: 0.0% | |
| QSII Links: Profile News Message Board | |
| Charts:- Daily , Weekly | |
| Add QSII to Watchlist: View: Get Complete QSII Trend Analysis ➞ | |
 | NVO Novo Nordisk ADR |
| Sector: Health Care | |
| SubSector: Drug Manufacturers - General | |
| MarketCap: 185911 Millions | |
| Recent Price: 58.74 Smart Investing & Trading Score: 90 | |
| Day Percent Change: -0.72672% Day Change: -0.91 | |
| Week Change: 0% Year-to-date Change: -31.8% | |
| NVO Links: Profile News Message Board | |
| Charts:- Daily , Weekly | |
| Add NVO to Watchlist: View: Get Complete NVO Trend Analysis ➞ | |
| For tabular summary view of above stock list: Summary View ➞ 0 - 25 , 25 - 50 , 50 - 75 , 75 - 100 , 100 - 125 , 125 - 150 , 150 - 175 , 175 - 200 , 200 - 225 , 225 - 250 , 250 - 275 , 275 - 300 , 300 - 325 , 325 - 350 , 350 - 375 , 375 - 400 , 400 - 425 , 425 - 450 , 450 - 475 , 475 - 500 , 500 - 525 , 525 - 550 , 550 - 575 , 575 - 600 , 600 - 625 , 625 - 650 , 650 - 675 , 675 - 700 , 700 - 725 , 725 - 750 , 750 - 775 , 775 - 800 , 800 - 825 , 825 - 850 , 850 - 875 , 875 - 900 , 900 - 925 , 925 - 950 , 950 - 975 , 975 - 1000 | ||
| Click To Change The Sort Order: By Market Cap or Company Size Performance: Year-to-date, Week and Day | |
| Select Chart Type: | ||
|
Best Stocks Today 12Stocks.com |
© 2025 12Stocks.com Terms & Conditions Privacy Contact Us
All Information Provided Only For Education And Not To Be Used For Investing or Trading. See Terms & Conditions


One More Thing ... Get Best Stocks Delivered Daily!
Never Ever Miss A Move With Our Top Ten Stocks Lists
Find Best Stocks In Any Market - Bull or Bear Market
Take A Peek At Our Top Ten Stocks Lists: Daily, Weekly, Year-to-Date & Top Trends
Find Best Stocks In Any Market - Bull or Bear Market
Take A Peek At Our Top Ten Stocks Lists: Daily, Weekly, Year-to-Date & Top Trends
Healthcare Stocks With Best Up Trends [0-bearish to 100-bullish]: Taysha Gene[100], DBV Technologies[100], Valneva SE[100], ClearPoint Neuro[100], Prime Medicine[100], AlloVir [100], Sarepta [100], Monopar [100], Cara [100], Absci Corp[100], Spruce Biosciences[100]
Best Healthcare Stocks Year-to-Date:
Regencell Bioscience[12636.6%], Kaleido BioSciences[9900%], Vor Biopharma[3175%], Nanobiotix ADR[581.379%], Eagle [542.857%], So-Young [395.711%], I-Mab ADR[357.506%], Monopar [337.489%], Nektar [319.84%], 908 Devices[299.543%], DBV Technologies[276.923%] Best Healthcare Stocks This Week:
Athersys [193287%], Nobilis Health[101349%], VBI Vaccines[86898.5%], ContraFect [47677.8%], Clovis Oncology[39610.5%], Endo [28369.6%], NanoString Technologies[17224.7%], Neptune Wellness[14100%], ViewRay [11470.2%], Mallkrodt [11382.1%], Achillion [10033.3%] Best Healthcare Stocks Daily:
Kaleido BioSciences[9900%], Neoleukin [332.665%], Syros [226.23%], Athenex [103.333%], Taysha Gene[53.4591%], DBV Technologies[21.6485%], Valneva SE[20.197%], ClearPoint Neuro[19.7991%], Prime Medicine[19.4097%], Accelerate Diagnostics[17.6471%], Aptose Biosciences[17.5439%]