
 Login Sign Up


| |||||
 |  | ||||

| 12Stocks.com Market Intelligence |
Best Financial Stocks
| In a hurry? Financial Stocks Lists: Performance Trends Table, Stock Charts
Sort Financial stocks: Daily, Weekly, Year-to-Date, Market Cap & Trends. Filter Financial stocks list by size:All Financial Large Mid-Range Small & MicroCap |
| 12Stocks.com Financial Stocks Performances & Trends Daily | |||||||||
|
|  The overall Smart Investing & Trading Score is 53 (0-bearish to 100-bullish) which puts Financial sector in short term neutral trend. The Smart Investing & Trading Score from previous trading session is 36 and hence an improvement of trend.
| ||||||||
Here are the Smart Investing & Trading Scores of the most requested Financial stocks at 12Stocks.com (click stock name for detailed review):
|


| 12Stocks.com: Investing in Financial sector with Stocks | |
|
The following table helps investors and traders sort through current performance and trends (as measured by Smart Investing & Trading Score) of various
stocks in the Financial sector. Quick View: Move mouse or cursor over stock symbol (ticker) to view short-term Technical chart and over stock name to view long term chart. Click on  to add stock symbol to your watchlist and to add stock symbol to your watchlist and  to view watchlist. Click on any ticker or stock name for detailed market intelligence report for that stock. to view watchlist. Click on any ticker or stock name for detailed market intelligence report for that stock. |
12Stocks.com Performance of Stocks in Financial Sector
| Ticker | Stock Name | Watchlist | Category | Recent Price | Smart Investing & Trading Score | Change % | YTD Change% |
| BHK | BlackRock Core |   | Closed-End Fund - Debt | 10.44 | 60 | 1.06% | -4.31% |
| USB | U.S. Bancorp | | Regional Banks | 41.41 | 62 | 1.07% | -4.32% |
| BUSE | First Busey | | Regional Banks | 23.72 | 100 | 1.11% | -4.43% |
| AAT | American Assets | | REIT - Retail | 21.51 | 77 | -0.23% | -4.44% |
| DEI | Douglas Emmett | | REIT - | 13.85 | 100 | 0.80% | -4.48% |
| JRVR | James River | | Insurance | 8.82 | 30 | -0.45% | -4.55% |
| FCPT | Four Corners | | REIT | 24.14 | 87 | 0.21% | -4.58% |
| RBCAA | Republic Bancorp | | Regional Banks | 52.63 | 95 | 1.50% | -4.59% |
| BRX | Brixmor Property | | REIT - Retail | 22.19 | 40 | -1.03% | -4.64% |
| FHB | First Hawaiian | | Regional Banks | 21.78 | 100 | 0.41% | -4.72% |
| MBWM | Mercantile Bank | | Regional Banks | 38.47 | 95 | 0.87% | -4.73% |
| CMA | Comerica | | Banks | 53.07 | 100 | 2.31% | -4.91% |
| ARE | Alexandria Real | | REIT - Office | 120.51 | 52 | 1.98% | -4.94% |
| CACC | Credit Acceptance | | Credit Services | 506.28 | 17 | 1.02% | -4.96% |
| ATLO | Ames National | | Regional Banks | 20.27 | 100 | 2.01% | -5.01% |
| SHO | Sunstone Hotel | | REIT | 10.19 | 10 | 1.39% | -5.03% |
| MYI | BlackRock MuniYield | | Closed-End Fund - Debt | 11.05 | 49 | 1.01% | -5.07% |
| RCS | PIMCO Strategic | | Closed-End Fund - Debt | 5.77 | 25 | -2.20% | -5.10% |
| RHP | Ryman Hospitality | | REIT | 104.43 | 17 | -0.37% | -5.12% |
| FAX | Aberdeen Asia-Pacific | | Closed-End Fund - Debt | 2.57 | 32 | 1.18% | -5.17% |
| INTR | Inter & Co | | Banks - Regional | 5.32 | 49 | 4.01% | -5.17% |
| BLFY | Blue Foundry | | Banks - Regional | 9.13 | 74 | 1.67% | -5.19% |
| JRS | Nuveen Real | | Asset Mgmt | 7.41 | 64 | 2.07% | -5.24% |
| CHCO | City Holding | | Regional Banks | 104.47 | 83 | -0.28% | -5.25% |
| BWBBP | Bridgewater Bancshares | | Banks - Regional | 17.99 | 74 | 0.70% | -5.32% |
| For chart view version of above stock list: Chart View ➞ 0 - 25 , 25 - 50 , 50 - 75 , 75 - 100 , 100 - 125 , 125 - 150 , 150 - 175 , 175 - 200 , 200 - 225 , 225 - 250 , 250 - 275 , 275 - 300 , 300 - 325 , 325 - 350 , 350 - 375 , 375 - 400 , 400 - 425 , 425 - 450 , 450 - 475 , 475 - 500 , 500 - 525 , 525 - 550 , 550 - 575 , 575 - 600 , 600 - 625 , 625 - 650 , 650 - 675 , 675 - 700 , 700 - 725 , 725 - 750 , 750 - 775 , 775 - 800 , 800 - 825 , 825 - 850 , 850 - 875 , 875 - 900 , 900 - 925 , 925 - 950 , 950 - 975 , 975 - 1000 , 1000 - 1025 , 1025 - 1050 , 1050 - 1075 , 1075 - 1100 , 1100 - 1125 , 1125 - 1150 , 1150 - 1175 , 1175 - 1200 , 1200 - 1225 , 1225 - 1250 | ||
 | Click To Change The Sort Order: By Market Cap or Company Size Performance: Year-to-date, Week and Day |  |
|
Get the most comprehensive stock market coverage daily at 12Stocks.com ➞ Best Stocks Today ➞ Best Stocks Weekly ➞ Best Stocks Year-to-Date ➞ Best Stocks Trends ➞  Best Stocks Today 12Stocks.com Best Nasdaq Stocks ➞ Best S&P 500 Stocks ➞ Best Tech Stocks ➞ Best Biotech Stocks ➞ |
| Detailed Overview of Financial Stocks |
| Financial Technical Overview, Leaders & Laggards, Top Financial ETF Funds & Detailed Financial Stocks List, Charts, Trends & More |
| Financial Sector: Technical Analysis, Trends & YTD Performance | |
| Financial sector is composed of stocks
from banks, brokers, insurance, REITs
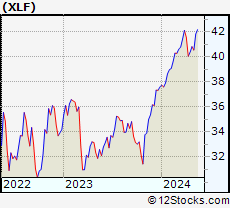
and services subsectors. Financial sector, as represented by XLF, an exchange-traded fund [ETF] that holds basket of Financial stocks (e.g, Bank of America, Goldman Sachs) is up by 7.85% and is currently outperforming the overall market by 0.97% year-to-date. Below is a quick view of Technical charts and trends: |
|
 XLF Weekly Chart |
|
| Long Term Trend: Good | |
| Medium Term Trend: Good | |
 XLF Daily Chart |
|
| Short Term Trend: Very Good | |
| Overall Trend Score: 53 | |
| YTD Performance: 7.85% | |
| **Trend Scores & Views Are Only For Educational Purposes And Not For Investing | |
| 12Stocks.com: Top Performing Financial Sector Stocks | ||||||||||||||||||||||||||||||||||||||||||||||||
 The top performing Financial sector stocks year to date are
Now, more recently, over last week, the top performing Financial sector stocks on the move are


|
||||||||||||||||||||||||||||||||||||||||||||||||
| 12Stocks.com: Investing in Financial Sector using Exchange Traded Funds | |
|
The following table shows list of key exchange traded funds (ETF) that
help investors track Financial Index. For detailed view, check out our ETF Funds section of our website. Quick View: Move mouse or cursor over ETF symbol (ticker) to view short-term Technical chart and over ETF name to view long term chart. Click on ticker or stock name for detailed view. Click on to add stock symbol to your watchlist and to view watchlist. |
12Stocks.com List of ETFs that track Financial Index
| Ticker | ETF Name | Watchlist | Recent Price | Smart Investing & Trading Score | Change % | Week % | Year-to-date % |
| XLF | Financial | | 40.55 | 53 | 0.22 | -0.66 | 7.85% |
| IAI | Broker-Dealers & Secs | | 114.27 | 95 | 0.98 | 1.11 | 5.29% |
| IYF | Financials | | 92.47 | 78 | 0.38 | 0.33 | 8.27% |
| IYG | Financial Services | | 64.09 | 60 | 0.31 | -0.8 | 7.29% |
| KRE | Regional Banking | | 49.65 | 100 | 1.29 | 3.03 | -5.3% |
| IXG | Global Financials | | 84.84 | 85 | 0.87 | 0.77 | 7.97% |
| VFH | Financials | | 98.70 | 73 | 0.34 | -0.23 | 6.98% |
| KBE | Bank | | 46.39 | 100 | 1.16 | 2.34 | 0.8% |
| FAS | Financial Bull 3X | | 98.83 | 60 | 0.95 | -1.79 | 19.58% |
| FAZ | Financial Bear 3X | | 11.08 | 17 | -0.89 | 2.03 | -18.95% |
| UYG | Financials | | 62.79 | 60 | 0.56 | -1.35 | 13.75% |
| IAT | Regional Banks | | 42.29 | 100 | 0.93 | 1.37 | 1.08% |
| KIE | Insurance | | 49.48 | 60 | 0.39 | 1.96 | 9.42% |
| PSCF | SmallCap Financials | | 47.28 | 100 | 0.77 | 1.98 | -3.86% |
| EUFN | Europe Financials | | 22.65 | 85 | 0.24 | 0.82 | 8.04% |
| PGF | Financial Preferred | | 14.85 | 64 | 1.43 | 1.92 | 1.85% |
| 12Stocks.com: Charts, Trends, Fundamental Data and Performances of Financial Stocks | |
|
We now take in-depth look at all Financial stocks including charts, multi-period performances and overall trends (as measured by Smart Investing & Trading Score). One can sort Financial stocks (click link to choose) by Daily, Weekly and by Year-to-Date performances. Also, one can sort by size of the company or by market capitalization. |
| Select Your Default Chart Type: | |||||
| |||||
| Click on stock symbol or name for detailed view. Click on to add stock symbol to your watchlist and to view watchlist. Quick View: Move mouse or cursor over "Daily" to quickly view daily Technical stock chart and over "Weekly" to view weekly Technical stock chart. | |||||

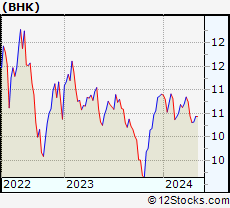 | BHK BlackRock Core Bond Trust |
| Sector: Financials | |
| SubSector: Closed-End Fund - Debt | |
| MarketCap: 646.607 Millions | |
| Recent Price: 10.44 Smart Investing & Trading Score: 60 | |
| Day Percent Change: 1.06% Day Change: 0.11 | |
| Week Change: 1.16% Year-to-date Change: -4.3% | |
| BHK Links: Profile News Message Board | |
| Charts:- Daily , Weekly | |
| Add BHK to Watchlist: View: Get Complete BHK Trend Analysis ➞ | |
 | USB U.S. Bancorp |
| Sector: Financials | |
| SubSector: Regional - Midwest Banks | |
| MarketCap: 56757.8 Millions | |
| Recent Price: 41.41 Smart Investing & Trading Score: 62 | |
| Day Percent Change: 1.07% Day Change: 0.44 | |
| Week Change: 0.71% Year-to-date Change: -4.3% | |
| USB Links: Profile News Message Board | |
| Charts:- Daily , Weekly | |
| Add USB to Watchlist: View: Get Complete USB Trend Analysis ➞ | |
 | BUSE First Busey Corporation |
| Sector: Financials | |
| SubSector: Regional - Midwest Banks | |
| MarketCap: 876.97 Millions | |
| Recent Price: 23.72 Smart Investing & Trading Score: 100 | |
| Day Percent Change: 1.11% Day Change: 0.26 | |
| Week Change: 4.04% Year-to-date Change: -4.4% | |
| BUSE Links: Profile News Message Board | |
| Charts:- Daily , Weekly | |
| Add BUSE to Watchlist: View: Get Complete BUSE Trend Analysis ➞ | |
 | AAT American Assets Trust, Inc. |
| Sector: Financials | |
| SubSector: REIT - Retail | |
| MarketCap: 1580.54 Millions | |
| Recent Price: 21.51 Smart Investing & Trading Score: 77 | |
| Day Percent Change: -0.23% Day Change: -0.05 | |
| Week Change: 1.32% Year-to-date Change: -4.4% | |
| AAT Links: Profile News Message Board | |
| Charts:- Daily , Weekly | |
| Add AAT to Watchlist: View: Get Complete AAT Trend Analysis ➞ | |
 | DEI Douglas Emmett, Inc. |
| Sector: Financials | |
| SubSector: REIT - Diversified | |
| MarketCap: 4917.83 Millions | |
| Recent Price: 13.85 Smart Investing & Trading Score: 100 | |
| Day Percent Change: 0.80% Day Change: 0.11 | |
| Week Change: 3.59% Year-to-date Change: -4.5% | |
| DEI Links: Profile News Message Board | |
| Charts:- Daily , Weekly | |
| Add DEI to Watchlist: View: Get Complete DEI Trend Analysis ➞ | |
 | JRVR James River Group Holdings, Ltd. |
| Sector: Financials | |
| SubSector: Property & Casualty Insurance | |
| MarketCap: 978.312 Millions | |
| Recent Price: 8.82 Smart Investing & Trading Score: 30 | |
| Day Percent Change: -0.45% Day Change: -0.04 | |
| Week Change: -1.89% Year-to-date Change: -4.6% | |
| JRVR Links: Profile News Message Board | |
| Charts:- Daily , Weekly | |
| Add JRVR to Watchlist: View: Get Complete JRVR Trend Analysis ➞ | |
 | FCPT Four Corners Property Trust, Inc. |
| Sector: Financials | |
| SubSector: REIT - Hotel/Motel | |
| MarketCap: 1218.94 Millions | |
| Recent Price: 24.14 Smart Investing & Trading Score: 87 | |
| Day Percent Change: 0.21% Day Change: 0.05 | |
| Week Change: 2.99% Year-to-date Change: -4.6% | |
| FCPT Links: Profile News Message Board | |
| Charts:- Daily , Weekly | |
| Add FCPT to Watchlist: View: Get Complete FCPT Trend Analysis ➞ | |
 | RBCAA Republic Bancorp, Inc. |
| Sector: Financials | |
| SubSector: Regional - Southeast Banks | |
| MarketCap: 671.835 Millions | |
| Recent Price: 52.63 Smart Investing & Trading Score: 95 | |
| Day Percent Change: 1.50% Day Change: 0.78 | |
| Week Change: 4.22% Year-to-date Change: -4.6% | |
| RBCAA Links: Profile News Message Board | |
| Charts:- Daily , Weekly | |
| Add RBCAA to Watchlist: View: Get Complete RBCAA Trend Analysis ➞ | |
 | BRX Brixmor Property Group Inc. |
| Sector: Financials | |
| SubSector: REIT - Retail | |
| MarketCap: 3561.54 Millions | |
| Recent Price: 22.19 Smart Investing & Trading Score: 40 | |
| Day Percent Change: -1.03% Day Change: -0.23 | |
| Week Change: 2.16% Year-to-date Change: -4.6% | |
| BRX Links: Profile News Message Board | |
| Charts:- Daily , Weekly | |
| Add BRX to Watchlist: View: Get Complete BRX Trend Analysis ➞ | |
 | FHB First Hawaiian, Inc. |
| Sector: Financials | |
| SubSector: Regional - Pacific Banks | |
| MarketCap: 2398.99 Millions | |
| Recent Price: 21.78 Smart Investing & Trading Score: 100 | |
| Day Percent Change: 0.41% Day Change: 0.09 | |
| Week Change: -0.5% Year-to-date Change: -4.7% | |
| FHB Links: Profile News Message Board | |
| Charts:- Daily , Weekly | |
| Add FHB to Watchlist: View: Get Complete FHB Trend Analysis ➞ | |
 | MBWM Mercantile Bank Corporation |
| Sector: Financials | |
| SubSector: Regional - Midwest Banks | |
| MarketCap: 372.77 Millions | |
| Recent Price: 38.47 Smart Investing & Trading Score: 95 | |
| Day Percent Change: 0.87% Day Change: 0.33 | |
| Week Change: 6.3% Year-to-date Change: -4.7% | |
| MBWM Links: Profile News Message Board | |
| Charts:- Daily , Weekly | |
| Add MBWM to Watchlist: View: Get Complete MBWM Trend Analysis ➞ | |
 | CMA Comerica Incorporated |
| Sector: Financials | |
| SubSector: Money Center Banks | |
| MarketCap: 4449.49 Millions | |
| Recent Price: 53.07 Smart Investing & Trading Score: 100 | |
| Day Percent Change: 2.31% Day Change: 1.20 | |
| Week Change: 1.92% Year-to-date Change: -4.9% | |
| CMA Links: Profile News Message Board | |
| Charts:- Daily , Weekly | |
| Add CMA to Watchlist: View: Get Complete CMA Trend Analysis ➞ | |
 | ARE Alexandria Real Estate Equities, Inc. |
| Sector: Financials | |
| SubSector: REIT - Office | |
| MarketCap: 16793.6 Millions | |
| Recent Price: 120.51 Smart Investing & Trading Score: 52 | |
| Day Percent Change: 1.98% Day Change: 2.34 | |
| Week Change: 3.67% Year-to-date Change: -4.9% | |
| ARE Links: Profile News Message Board | |
| Charts:- Daily , Weekly | |
| Add ARE to Watchlist: View: Get Complete ARE Trend Analysis ➞ | |
 | CACC Credit Acceptance Corporation |
| Sector: Financials | |
| SubSector: Credit Services | |
| MarketCap: 5219.28 Millions | |
| Recent Price: 506.28 Smart Investing & Trading Score: 17 | |
| Day Percent Change: 1.02% Day Change: 5.12 | |
| Week Change: -3.86% Year-to-date Change: -5.0% | |
| CACC Links: Profile News Message Board | |
| Charts:- Daily , Weekly | |
| Add CACC to Watchlist: View: Get Complete CACC Trend Analysis ➞ | |
 | ATLO Ames National Corporation |
| Sector: Financials | |
| SubSector: Regional - Northeast Banks | |
| MarketCap: 195.999 Millions | |
| Recent Price: 20.27 Smart Investing & Trading Score: 100 | |
| Day Percent Change: 2.01% Day Change: 0.40 | |
| Week Change: 2.68% Year-to-date Change: -5.0% | |
| ATLO Links: Profile News Message Board | |
| Charts:- Daily , Weekly | |
| Add ATLO to Watchlist: View: Get Complete ATLO Trend Analysis ➞ | |
 | SHO Sunstone Hotel Investors, Inc. |
| Sector: Financials | |
| SubSector: REIT - Hotel/Motel | |
| MarketCap: 1861.04 Millions | |
| Recent Price: 10.19 Smart Investing & Trading Score: 10 | |
| Day Percent Change: 1.39% Day Change: 0.14 | |
| Week Change: -1.07% Year-to-date Change: -5.0% | |
| SHO Links: Profile News Message Board | |
| Charts:- Daily , Weekly | |
| Add SHO to Watchlist: View: Get Complete SHO Trend Analysis ➞ | |
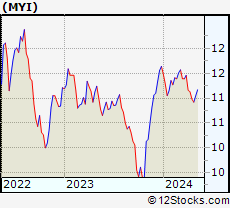 | MYI BlackRock MuniYield Quality Fund III, Inc. |
| Sector: Financials | |
| SubSector: Closed-End Fund - Debt | |
| MarketCap: 772.807 Millions | |
| Recent Price: 11.05 Smart Investing & Trading Score: 49 | |
| Day Percent Change: 1.01% Day Change: 0.11 | |
| Week Change: 1.19% Year-to-date Change: -5.1% | |
| MYI Links: Profile News Message Board | |
| Charts:- Daily , Weekly | |
| Add MYI to Watchlist: View: Get Complete MYI Trend Analysis ➞ | |
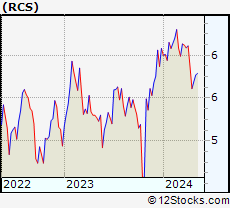 | RCS PIMCO Strategic Income Fund, Inc. |
| Sector: Financials | |
| SubSector: Closed-End Fund - Debt | |
| MarketCap: 246.607 Millions | |
| Recent Price: 5.77 Smart Investing & Trading Score: 25 | |
| Day Percent Change: -2.20% Day Change: -0.13 | |
| Week Change: 1.41% Year-to-date Change: -5.1% | |
| RCS Links: Profile News Message Board | |
| Charts:- Daily , Weekly | |
| Add RCS to Watchlist: View: Get Complete RCS Trend Analysis ➞ | |
 | RHP Ryman Hospitality Properties, Inc. |
| Sector: Financials | |
| SubSector: REIT - Hotel/Motel | |
| MarketCap: 1519.74 Millions | |
| Recent Price: 104.43 Smart Investing & Trading Score: 17 | |
| Day Percent Change: -0.37% Day Change: -0.39 | |
| Week Change: -2.46% Year-to-date Change: -5.1% | |
| RHP Links: Profile News Message Board | |
| Charts:- Daily , Weekly | |
| Add RHP to Watchlist: View: Get Complete RHP Trend Analysis ➞ | |
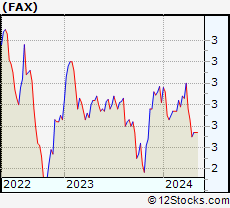 | FAX Aberdeen Asia-Pacific Income Fund, Inc. |
| Sector: Financials | |
| SubSector: Closed-End Fund - Debt | |
| MarketCap: 807.407 Millions | |
| Recent Price: 2.57 Smart Investing & Trading Score: 32 | |
| Day Percent Change: 1.18% Day Change: 0.03 | |
| Week Change: 0% Year-to-date Change: -5.2% | |
| FAX Links: Profile News Message Board | |
| Charts:- Daily , Weekly | |
| Add FAX to Watchlist: View: Get Complete FAX Trend Analysis ➞ | |
 | INTR Inter & Co, Inc. |
| Sector: Financials | |
| SubSector: Banks - Regional | |
| MarketCap: 1250 Millions | |
| Recent Price: 5.32 Smart Investing & Trading Score: 49 | |
| Day Percent Change: 4.01% Day Change: 0.21 | |
| Week Change: 2.21% Year-to-date Change: -5.2% | |
| INTR Links: Profile News Message Board | |
| Charts:- Daily , Weekly | |
| Add INTR to Watchlist: View: Get Complete INTR Trend Analysis ➞ | |
 | BLFY Blue Foundry Bancorp |
| Sector: Financials | |
| SubSector: Banks - Regional | |
| MarketCap: 264 Millions | |
| Recent Price: 9.13 Smart Investing & Trading Score: 74 | |
| Day Percent Change: 1.67% Day Change: 0.15 | |
| Week Change: 3.99% Year-to-date Change: -5.2% | |
| BLFY Links: Profile News Message Board | |
| Charts:- Daily , Weekly | |
| Add BLFY to Watchlist: View: Get Complete BLFY Trend Analysis ➞ | |
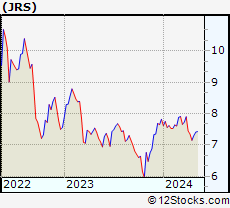 | JRS Nuveen Real Estate Income Fund |
| Sector: Financials | |
| SubSector: Asset Management | |
| MarketCap: 156.003 Millions | |
| Recent Price: 7.41 Smart Investing & Trading Score: 64 | |
| Day Percent Change: 2.07% Day Change: 0.15 | |
| Week Change: 1.51% Year-to-date Change: -5.2% | |
| JRS Links: Profile News Message Board | |
| Charts:- Daily , Weekly | |
| Add JRS to Watchlist: View: Get Complete JRS Trend Analysis ➞ | |
 | CHCO City Holding Company |
| Sector: Financials | |
| SubSector: Regional - Mid-Atlantic Banks | |
| MarketCap: 1059.59 Millions | |
| Recent Price: 104.47 Smart Investing & Trading Score: 83 | |
| Day Percent Change: -0.28% Day Change: -0.29 | |
| Week Change: 0.35% Year-to-date Change: -5.3% | |
| CHCO Links: Profile News Message Board | |
| Charts:- Daily , Weekly | |
| Add CHCO to Watchlist: View: Get Complete CHCO Trend Analysis ➞ | |
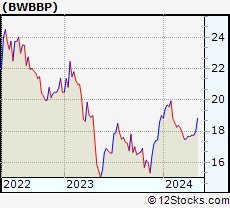 | BWBBP Bridgewater Bancshares, Inc. |
| Sector: Financials | |
| SubSector: Banks - Regional | |
| MarketCap: 285 Millions | |
| Recent Price: 17.99 Smart Investing & Trading Score: 74 | |
| Day Percent Change: 0.70% Day Change: 0.12 | |
| Week Change: 1.41% Year-to-date Change: -5.3% | |
| BWBBP Links: Profile News Message Board | |
| Charts:- Daily , Weekly | |
| Add BWBBP to Watchlist: View: Get Complete BWBBP Trend Analysis ➞ | |
| For tabular summary view of above stock list: Summary View ➞ 0 - 25 , 25 - 50 , 50 - 75 , 75 - 100 , 100 - 125 , 125 - 150 , 150 - 175 , 175 - 200 , 200 - 225 , 225 - 250 , 250 - 275 , 275 - 300 , 300 - 325 , 325 - 350 , 350 - 375 , 375 - 400 , 400 - 425 , 425 - 450 , 450 - 475 , 475 - 500 , 500 - 525 , 525 - 550 , 550 - 575 , 575 - 600 , 600 - 625 , 625 - 650 , 650 - 675 , 675 - 700 , 700 - 725 , 725 - 750 , 750 - 775 , 775 - 800 , 800 - 825 , 825 - 850 , 850 - 875 , 875 - 900 , 900 - 925 , 925 - 950 , 950 - 975 , 975 - 1000 , 1000 - 1025 , 1025 - 1050 , 1050 - 1075 , 1075 - 1100 , 1100 - 1125 , 1125 - 1150 , 1150 - 1175 , 1175 - 1200 , 1200 - 1225 , 1225 - 1250 | ||
| Click To Change The Sort Order: By Market Cap or Company Size Performance: Year-to-date, Week and Day | |
| Select Chart Type: | ||
|
Best Stocks Today 12Stocks.com |
© 2024 12Stocks.com Terms & Conditions Privacy Contact Us
All Information Provided Only For Education And Not To Be Used For Investing or Trading. See Terms & Conditions


One More Thing ... Get Best Stocks Delivered Daily!
Never Ever Miss A Move With Our Top Ten Stocks Lists
Find Best Stocks In Any Market - Bull or Bear Market
Take A Peek At Our Top Ten Stocks Lists: Daily, Weekly, Year-to-Date & Top Trends
Find Best Stocks In Any Market - Bull or Bear Market
Take A Peek At Our Top Ten Stocks Lists: Daily, Weekly, Year-to-Date & Top Trends
Financial Stocks With Best Up Trends [0-bearish to 100-bullish]: Siebert [100], Office Properties[100], Banco BBVA[100], AG Mortgage[100], Grupo Financiero[100], Banco Macro[100], Global X[100], Grupo Supervielle[100], Reinsurance [100], Camden Property[100], Noah [100]
Best Financial Stocks Year-to-Date:
Root [436.68%], Banco Macro[109.83%], Hippo [103.4%], Gladstone Capital[100.28%], Grupo Financiero[98.78%], Banco BBVA[92.83%], EverQuote [77.7%], Grupo Supervielle[69.21%], Yiren Digital[66.99%], LendingTree [62.96%], Lufax Holding[53.09%] Best Financial Stocks This Week:
Office Properties[42.79%], LendingTree [30.37%], SelectQuote [26.71%], Heartland [23.01%], Industrial Logistics[20.39%], New York[18.86%], KE [17.8%], Banco Macro[17.21%], Douglas Elliman[16.39%], Siebert [14.85%], eXp World[14.82%] Best Financial Stocks Daily:
Siebert [17.17%], SelectQuote [13.33%], Office Properties[12.11%], Banco BBVA[9.27%], Oportun [9.01%], AG Mortgage[8.85%], Diversified Healthcare[8.26%], RE/MAX [7.68%], Grupo Financiero[7.62%], Banco Macro[7.32%], Xenia Hotels[7.01%]