
 Login Sign Up


| |||||
 |  | ||||

| 12Stocks.com Market Intelligence |
Best Financial Stocks
| In a hurry? Financial Stocks Lists: Performance Trends Table, Stock Charts
Sort Financial stocks: Daily, Weekly, Year-to-Date, Market Cap & Trends. Filter Financial stocks list by size:All Financial Large Mid-Range Small & MicroCap |
| 12Stocks.com Financial Stocks Performances & Trends Daily | |||||||||
|
|  The overall Smart Investing & Trading Score is 53 (0-bearish to 100-bullish) which puts Financial sector in short term neutral trend. The Smart Investing & Trading Score from previous trading session is 36 and hence an improvement of trend.
| ||||||||
Here are the Smart Investing & Trading Scores of the most requested Financial stocks at 12Stocks.com (click stock name for detailed review):
|


| 12Stocks.com: Investing in Financial sector with Stocks | |
|
The following table helps investors and traders sort through current performance and trends (as measured by Smart Investing & Trading Score) of various
stocks in the Financial sector. Quick View: Move mouse or cursor over stock symbol (ticker) to view short-term Technical chart and over stock name to view long term chart. Click on  to add stock symbol to your watchlist and to add stock symbol to your watchlist and  to view watchlist. Click on any ticker or stock name for detailed market intelligence report for that stock. to view watchlist. Click on any ticker or stock name for detailed market intelligence report for that stock. |
12Stocks.com Performance of Stocks in Financial Sector
| Ticker | Stock Name | Watchlist | Category | Recent Price | Smart Investing & Trading Score | Change % | YTD Change% |
| NCA | Nuveen California |   | Closed-End Fund - Debt | 8.74 | 38 | 0.34% | -2.46% |
| GDL | GDL Fund | | Closed-End Fund - Equity | 7.84 | 34 | 0.26% | -2.49% |
| MQY | BlackRock MuniYield | | Closed-End Fund - Debt | 11.89 | 25 | 0.55% | -2.50% |
| MVT | BlackRock MuniVest | | Closed-End Fund - Debt | 10.50 | 42 | 0.48% | -2.51% |
| MITT | AG Mortgage | | Mortgage | 6.19 | 64 | 7.47% | -2.52% |
| FSD | First Trust | | Closed-End Fund - Debt | 11.79 | 57 | 0.55% | -2.52% |
| LCG | Sterling Capital | | Exchange Traded Fund | 27.73 | 17 | 1.84% | -2.53% |
| RLTY | Cohen & Steers s Opportunities & ome Fund | | Closed-End Fund - Debt | 13.64 | 57 | 1.19% | -2.54% |
| JLL | Jones Lang | | Property Mgmt | 184.03 | 69 | 0.02% | -2.56% |
| PZC | PIMCO California | | Closed-End Fund - Debt | 7.18 | 57 | 0.70% | -2.58% |
| CRVL | CorVel | | Insurance | 240.72 | 50 | -0.35% | -2.62% |
| VGM | Invesco Trust | | Closed-End Fund - Debt | 9.63 | 47 | 0.52% | -2.63% |
| RORO | ATAC US | | Exchange Traded Fund | 17.23 | 24 | 0.50% | -2.63% |
| MFA | MFA | | Mortgage | 10.97 | 74 | 0.55% | -2.66% |
| PMM | Putnam Managed | | Closed-End Fund - Debt | 5.92 | 35 | 0.73% | -2.66% |
| PPT | Putnam Premier | | Closed-End Fund - Debt | 3.48 | 42 | 0.29% | -2.66% |
| TRC | Tejon Ranch | | Property Mgmt | 16.74 | 75 | -0.71% | -2.67% |
| PDM | Piedmont Office | | REIT - Office | 6.92 | 100 | 1.32% | -2.67% |
| LX | LexinFintech | | Credit Services | 1.79 | 64 | 0.56% | -2.72% |
| BCH | Banco de | | Foreign Banks | 22.45 | 57 | 1.17% | -2.73% |
| VINP | Vi Partners | | Asset Mgmt | 10.69 | 44 | -0.28% | -2.73% |
| GGT | Gabelli Multimedia | | Closed-End Fund - Equity | 5.51 | 67 | 1.23% | -2.87% |
| MHD | BlackRock Muni | | Closed-End Fund - Debt | 11.57 | 24 | 0.65% | -2.90% |
| NAN | Nuveen New | | Closed-End Fund - Debt | 10.72 | 54 | 0.47% | -2.90% |
| NYMTN | New York | | Mortgage | 20.78 | 0 | 0.00% | -2.90% |
| For chart view version of above stock list: Chart View ➞ 0 - 25 , 25 - 50 , 50 - 75 , 75 - 100 , 100 - 125 , 125 - 150 , 150 - 175 , 175 - 200 , 200 - 225 , 225 - 250 , 250 - 275 , 275 - 300 , 300 - 325 , 325 - 350 , 350 - 375 , 375 - 400 , 400 - 425 , 425 - 450 , 450 - 475 , 475 - 500 , 500 - 525 , 525 - 550 , 550 - 575 , 575 - 600 , 600 - 625 , 625 - 650 , 650 - 675 , 675 - 700 , 700 - 725 , 725 - 750 , 750 - 775 , 775 - 800 , 800 - 825 , 825 - 850 , 850 - 875 , 875 - 900 , 900 - 925 , 925 - 950 , 950 - 975 , 975 - 1000 , 1000 - 1025 , 1025 - 1050 , 1050 - 1075 , 1075 - 1100 , 1100 - 1125 , 1125 - 1150 , 1150 - 1175 , 1175 - 1200 , 1200 - 1225 | ||
 | Click To Change The Sort Order: By Market Cap or Company Size Performance: Year-to-date, Week and Day |  |
|
Get the most comprehensive stock market coverage daily at 12Stocks.com ➞ Best Stocks Today ➞ Best Stocks Weekly ➞ Best Stocks Year-to-Date ➞ Best Stocks Trends ➞  Best Stocks Today 12Stocks.com Best Nasdaq Stocks ➞ Best S&P 500 Stocks ➞ Best Tech Stocks ➞ Best Biotech Stocks ➞ |
| Detailed Overview of Financial Stocks |
| Financial Technical Overview, Leaders & Laggards, Top Financial ETF Funds & Detailed Financial Stocks List, Charts, Trends & More |
| Financial Sector: Technical Analysis, Trends & YTD Performance | |
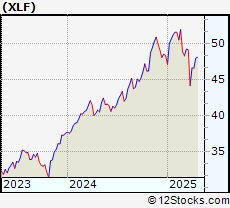
| Financial sector is composed of stocks
from banks, brokers, insurance, REITs
and services subsectors. Financial sector, as represented by XLF, an exchange-traded fund [ETF] that holds basket of Financial stocks (e.g, Bank of America, Goldman Sachs) is up by 7.51% and is currently outperforming the overall market by 1.02% year-to-date. Below is a quick view of Technical charts and trends: |
|
 XLF Weekly Chart |
|
| Long Term Trend: Good | |
| Medium Term Trend: Good | |
 XLF Daily Chart |
|
| Short Term Trend: Very Good | |
| Overall Trend Score: 53 | |
| YTD Performance: 7.51% | |
| **Trend Scores & Views Are Only For Educational Purposes And Not For Investing | |
| 12Stocks.com: Top Performing Financial Sector Stocks | ||||||||||||||||||||||||||||||||||||||||||||||||
 The top performing Financial sector stocks year to date are
Now, more recently, over last week, the top performing Financial sector stocks on the move are


|
||||||||||||||||||||||||||||||||||||||||||||||||
| 12Stocks.com: Investing in Financial Sector using Exchange Traded Funds | |
|
The following table shows list of key exchange traded funds (ETF) that
help investors track Financial Index. For detailed view, check out our ETF Funds section of our website. Quick View: Move mouse or cursor over ETF symbol (ticker) to view short-term Technical chart and over ETF name to view long term chart. Click on ticker or stock name for detailed view. Click on to add stock symbol to your watchlist and to view watchlist. |
12Stocks.com List of ETFs that track Financial Index
| Ticker | ETF Name | Watchlist | Recent Price | Smart Investing & Trading Score | Change % | Week % | Year-to-date % |
| XLF | Financial | | 40.42 | 53 | -0.09 | -0.97 | 7.51% |
| IAI | Broker-Dealers & Secs | | 113.80 | 95 | 0.57 | 0.7 | 4.86% |
| KRE | Regional Banking | | 49.67 | 86 | 1.33 | 3.07 | -5.26% |
| VFH | Financials | | 98.33 | 46 | -0.05 | -0.61 | 6.57% |
| KBE | Bank | | 46.40 | 100 | 1.17 | 2.35 | 0.81% |
| FAS | Financial Bull 3X | | 97.30 | 60 | -0.61 | -3.31 | 17.73% |
| FAZ | Financial Bear 3X | | 11.22 | 17 | 0.36 | 3.31 | -17.92% |
| UYG | Financials | | 62.33 | 60 | -0.17 | -2.07 | 12.92% |
| KIE | Insurance | | 49.13 | 47 | -0.33 | 1.23 | 8.64% |
| EUFN | Europe Financials | | 22.59 | 59 | 0.00 | 0.58 | 7.78% |
| 12Stocks.com: Charts, Trends, Fundamental Data and Performances of Financial Stocks | |
|
We now take in-depth look at all Financial stocks including charts, multi-period performances and overall trends (as measured by Smart Investing & Trading Score). One can sort Financial stocks (click link to choose) by Daily, Weekly and by Year-to-Date performances. Also, one can sort by size of the company or by market capitalization. |
| Select Your Default Chart Type: | |||||
| |||||
| Click on stock symbol or name for detailed view. Click on to add stock symbol to your watchlist and to view watchlist. Quick View: Move mouse or cursor over "Daily" to quickly view daily Technical stock chart and over "Weekly" to view weekly Technical stock chart. | |||||

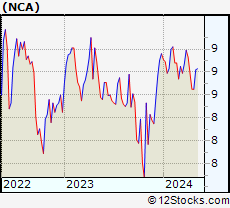 | NCA Nuveen California Municipal Value Fund, Inc. |
| Sector: Financials | |
| SubSector: Closed-End Fund - Debt | |
| MarketCap: 256.107 Millions | |
| Recent Price: 8.74 Smart Investing & Trading Score: 38 | |
| Day Percent Change: 0.34% Day Change: 0.03 | |
| Week Change: 1.04% Year-to-date Change: -2.5% | |
| NCA Links: Profile News Message Board | |
| Charts:- Daily , Weekly | |
| Add NCA to Watchlist: View: Get Complete NCA Trend Analysis ➞ | |
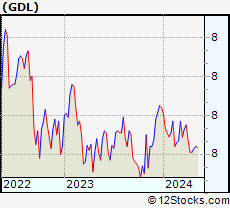 | GDL The GDL Fund |
| Sector: Financials | |
| SubSector: Closed-End Fund - Equity | |
| MarketCap: 104.847 Millions | |
| Recent Price: 7.84 Smart Investing & Trading Score: 34 | |
| Day Percent Change: 0.26% Day Change: 0.02 | |
| Week Change: 0.15% Year-to-date Change: -2.5% | |
| GDL Links: Profile News Message Board | |
| Charts:- Daily , Weekly | |
| Add GDL to Watchlist: View: Get Complete GDL Trend Analysis ➞ | |
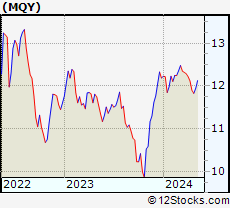 | MQY BlackRock MuniYield Quality Fund, Inc. |
| Sector: Financials | |
| SubSector: Closed-End Fund - Debt | |
| MarketCap: 378.307 Millions | |
| Recent Price: 11.89 Smart Investing & Trading Score: 25 | |
| Day Percent Change: 0.55% Day Change: 0.06 | |
| Week Change: 0.46% Year-to-date Change: -2.5% | |
| MQY Links: Profile News Message Board | |
| Charts:- Daily , Weekly | |
| Add MQY to Watchlist: View: Get Complete MQY Trend Analysis ➞ | |
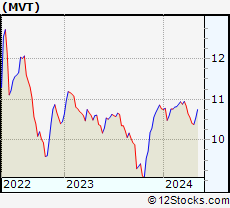 | MVT BlackRock MuniVest Fund II, Inc. |
| Sector: Financials | |
| SubSector: Closed-End Fund - Debt | |
| MarketCap: 253.707 Millions | |
| Recent Price: 10.50 Smart Investing & Trading Score: 42 | |
| Day Percent Change: 0.48% Day Change: 0.05 | |
| Week Change: 1.16% Year-to-date Change: -2.5% | |
| MVT Links: Profile News Message Board | |
| Charts:- Daily , Weekly | |
| Add MVT to Watchlist: View: Get Complete MVT Trend Analysis ➞ | |
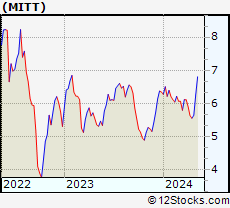 | MITT AG Mortgage Investment Trust, Inc. |
| Sector: Financials | |
| SubSector: Mortgage Investment | |
| MarketCap: 197.839 Millions | |
| Recent Price: 6.19 Smart Investing & Trading Score: 64 | |
| Day Percent Change: 7.47% Day Change: 0.43 | |
| Week Change: 9.56% Year-to-date Change: -2.5% | |
| MITT Links: Profile News Message Board | |
| Charts:- Daily , Weekly | |
| Add MITT to Watchlist: View: Get Complete MITT Trend Analysis ➞ | |
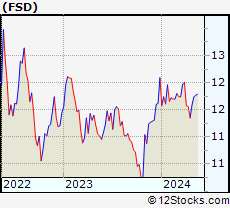 | FSD First Trust High Income Long/Short Fund |
| Sector: Financials | |
| SubSector: Closed-End Fund - Debt | |
| MarketCap: 362.607 Millions | |
| Recent Price: 11.79 Smart Investing & Trading Score: 57 | |
| Day Percent Change: 0.55% Day Change: 0.06 | |
| Week Change: 1.68% Year-to-date Change: -2.5% | |
| FSD Links: Profile News Message Board | |
| Charts:- Daily , Weekly | |
| Add FSD to Watchlist: View: Get Complete FSD Trend Analysis ➞ | |
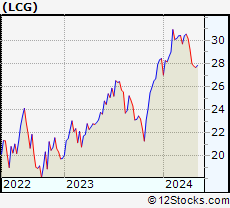 | LCG Sterling Capital Focus Equity ETF |
| Sector: Financials | |
| SubSector: Exchange Traded Fund | |
| MarketCap: 60157 Millions | |
| Recent Price: 27.73 Smart Investing & Trading Score: 17 | |
| Day Percent Change: 1.84% Day Change: 0.50 | |
| Week Change: -0.18% Year-to-date Change: -2.5% | |
| LCG Links: Profile News Message Board | |
| Charts:- Daily , Weekly | |
| Add LCG to Watchlist: View: Get Complete LCG Trend Analysis ➞ | |
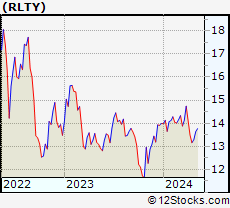 | RLTY Cohen & Steers Financials Opportunities & Income Fund |
| Sector: Financials | |
| SubSector: Closed-End Fund - Debt | |
| MarketCap: 231 Millions | |
| Recent Price: 13.64 Smart Investing & Trading Score: 57 | |
| Day Percent Change: 1.19% Day Change: 0.16 | |
| Week Change: 2.63% Year-to-date Change: -2.5% | |
| RLTY Links: Profile News Message Board | |
| Charts:- Daily , Weekly | |
| Add RLTY to Watchlist: View: Get Complete RLTY Trend Analysis ➞ | |
 | JLL Jones Lang LaSalle Incorporated |
| Sector: Financials | |
| SubSector: Property Management | |
| MarketCap: 5259.32 Millions | |
| Recent Price: 184.03 Smart Investing & Trading Score: 69 | |
| Day Percent Change: 0.02% Day Change: 0.04 | |
| Week Change: 0.84% Year-to-date Change: -2.6% | |
| JLL Links: Profile News Message Board | |
| Charts:- Daily , Weekly | |
| Add JLL to Watchlist: View: Get Complete JLL Trend Analysis ➞ | |
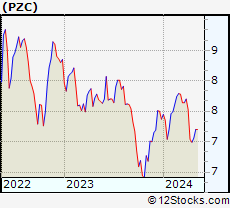 | PZC PIMCO California Municipal Income Fund III |
| Sector: Financials | |
| SubSector: Closed-End Fund - Debt | |
| MarketCap: 186.607 Millions | |
| Recent Price: 7.18 Smart Investing & Trading Score: 57 | |
| Day Percent Change: 0.70% Day Change: 0.05 | |
| Week Change: 1.7% Year-to-date Change: -2.6% | |
| PZC Links: Profile News Message Board | |
| Charts:- Daily , Weekly | |
| Add PZC to Watchlist: View: Get Complete PZC Trend Analysis ➞ | |
 | CRVL CorVel Corporation |
| Sector: Financials | |
| SubSector: Insurance Brokers | |
| MarketCap: 1090.67 Millions | |
| Recent Price: 240.72 Smart Investing & Trading Score: 50 | |
| Day Percent Change: -0.35% Day Change: -0.84 | |
| Week Change: 0.87% Year-to-date Change: -2.6% | |
| CRVL Links: Profile News Message Board | |
| Charts:- Daily , Weekly | |
| Add CRVL to Watchlist: View: Get Complete CRVL Trend Analysis ➞ | |
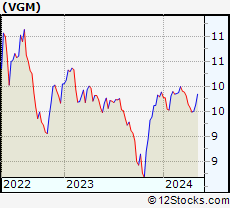 | VGM Invesco Trust for Investment Grade Municipals |
| Sector: Financials | |
| SubSector: Closed-End Fund - Debt | |
| MarketCap: 572.007 Millions | |
| Recent Price: 9.63 Smart Investing & Trading Score: 47 | |
| Day Percent Change: 0.52% Day Change: 0.05 | |
| Week Change: 1.26% Year-to-date Change: -2.6% | |
| VGM Links: Profile News Message Board | |
| Charts:- Daily , Weekly | |
| Add VGM to Watchlist: View: Get Complete VGM Trend Analysis ➞ | |
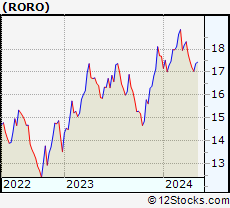 | RORO ATAC US Rotation ETF |
| Sector: Financials | |
| SubSector: Exchange Traded Fund | |
| MarketCap: 60157 Millions | |
| Recent Price: 17.23 Smart Investing & Trading Score: 24 | |
| Day Percent Change: 0.50% Day Change: 0.09 | |
| Week Change: 1.12% Year-to-date Change: -2.6% | |
| RORO Links: Profile News Message Board | |
| Charts:- Daily , Weekly | |
| Add RORO to Watchlist: View: Get Complete RORO Trend Analysis ➞ | |
 | MFA MFA Financial, Inc. |
| Sector: Financials | |
| SubSector: Mortgage Investment | |
| MarketCap: 1869.69 Millions | |
| Recent Price: 10.97 Smart Investing & Trading Score: 74 | |
| Day Percent Change: 0.55% Day Change: 0.06 | |
| Week Change: 2.24% Year-to-date Change: -2.7% | |
| MFA Links: Profile News Message Board | |
| Charts:- Daily , Weekly | |
| Add MFA to Watchlist: View: Get Complete MFA Trend Analysis ➞ | |
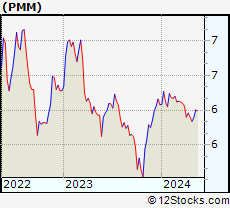 | PMM Putnam Managed Municipal Income Trust |
| Sector: Financials | |
| SubSector: Closed-End Fund - Debt | |
| MarketCap: 315.907 Millions | |
| Recent Price: 5.92 Smart Investing & Trading Score: 35 | |
| Day Percent Change: 0.73% Day Change: 0.04 | |
| Week Change: 1.34% Year-to-date Change: -2.7% | |
| PMM Links: Profile News Message Board | |
| Charts:- Daily , Weekly | |
| Add PMM to Watchlist: View: Get Complete PMM Trend Analysis ➞ | |
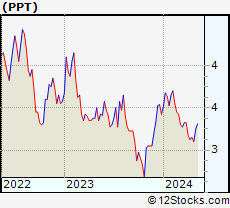 | PPT Putnam Premier Income Trust |
| Sector: Financials | |
| SubSector: Closed-End Fund - Debt | |
| MarketCap: 419.607 Millions | |
| Recent Price: 3.48 Smart Investing & Trading Score: 42 | |
| Day Percent Change: 0.29% Day Change: 0.01 | |
| Week Change: 1.02% Year-to-date Change: -2.7% | |
| PPT Links: Profile News Message Board | |
| Charts:- Daily , Weekly | |
| Add PPT to Watchlist: View: Get Complete PPT Trend Analysis ➞ | |
 | TRC Tejon Ranch Co. |
| Sector: Financials | |
| SubSector: Property Management | |
| MarketCap: 346.442 Millions | |
| Recent Price: 16.74 Smart Investing & Trading Score: 75 | |
| Day Percent Change: -0.71% Day Change: -0.12 | |
| Week Change: -1.93% Year-to-date Change: -2.7% | |
| TRC Links: Profile News Message Board | |
| Charts:- Daily , Weekly | |
| Add TRC to Watchlist: View: Get Complete TRC Trend Analysis ➞ | |
 | PDM Piedmont Office Realty Trust, Inc. |
| Sector: Financials | |
| SubSector: REIT - Office | |
| MarketCap: 2097.46 Millions | |
| Recent Price: 6.92 Smart Investing & Trading Score: 100 | |
| Day Percent Change: 1.32% Day Change: 0.09 | |
| Week Change: 3.13% Year-to-date Change: -2.7% | |
| PDM Links: Profile News Message Board | |
| Charts:- Daily , Weekly | |
| Add PDM to Watchlist: View: Get Complete PDM Trend Analysis ➞ | |
 | LX LexinFintech Holdings Ltd. |
| Sector: Financials | |
| SubSector: Credit Services | |
| MarketCap: 1674.18 Millions | |
| Recent Price: 1.79 Smart Investing & Trading Score: 64 | |
| Day Percent Change: 0.56% Day Change: 0.01 | |
| Week Change: 4.68% Year-to-date Change: -2.7% | |
| LX Links: Profile News Message Board | |
| Charts:- Daily , Weekly | |
| Add LX to Watchlist: View: Get Complete LX Trend Analysis ➞ | |
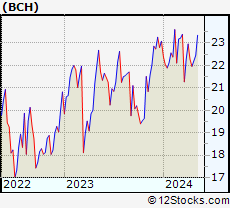 | BCH Banco de Chile |
| Sector: Financials | |
| SubSector: Foreign Regional Banks | |
| MarketCap: 8439.69 Millions | |
| Recent Price: 22.45 Smart Investing & Trading Score: 57 | |
| Day Percent Change: 1.17% Day Change: 0.26 | |
| Week Change: 1.13% Year-to-date Change: -2.7% | |
| BCH Links: Profile News Message Board | |
| Charts:- Daily , Weekly | |
| Add BCH to Watchlist: View: Get Complete BCH Trend Analysis ➞ | |
 | VINP Vinci Partners Investments Ltd. |
| Sector: Financials | |
| SubSector: Asset Management | |
| MarketCap: 537 Millions | |
| Recent Price: 10.69 Smart Investing & Trading Score: 44 | |
| Day Percent Change: -0.28% Day Change: -0.03 | |
| Week Change: -0.97% Year-to-date Change: -2.7% | |
| VINP Links: Profile News Message Board | |
| Charts:- Daily , Weekly | |
| Add VINP to Watchlist: View: Get Complete VINP Trend Analysis ➞ | |
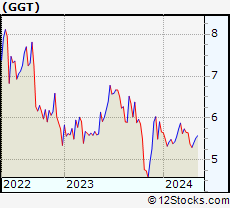 | GGT The Gabelli Multimedia Trust Inc. |
| Sector: Financials | |
| SubSector: Closed-End Fund - Equity | |
| MarketCap: 104.547 Millions | |
| Recent Price: 5.51 Smart Investing & Trading Score: 67 | |
| Day Percent Change: 1.23% Day Change: 0.07 | |
| Week Change: 1.79% Year-to-date Change: -2.9% | |
| GGT Links: Profile News Message Board | |
| Charts:- Daily , Weekly | |
| Add GGT to Watchlist: View: Get Complete GGT Trend Analysis ➞ | |
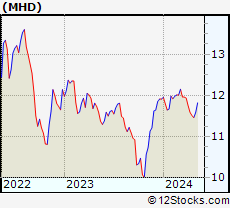 | MHD BlackRock MuniHoldings Fund, Inc. |
| Sector: Financials | |
| SubSector: Closed-End Fund - Debt | |
| MarketCap: 190.907 Millions | |
| Recent Price: 11.57 Smart Investing & Trading Score: 24 | |
| Day Percent Change: 0.65% Day Change: 0.07 | |
| Week Change: 0.92% Year-to-date Change: -2.9% | |
| MHD Links: Profile News Message Board | |
| Charts:- Daily , Weekly | |
| Add MHD to Watchlist: View: Get Complete MHD Trend Analysis ➞ | |
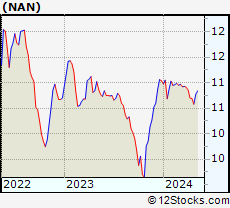 | NAN Nuveen New York Quality Municipal Income Fund |
| Sector: Financials | |
| SubSector: Closed-End Fund - Debt | |
| MarketCap: 352.307 Millions | |
| Recent Price: 10.72 Smart Investing & Trading Score: 54 | |
| Day Percent Change: 0.47% Day Change: 0.05 | |
| Week Change: 1.32% Year-to-date Change: -2.9% | |
| NAN Links: Profile News Message Board | |
| Charts:- Daily , Weekly | |
| Add NAN to Watchlist: View: Get Complete NAN Trend Analysis ➞ | |
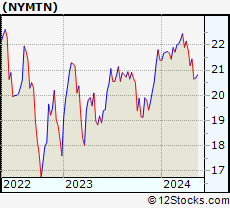 | NYMTN New York Mortgage Trust, Inc. |
| Sector: Financials | |
| SubSector: Mortgage Investment | |
| MarketCap: 1810.39 Millions | |
| Recent Price: 20.78 Smart Investing & Trading Score: 0 | |
| Day Percent Change: 0.00% Day Change: 0.00 | |
| Week Change: -3.09% Year-to-date Change: -2.9% | |
| NYMTN Links: Profile News Message Board | |
| Charts:- Daily , Weekly | |
| Add NYMTN to Watchlist: View: Get Complete NYMTN Trend Analysis ➞ | |
| For tabular summary view of above stock list: Summary View ➞ 0 - 25 , 25 - 50 , 50 - 75 , 75 - 100 , 100 - 125 , 125 - 150 , 150 - 175 , 175 - 200 , 200 - 225 , 225 - 250 , 250 - 275 , 275 - 300 , 300 - 325 , 325 - 350 , 350 - 375 , 375 - 400 , 400 - 425 , 425 - 450 , 450 - 475 , 475 - 500 , 500 - 525 , 525 - 550 , 550 - 575 , 575 - 600 , 600 - 625 , 625 - 650 , 650 - 675 , 675 - 700 , 700 - 725 , 725 - 750 , 750 - 775 , 775 - 800 , 800 - 825 , 825 - 850 , 850 - 875 , 875 - 900 , 900 - 925 , 925 - 950 , 950 - 975 , 975 - 1000 , 1000 - 1025 , 1025 - 1050 , 1050 - 1075 , 1075 - 1100 , 1100 - 1125 , 1125 - 1150 , 1150 - 1175 , 1175 - 1200 , 1200 - 1225 | ||
| Click To Change The Sort Order: By Market Cap or Company Size Performance: Year-to-date, Week and Day | |
| Select Chart Type: | ||
|
Best Stocks Today 12Stocks.com |
© 2024 12Stocks.com Terms & Conditions Privacy Contact Us
All Information Provided Only For Education And Not To Be Used For Investing or Trading. See Terms & Conditions


One More Thing ... Get Best Stocks Delivered Daily!
Never Ever Miss A Move With Our Top Ten Stocks Lists
Find Best Stocks In Any Market - Bull or Bear Market
Take A Peek At Our Top Ten Stocks Lists: Daily, Weekly, Year-to-Date & Top Trends
Find Best Stocks In Any Market - Bull or Bear Market
Take A Peek At Our Top Ten Stocks Lists: Daily, Weekly, Year-to-Date & Top Trends
Financial Stocks With Best Up Trends [0-bearish to 100-bullish]: Reinsurance [100], Banco Macro[100], Grupo Supervielle[100], Camden Property[100], TPG RE[100], Corebridge [100], Medical Properties[100], Comerica [100], Noah [100], Banco Santander[100], Regional Management[100]
Best Financial Stocks Year-to-Date:
Root [438.78%], Banco Macro[103.41%], Hippo [103.4%], Gladstone Capital[98.5%], Grupo Financiero[92.3%], EverQuote [78.59%], Banco BBVA[78.31%], Yiren Digital[68.91%], LendingTree [66.79%], Grupo Supervielle[66.63%], Victory Capital[51.02%] Best Financial Stocks This Week:
Office Properties[33.83%], LendingTree [33.43%], Industrial Logistics[23.69%], Heartland [22.55%], SelectQuote [20.19%], New York[17.68%], eXp World[16.9%], LendingClub [16.73%], Douglas Elliman[16.39%], RE/MAX [14.02%], Banco Macro[13.62%] Best Financial Stocks Daily:
RE/MAX [12.43%], Xenia Hotels[9.15%], Riverview Bancorp[8.78%], SelectQuote [7.50%], AG Mortgage[7.47%], Diversified Healthcare[7.44%], Nu [6.35%], Cipher Mining[6.18%], XP [6.13%], Orion Office[6.07%], Offerpad [5.85%]