
 Login Sign Up


| |||||
 |  | ||||

| 12Stocks.com Market Intelligence |
Best Financial Stocks
| In a hurry? Financial Stocks Lists: Performance Trends Table, Stock Charts
Sort Financial stocks: Daily, Weekly, Year-to-Date, Market Cap & Trends. Filter Financial stocks list by size:All Financial Large Mid-Range Small & MicroCap |
| 12Stocks.com Financial Stocks Performances & Trends Daily | |||||||||
|
|  The overall Smart Investing & Trading Score is 95 (0-bearish to 100-bullish) which puts Financial sector in short term bullish trend. The Smart Investing & Trading Score from previous trading session is 100 and hence a deterioration of trend.
| ||||||||
Here are the Smart Investing & Trading Scores of the most requested Financial stocks at 12Stocks.com (click stock name for detailed review):
|


| 12Stocks.com: Investing in Financial sector with Stocks | |
|
The following table helps investors and traders sort through current performance and trends (as measured by Smart Investing & Trading Score) of various
stocks in the Financial sector. Quick View: Move mouse or cursor over stock symbol (ticker) to view short-term Technical chart and over stock name to view long term chart. Click on  to add stock symbol to your watchlist and to add stock symbol to your watchlist and  to view watchlist. Click on any ticker or stock name for detailed market intelligence report for that stock. to view watchlist. Click on any ticker or stock name for detailed market intelligence report for that stock. |
12Stocks.com Performance of Stocks in Financial Sector
| Ticker | Stock Name | Watchlist | Category | Recent Price | Smart Investing & Trading Score | Change % | YTD Change% |
| HIX | Western Asset |   | Closed-End Fund - Debt | 4.40 | 73 | -0.45% | -11.29% |
| PECO | Phillips Edison | | REIT - Retail | 32.65 | 25 | -0.50% | -11.36% |
| APLE | Apple Hospitality | | REIT | 14.72 | 10 | 0.41% | -11.38% |
| MOON | Direxion Moonshot | | Exchange Traded Fund | 10.07 | 47 | -2.61% | -11.51% |
| FG | F&G Annuities | | Insurance - Life | 40.74 | 73 | -0.54% | -11.64% |
| WABC | Westamerica Ban | | Regional Banks | 49.84 | 83 | 0.54% | -11.65% |
| EPR | EPR Properties | | REIT - Retail | 42.80 | 83 | -1.06% | -11.66% |
| FBMS | First Bancshares | | Regional Banks | 25.89 | 95 | 0.35% | -11.73% |
| HFWA | Heritage | | Regional Banks | 18.87 | 90 | 0.59% | -11.78% |
| FMNB | Farmers National | | Regional Banks | 12.73 | 54 | 1.15% | -11.87% |
| ILPT | Industrial Logistics | | REIT - Industrial | 4.14 | 78 | -2.82% | -11.91% |
| CAC | Camden National | | Regional Banks | 33.14 | 95 | -0.78% | -11.93% |
| TD | Toronto-Dominion Bank | | Banks | 56.88 | 35 | -0.02% | -11.98% |
| FRHC | Freedom Holding | | Asset Mgmt | 70.94 | 57 | -0.76% | -11.98% |
| UBFO | United Security | | Regional Banks | 7.39 | 57 | 0.00% | -12.13% |
| VNO | Vornado Realty | | REIT - | 24.80 | 25 | -2.44% | -12.21% |
| HRZN | Horizon Technology | | Asset Mgmt | 11.56 | 18 | -1.58% | -12.22% |
| FISI | Institutions | | Regional Banks | 18.70 | 76 | 1.05% | -12.23% |
| JBGS | JBG SMITH | | Property Mgmt | 14.92 | 42 | -0.20% | -12.29% |
| EVBN | Evans Bancorp | | Regional Banks | 27.62 | 74 | 1.36% | -12.40% |
| FSBC | Five Star | | Banks - Regional | 22.90 | 74 | 1.33% | -12.53% |
| SASR | Sandy Spring | | Regional Banks | 23.80 | 95 | 0.98% | -12.63% |
| CHMG | Chemung | | Regional Banks | 43.50 | 93 | -0.46% | -12.65% |
| JRVR | James River | | Insurance | 8.07 | 35 | -0.37% | -12.66% |
| BHF | Brighthouse | | Life Insurance | 46.21 | 31 | 1.23% | -12.68% |
| For chart view version of above stock list: Chart View ➞ 0 - 25 , 25 - 50 , 50 - 75 , 75 - 100 , 100 - 125 , 125 - 150 , 150 - 175 , 175 - 200 , 200 - 225 , 225 - 250 , 250 - 275 , 275 - 300 , 300 - 325 , 325 - 350 , 350 - 375 , 375 - 400 , 400 - 425 , 425 - 450 , 450 - 475 , 475 - 500 , 500 - 525 , 525 - 550 , 550 - 575 , 575 - 600 , 600 - 625 , 625 - 650 , 650 - 675 , 675 - 700 , 700 - 725 , 725 - 750 , 750 - 775 , 775 - 800 , 800 - 825 , 825 - 850 , 850 - 875 , 875 - 900 , 900 - 925 , 925 - 950 , 950 - 975 , 975 - 1000 , 1000 - 1025 , 1025 - 1050 , 1050 - 1075 , 1075 - 1100 , 1100 - 1125 , 1125 - 1150 , 1150 - 1175 , 1175 - 1200 , 1200 - 1225 | ||
 | Click To Change The Sort Order: By Market Cap or Company Size Performance: Year-to-date, Week and Day |  |
|
Get the most comprehensive stock market coverage daily at 12Stocks.com ➞ Best Stocks Today ➞ Best Stocks Weekly ➞ Best Stocks Year-to-Date ➞ Best Stocks Trends ➞  Best Stocks Today 12Stocks.com Best Nasdaq Stocks ➞ Best S&P 500 Stocks ➞ Best Tech Stocks ➞ Best Biotech Stocks ➞ |
| Detailed Overview of Financial Stocks |
| Financial Technical Overview, Leaders & Laggards, Top Financial ETF Funds & Detailed Financial Stocks List, Charts, Trends & More |
| Financial Sector: Technical Analysis, Trends & YTD Performance | |
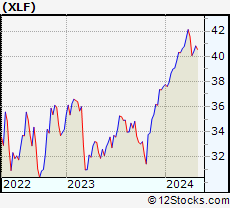
| Financial sector is composed of stocks
from banks, brokers, insurance, REITs
and services subsectors. Financial sector, as represented by XLF, an exchange-traded fund [ETF] that holds basket of Financial stocks (e.g, Bank of America, Goldman Sachs) is up by 12.18% and is currently outperforming the overall market by 1.76% year-to-date. Below is a quick view of Technical charts and trends: |
|
 XLF Weekly Chart |
|
| Long Term Trend: Very Good | |
| Medium Term Trend: Very Good | |
 XLF Daily Chart |
|
| Short Term Trend: Very Good | |
| Overall Trend Score: 95 | |
| YTD Performance: 12.18% | |
| **Trend Scores & Views Are Only For Educational Purposes And Not For Investing | |
| 12Stocks.com: Top Performing Financial Sector Stocks | ||||||||||||||||||||||||||||||||||||||||||||||||
 The top performing Financial sector stocks year to date are
Now, more recently, over last week, the top performing Financial sector stocks on the move are


|
||||||||||||||||||||||||||||||||||||||||||||||||
| 12Stocks.com: Investing in Financial Sector using Exchange Traded Funds | |
|
The following table shows list of key exchange traded funds (ETF) that
help investors track Financial Index. For detailed view, check out our ETF Funds section of our website. Quick View: Move mouse or cursor over ETF symbol (ticker) to view short-term Technical chart and over ETF name to view long term chart. Click on ticker or stock name for detailed view. Click on to add stock symbol to your watchlist and to view watchlist. |
12Stocks.com List of ETFs that track Financial Index
| Ticker | ETF Name | Watchlist | Recent Price | Smart Investing & Trading Score | Change % | Week % | Year-to-date % |
| XLF | Financial | | 42.18 | 95 | 0.00 | 0.84 | 12.18% |
| IAI | Broker-Dealers & Secs | | 118.20 | 95 | -0.63 | 1.49 | 8.91% |
| IYF | Financials | | 96.44 | 100 | 0.63 | 1.3 | 12.91% |
| IYG | Financial Services | | 67.01 | 95 | 0.09 | 1.41 | 12.18% |
| KRE | Regional Banking | | 51.08 | 83 | 0.25 | 1.44 | -2.58% |
| IXG | Global Financials | | 88.53 | 95 | 0.22 | 1.19 | 12.66% |
| VFH | Financials | | 102.82 | 100 | 0.68 | 1.27 | 11.45% |
| KBE | Bank | | 47.72 | 90 | -0.35 | 0.8 | 3.69% |
| FAS | Financial Bull 3X | | 110.32 | 95 | -0.18 | 2.2 | 33.48% |
| FAZ | Financial Bear 3X | | 9.92 | 10 | 0.10 | -2.07 | -27.43% |
| UYG | Financials | | 68.14 | 95 | 0.71 | 2.17 | 23.44% |
| IAT | Regional Banks | | 43.53 | 90 | -0.26 | 1.29 | 4.05% |
| KIE | Insurance | | 51.38 | 95 | 0.71 | 0.21 | 13.62% |
| PSCF | SmallCap Financials | | 48.83 | 88 | -0.14 | 1.03 | -0.71% |
| EUFN | Europe Financials | | 23.97 | 95 | 0.33 | 1.83 | 14.36% |
| PGF | Financial Preferred | | 14.82 | 57 | -0.30 | 0.78 | 1.68% |
| 12Stocks.com: Charts, Trends, Fundamental Data and Performances of Financial Stocks | |
|
We now take in-depth look at all Financial stocks including charts, multi-period performances and overall trends (as measured by Smart Investing & Trading Score). One can sort Financial stocks (click link to choose) by Daily, Weekly and by Year-to-Date performances. Also, one can sort by size of the company or by market capitalization. |
| Select Your Default Chart Type: | |||||
| |||||
| Click on stock symbol or name for detailed view. Click on to add stock symbol to your watchlist and to view watchlist. Quick View: Move mouse or cursor over "Daily" to quickly view daily Technical stock chart and over "Weekly" to view weekly Technical stock chart. | |||||

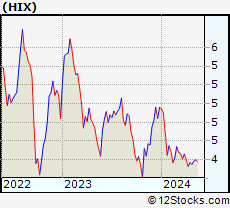 | HIX Western Asset High Income Fund II Inc. |
| Sector: Financials | |
| SubSector: Closed-End Fund - Debt | |
| MarketCap: 356.807 Millions | |
| Recent Price: 4.40 Smart Investing & Trading Score: 73 | |
| Day Percent Change: -0.45% Day Change: -0.02 | |
| Week Change: 0% Year-to-date Change: -11.3% | |
| HIX Links: Profile News Message Board | |
| Charts:- Daily , Weekly | |
| Add HIX to Watchlist: View: Get Complete HIX Trend Analysis ➞ | |
 | PECO Phillips Edison & Company, Inc. |
| Sector: Financials | |
| SubSector: REIT - Retail | |
| MarketCap: 3920 Millions | |
| Recent Price: 32.65 Smart Investing & Trading Score: 25 | |
| Day Percent Change: -0.50% Day Change: -0.16 | |
| Week Change: -0.74% Year-to-date Change: -11.4% | |
| PECO Links: Profile News Message Board | |
| Charts:- Daily , Weekly | |
| Add PECO to Watchlist: View: Get Complete PECO Trend Analysis ➞ | |
 | APLE Apple Hospitality REIT, Inc. |
| Sector: Financials | |
| SubSector: REIT - Hotel/Motel | |
| MarketCap: 1515.74 Millions | |
| Recent Price: 14.72 Smart Investing & Trading Score: 10 | |
| Day Percent Change: 0.41% Day Change: 0.06 | |
| Week Change: -0.81% Year-to-date Change: -11.4% | |
| APLE Links: Profile News Message Board | |
| Charts:- Daily , Weekly | |
| Add APLE to Watchlist: View: Get Complete APLE Trend Analysis ➞ | |
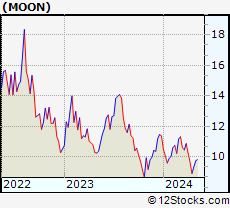 | MOON Direxion Moonshot Innovators ETF |
| Sector: Financials | |
| SubSector: Exchange Traded Fund | |
| MarketCap: 60157 Millions | |
| Recent Price: 10.07 Smart Investing & Trading Score: 47 | |
| Day Percent Change: -2.61% Day Change: -0.27 | |
| Week Change: 5.22% Year-to-date Change: -11.5% | |
| MOON Links: Profile News Message Board | |
| Charts:- Daily , Weekly | |
| Add MOON to Watchlist: View: Get Complete MOON Trend Analysis ➞ | |
 | FG F&G Annuities & Life, Inc. |
| Sector: Financials | |
| SubSector: Insurance - Life | |
| MarketCap: 2960 Millions | |
| Recent Price: 40.74 Smart Investing & Trading Score: 73 | |
| Day Percent Change: -0.54% Day Change: -0.22 | |
| Week Change: 0.25% Year-to-date Change: -11.6% | |
| FG Links: Profile News Message Board | |
| Charts:- Daily , Weekly | |
| Add FG to Watchlist: View: Get Complete FG Trend Analysis ➞ | |
 | WABC Westamerica Bancorporation |
| Sector: Financials | |
| SubSector: Regional - Pacific Banks | |
| MarketCap: 1557.69 Millions | |
| Recent Price: 49.84 Smart Investing & Trading Score: 83 | |
| Day Percent Change: 0.54% Day Change: 0.27 | |
| Week Change: -0.36% Year-to-date Change: -11.7% | |
| WABC Links: Profile News Message Board | |
| Charts:- Daily , Weekly | |
| Add WABC to Watchlist: View: Get Complete WABC Trend Analysis ➞ | |
 | EPR EPR Properties |
| Sector: Financials | |
| SubSector: REIT - Retail | |
| MarketCap: 2217.64 Millions | |
| Recent Price: 42.80 Smart Investing & Trading Score: 83 | |
| Day Percent Change: -1.06% Day Change: -0.46 | |
| Week Change: 3.01% Year-to-date Change: -11.7% | |
| EPR Links: Profile News Message Board | |
| Charts:- Daily , Weekly | |
| Add EPR to Watchlist: View: Get Complete EPR Trend Analysis ➞ | |
 | FBMS The First Bancshares, Inc. |
| Sector: Financials | |
| SubSector: Regional - Southeast Banks | |
| MarketCap: 359.535 Millions | |
| Recent Price: 25.89 Smart Investing & Trading Score: 95 | |
| Day Percent Change: 0.35% Day Change: 0.09 | |
| Week Change: 1.53% Year-to-date Change: -11.7% | |
| FBMS Links: Profile News Message Board | |
| Charts:- Daily , Weekly | |
| Add FBMS to Watchlist: View: Get Complete FBMS Trend Analysis ➞ | |
 | HFWA Heritage Financial Corporation |
| Sector: Financials | |
| SubSector: Regional - Pacific Banks | |
| MarketCap: 752.829 Millions | |
| Recent Price: 18.87 Smart Investing & Trading Score: 90 | |
| Day Percent Change: 0.59% Day Change: 0.11 | |
| Week Change: 0.64% Year-to-date Change: -11.8% | |
| HFWA Links: Profile News Message Board | |
| Charts:- Daily , Weekly | |
| Add HFWA to Watchlist: View: Get Complete HFWA Trend Analysis ➞ | |
 | FMNB Farmers National Banc Corp. |
| Sector: Financials | |
| SubSector: Regional - Midwest Banks | |
| MarketCap: 366.57 Millions | |
| Recent Price: 12.73 Smart Investing & Trading Score: 54 | |
| Day Percent Change: 1.15% Day Change: 0.14 | |
| Week Change: 0.2% Year-to-date Change: -11.9% | |
| FMNB Links: Profile News Message Board | |
| Charts:- Daily , Weekly | |
| Add FMNB to Watchlist: View: Get Complete FMNB Trend Analysis ➞ | |
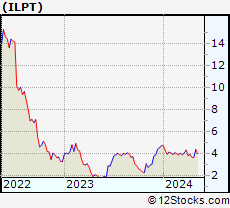 | ILPT Industrial Logistics Properties Trust |
| Sector: Financials | |
| SubSector: REIT - Industrial | |
| MarketCap: 988.549 Millions | |
| Recent Price: 4.14 Smart Investing & Trading Score: 78 | |
| Day Percent Change: -2.82% Day Change: -0.12 | |
| Week Change: 3.76% Year-to-date Change: -11.9% | |
| ILPT Links: Profile News Message Board | |
| Charts:- Daily , Weekly | |
| Add ILPT to Watchlist: View: Get Complete ILPT Trend Analysis ➞ | |
 | CAC Camden National Corporation |
| Sector: Financials | |
| SubSector: Regional - Northeast Banks | |
| MarketCap: 550.999 Millions | |
| Recent Price: 33.14 Smart Investing & Trading Score: 95 | |
| Day Percent Change: -0.78% Day Change: -0.26 | |
| Week Change: 2.32% Year-to-date Change: -11.9% | |
| CAC Links: Profile News Message Board | |
| Charts:- Daily , Weekly | |
| Add CAC to Watchlist: View: Get Complete CAC Trend Analysis ➞ | |
 | TD The Toronto-Dominion Bank |
| Sector: Financials | |
| SubSector: Money Center Banks | |
| MarketCap: 75152.4 Millions | |
| Recent Price: 56.88 Smart Investing & Trading Score: 35 | |
| Day Percent Change: -0.02% Day Change: -0.01 | |
| Week Change: 0.46% Year-to-date Change: -12.0% | |
| TD Links: Profile News Message Board | |
| Charts:- Daily , Weekly | |
| Add TD to Watchlist: View: Get Complete TD Trend Analysis ➞ | |
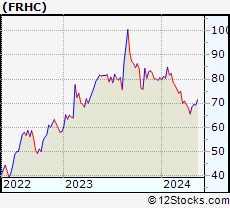 | FRHC Freedom Holding Corp. |
| Sector: Financials | |
| SubSector: Asset Management | |
| MarketCap: 777.003 Millions | |
| Recent Price: 70.94 Smart Investing & Trading Score: 57 | |
| Day Percent Change: -0.76% Day Change: -0.55 | |
| Week Change: 2.51% Year-to-date Change: -12.0% | |
| FRHC Links: Profile News Message Board | |
| Charts:- Daily , Weekly | |
| Add FRHC to Watchlist: View: Get Complete FRHC Trend Analysis ➞ | |
 | UBFO United Security Bancshares |
| Sector: Financials | |
| SubSector: Regional - Pacific Banks | |
| MarketCap: 135.029 Millions | |
| Recent Price: 7.39 Smart Investing & Trading Score: 57 | |
| Day Percent Change: 0.00% Day Change: 0.00 | |
| Week Change: 1.93% Year-to-date Change: -12.1% | |
| UBFO Links: Profile News Message Board | |
| Charts:- Daily , Weekly | |
| Add UBFO to Watchlist: View: Get Complete UBFO Trend Analysis ➞ | |
 | VNO Vornado Realty Trust |
| Sector: Financials | |
| SubSector: REIT - Diversified | |
| MarketCap: 6300.63 Millions | |
| Recent Price: 24.80 Smart Investing & Trading Score: 25 | |
| Day Percent Change: -2.44% Day Change: -0.62 | |
| Week Change: 2.39% Year-to-date Change: -12.2% | |
| VNO Links: Profile News Message Board | |
| Charts:- Daily , Weekly | |
| Add VNO to Watchlist: View: Get Complete VNO Trend Analysis ➞ | |
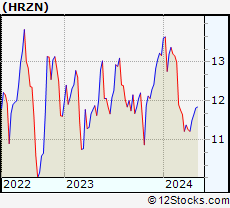 | HRZN Horizon Technology Finance Corporation |
| Sector: Financials | |
| SubSector: Asset Management | |
| MarketCap: 109.203 Millions | |
| Recent Price: 11.56 Smart Investing & Trading Score: 18 | |
| Day Percent Change: -1.58% Day Change: -0.18 | |
| Week Change: -2.36% Year-to-date Change: -12.2% | |
| HRZN Links: Profile News Message Board | |
| Charts:- Daily , Weekly | |
| Add HRZN to Watchlist: View: Get Complete HRZN Trend Analysis ➞ | |
 | FISI Financial Institutions, Inc. |
| Sector: Financials | |
| SubSector: Regional - Mid-Atlantic Banks | |
| MarketCap: 253.459 Millions | |
| Recent Price: 18.70 Smart Investing & Trading Score: 76 | |
| Day Percent Change: 1.05% Day Change: 0.20 | |
| Week Change: -0.93% Year-to-date Change: -12.2% | |
| FISI Links: Profile News Message Board | |
| Charts:- Daily , Weekly | |
| Add FISI to Watchlist: View: Get Complete FISI Trend Analysis ➞ | |
 | JBGS JBG SMITH Properties |
| Sector: Financials | |
| SubSector: Property Management | |
| MarketCap: 4335.32 Millions | |
| Recent Price: 14.92 Smart Investing & Trading Score: 42 | |
| Day Percent Change: -0.20% Day Change: -0.03 | |
| Week Change: 2.9% Year-to-date Change: -12.3% | |
| JBGS Links: Profile News Message Board | |
| Charts:- Daily , Weekly | |
| Add JBGS to Watchlist: View: Get Complete JBGS Trend Analysis ➞ | |
 | EVBN Evans Bancorp, Inc. |
| Sector: Financials | |
| SubSector: Regional - Northeast Banks | |
| MarketCap: 124.899 Millions | |
| Recent Price: 27.62 Smart Investing & Trading Score: 74 | |
| Day Percent Change: 1.36% Day Change: 0.37 | |
| Week Change: 4.54% Year-to-date Change: -12.4% | |
| EVBN Links: Profile News Message Board | |
| Charts:- Daily , Weekly | |
| Add EVBN to Watchlist: View: Get Complete EVBN Trend Analysis ➞ | |
 | FSBC Five Star Bancorp |
| Sector: Financials | |
| SubSector: Banks - Regional | |
| MarketCap: 377 Millions | |
| Recent Price: 22.90 Smart Investing & Trading Score: 74 | |
| Day Percent Change: 1.33% Day Change: 0.30 | |
| Week Change: 1.6% Year-to-date Change: -12.5% | |
| FSBC Links: Profile News Message Board | |
| Charts:- Daily , Weekly | |
| Add FSBC to Watchlist: View: Get Complete FSBC Trend Analysis ➞ | |
 | SASR Sandy Spring Bancorp, Inc. |
| Sector: Financials | |
| SubSector: Regional - Mid-Atlantic Banks | |
| MarketCap: 764.659 Millions | |
| Recent Price: 23.80 Smart Investing & Trading Score: 95 | |
| Day Percent Change: 0.98% Day Change: 0.23 | |
| Week Change: 4.25% Year-to-date Change: -12.6% | |
| SASR Links: Profile News Message Board | |
| Charts:- Daily , Weekly | |
| Add SASR to Watchlist: View: Get Complete SASR Trend Analysis ➞ | |
 | CHMG Chemung Financial Corporation |
| Sector: Financials | |
| SubSector: Regional - Pacific Banks | |
| MarketCap: 142.229 Millions | |
| Recent Price: 43.50 Smart Investing & Trading Score: 93 | |
| Day Percent Change: -0.46% Day Change: -0.20 | |
| Week Change: 0.46% Year-to-date Change: -12.7% | |
| CHMG Links: Profile News Message Board | |
| Charts:- Daily , Weekly | |
| Add CHMG to Watchlist: View: Get Complete CHMG Trend Analysis ➞ | |
 | JRVR James River Group Holdings, Ltd. |
| Sector: Financials | |
| SubSector: Property & Casualty Insurance | |
| MarketCap: 978.312 Millions | |
| Recent Price: 8.07 Smart Investing & Trading Score: 35 | |
| Day Percent Change: -0.37% Day Change: -0.03 | |
| Week Change: 4.81% Year-to-date Change: -12.7% | |
| JRVR Links: Profile News Message Board | |
| Charts:- Daily , Weekly | |
| Add JRVR to Watchlist: View: Get Complete JRVR Trend Analysis ➞ | |
 | BHF Brighthouse Financial, Inc. |
| Sector: Financials | |
| SubSector: Life Insurance | |
| MarketCap: 2045.06 Millions | |
| Recent Price: 46.21 Smart Investing & Trading Score: 31 | |
| Day Percent Change: 1.23% Day Change: 0.56 | |
| Week Change: 0.3% Year-to-date Change: -12.7% | |
| BHF Links: Profile News Message Board | |
| Charts:- Daily , Weekly | |
| Add BHF to Watchlist: View: Get Complete BHF Trend Analysis ➞ | |
| For tabular summary view of above stock list: Summary View ➞ 0 - 25 , 25 - 50 , 50 - 75 , 75 - 100 , 100 - 125 , 125 - 150 , 150 - 175 , 175 - 200 , 200 - 225 , 225 - 250 , 250 - 275 , 275 - 300 , 300 - 325 , 325 - 350 , 350 - 375 , 375 - 400 , 400 - 425 , 425 - 450 , 450 - 475 , 475 - 500 , 500 - 525 , 525 - 550 , 550 - 575 , 575 - 600 , 600 - 625 , 625 - 650 , 650 - 675 , 675 - 700 , 700 - 725 , 725 - 750 , 750 - 775 , 775 - 800 , 800 - 825 , 825 - 850 , 850 - 875 , 875 - 900 , 900 - 925 , 925 - 950 , 950 - 975 , 975 - 1000 , 1000 - 1025 , 1025 - 1050 , 1050 - 1075 , 1075 - 1100 , 1100 - 1125 , 1125 - 1150 , 1150 - 1175 , 1175 - 1200 , 1200 - 1225 | ||
| Click To Change The Sort Order: By Market Cap or Company Size Performance: Year-to-date, Week and Day | |
| Select Chart Type: | ||
|
Best Stocks Today 12Stocks.com |
© 2024 12Stocks.com Terms & Conditions Privacy Contact Us
All Information Provided Only For Education And Not To Be Used For Investing or Trading. See Terms & Conditions


One More Thing ... Get Best Stocks Delivered Daily!
Never Ever Miss A Move With Our Top Ten Stocks Lists
Find Best Stocks In Any Market - Bull or Bear Market
Take A Peek At Our Top Ten Stocks Lists: Daily, Weekly, Year-to-Date & Top Trends
Find Best Stocks In Any Market - Bull or Bear Market
Take A Peek At Our Top Ten Stocks Lists: Daily, Weekly, Year-to-Date & Top Trends
Financial Stocks With Best Up Trends [0-bearish to 100-bullish]: Trupanion [100], Corebridge [100], Tejon Ranch[100], KE [100], Chubb [100], Siebert [100], Xinyuan Real[100], EverQuote [100], Noah [100], TrustCo Bank[100], Cushman & Wakefield[100]
Best Financial Stocks Year-to-Date:
Root [492.02%], Banco Macro[126.66%], SelectQuote [122.63%], Grupo Financiero[112.22%], Banco BBVA[111.58%], Gladstone Capital[106.54%], EverQuote [99.51%], Hippo [90.34%], Grupo Supervielle[87.44%], Yiren Digital[61.54%], Vista Oil[60.86%] Best Financial Stocks This Week:
Trupanion [27.25%], Huize Holding[21.89%], Iris Energy[21.82%], Douglas Elliman[19.49%], SelectQuote [16.41%], Siebert [14.29%], Fathom [14.08%], Bridge [13.16%], Fangdd Network[12.3%], First Foundation[12.14%], KE [11.93%] Best Financial Stocks Daily:
Trupanion [15.88%], Iris Energy[12.21%], Fathom [9.46%], Douglas Elliman[9.30%], BRP [8.96%], Waterdrop [8.70%], Huize Holding[7.90%], Corebridge [7.79%], Tejon Ranch[5.94%], KE [5.40%], Chubb [4.71%]