
 Login Sign Up


| |||||
 |  | ||||

| 12Stocks.com Market Intelligence |
Best Financial Stocks
| In a hurry? Financial Stocks Lists: Performance Trends Table, Stock Charts
Sort Financial stocks: Daily, Weekly, Year-to-Date, Market Cap & Trends. Filter Financial stocks list by size:All Financial Large Mid-Range Small & MicroCap |
| 12Stocks.com Financial Stocks Performances & Trends Daily | |||||||||
|
|  The overall Smart Investing & Trading Score is 100 (0-bearish to 100-bullish) which puts Financial sector in short term bullish trend. The Smart Investing & Trading Score from previous trading session is 76 and hence an improvement of trend.
| ||||||||
Here are the Smart Investing & Trading Scores of the most requested Financial stocks at 12Stocks.com (click stock name for detailed review):
|


| 12Stocks.com: Investing in Financial sector with Stocks | |
|
The following table helps investors and traders sort through current performance and trends (as measured by Smart Investing & Trading Score) of various
stocks in the Financial sector. Quick View: Move mouse or cursor over stock symbol (ticker) to view short-term Technical chart and over stock name to view long term chart. Click on  to add stock symbol to your watchlist and to add stock symbol to your watchlist and  to view watchlist. Click on any ticker or stock name for detailed market intelligence report for that stock. to view watchlist. Click on any ticker or stock name for detailed market intelligence report for that stock. |
12Stocks.com Performance of Stocks in Financial Sector
| Ticker | Stock Name | Watchlist | Category | Recent Price | Smart Investing & Trading Score | Change % | YTD Change% |
| TSBK | Timberland Bancorp |   | S&L | 25.88 | 65 | 3.03% | -17.74% |
| TCI | Transcontinental Realty | | REIT - | 28.41 | 35 | 0.00% | -17.80% |
| REXR | Rexford Industrial | | REIT - Industrial | 45.90 | 69 | 1.12% | -18.18% |
| OVLY | Oak Valley | | Regional Banks | 24.45 | 50 | -0.85% | -18.36% |
| BCBP | BCB Bancorp | | Regional Banks | 10.47 | 75 | 2.25% | -18.52% |
| CMCT | CIM Commercial | | REIT - Industrial | 3.00 | 10 | -0.66% | -18.70% |
| PX | P10 | | Asset Mgmt | 8.28 | 60 | -0.48% | -18.98% |
| PFIS | Peoples | | Regional Banks | 39.44 | 74 | 0.41% | -19.01% |
| COLD | Americold Realty | | REIT - Industrial | 24.42 | 67 | 1.41% | -19.33% |
| PPBI | Pacific Premier | | Regional Banks | 23.45 | 95 | 0.73% | -19.44% |
| LGIH | LGI Homes | | Real Estatet | 107.23 | 74 | 5.70% | -19.47% |
| MOFG | MidWestOne | | Regional - Southwest Banks | 21.66 | 62 | 0.88% | -19.51% |
| CZNC | Citizens & Northern | | Regional Banks | 18.03 | 67 | 2.39% | -19.62% |
| FCCO | First Community | | Regional - Southwest Banks | 17.28 | 100 | 6.11% | -19.74% |
| CFFN | Capitol Federal | | S&L | 5.17 | 74 | 0.98% | -19.84% |
| BRDG | Bridge | | Asset Mgmt | 7.88 | 100 | 6.49% | -19.84% |
| MMI | Marcus & Millichap | | Real Estatet | 35.01 | 74 | 2.52% | -19.85% |
| GSHD | Goosehead Insurance | | Insurance | 60.67 | 40 | -0.33% | -19.96% |
| CIVB | Civista Bancshares | | Regional Banks | 14.73 | 45 | 0.55% | -20.12% |
| LOB | Live Oak | | S&L | 36.34 | 64 | 2.05% | -20.13% |
| FLIC | First of Long Island | | Regional Banks | 10.56 | 55 | 1.05% | -20.24% |
| PGC | Peapack-Gladstone | | Regional Banks | 23.75 | 74 | 0.30% | -20.36% |
| TMP | Tompkins | | Regional Banks | 47.92 | 87 | 1.18% | -20.44% |
| EBTC | Enterprise Bancorp | | S&L | 25.66 | 67 | 2.48% | -20.46% |
| SMBC | Southern Missouri | | S&L | 42.46 | 74 | 1.10% | -20.47% |
| For chart view version of above stock list: Chart View ➞ 0 - 25 , 25 - 50 , 50 - 75 , 75 - 100 , 100 - 125 , 125 - 150 , 150 - 175 , 175 - 200 , 200 - 225 , 225 - 250 , 250 - 275 , 275 - 300 , 300 - 325 , 325 - 350 , 350 - 375 , 375 - 400 , 400 - 425 , 425 - 450 , 450 - 475 , 475 - 500 , 500 - 525 , 525 - 550 , 550 - 575 , 575 - 600 , 600 - 625 , 625 - 650 , 650 - 675 , 675 - 700 , 700 - 725 , 725 - 750 , 750 - 775 , 775 - 800 , 800 - 825 , 825 - 850 , 850 - 875 , 875 - 900 , 900 - 925 , 925 - 950 , 950 - 975 , 975 - 1000 , 1000 - 1025 , 1025 - 1050 , 1050 - 1075 , 1075 - 1100 , 1100 - 1125 , 1125 - 1150 , 1150 - 1175 , 1175 - 1200 , 1200 - 1225 | ||
 | Click To Change The Sort Order: By Market Cap or Company Size Performance: Year-to-date, Week and Day |  |
|
Get the most comprehensive stock market coverage daily at 12Stocks.com ➞ Best Stocks Today ➞ Best Stocks Weekly ➞ Best Stocks Year-to-Date ➞ Best Stocks Trends ➞  Best Stocks Today 12Stocks.com Best Nasdaq Stocks ➞ Best S&P 500 Stocks ➞ Best Tech Stocks ➞ Best Biotech Stocks ➞ |
| Detailed Overview of Financial Stocks |
| Financial Technical Overview, Leaders & Laggards, Top Financial ETF Funds & Detailed Financial Stocks List, Charts, Trends & More |
| Financial Sector: Technical Analysis, Trends & YTD Performance | |
| Financial sector is composed of stocks
from banks, brokers, insurance, REITs
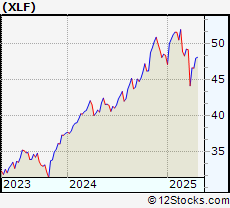
and services subsectors. Financial sector, as represented by XLF, an exchange-traded fund [ETF] that holds basket of Financial stocks (e.g, Bank of America, Goldman Sachs) is up by 12.18% and is currently outperforming the overall market by 1.46% year-to-date. Below is a quick view of Technical charts and trends: |
|
 XLF Weekly Chart |
|
| Long Term Trend: Very Good | |
| Medium Term Trend: Very Good | |
 XLF Daily Chart |
|
| Short Term Trend: Very Good | |
| Overall Trend Score: 100 | |
| YTD Performance: 12.18% | |
| **Trend Scores & Views Are Only For Educational Purposes And Not For Investing | |
| 12Stocks.com: Top Performing Financial Sector Stocks | ||||||||||||||||||||||||||||||||||||||||||||||||
 The top performing Financial sector stocks year to date are
Now, more recently, over last week, the top performing Financial sector stocks on the move are


|
||||||||||||||||||||||||||||||||||||||||||||||||
| 12Stocks.com: Investing in Financial Sector using Exchange Traded Funds | |
|
The following table shows list of key exchange traded funds (ETF) that
help investors track Financial Index. For detailed view, check out our ETF Funds section of our website. Quick View: Move mouse or cursor over ETF symbol (ticker) to view short-term Technical chart and over ETF name to view long term chart. Click on ticker or stock name for detailed view. Click on to add stock symbol to your watchlist and to view watchlist. |
12Stocks.com List of ETFs that track Financial Index
| Ticker | ETF Name | Watchlist | Recent Price | Smart Investing & Trading Score | Change % | Week % | Year-to-date % |
| XLF | Financial | | 42.18 | 100 | 0.74 | 0.84 | 12.18% |
| IAI | Broker-Dealers & Secs | | 118.95 | 100 | 1.57 | 2.14 | 9.6% |
| IYF | Financials | | 95.84 | 88 | 0.51 | 0.67 | 12.21% |
| IYG | Financial Services | | 66.95 | 100 | 1.16 | 1.32 | 12.08% |
| KRE | Regional Banking | | 50.95 | 90 | 0.12 | 1.19 | -2.82% |
| IXG | Global Financials | | 88.34 | 100 | 0.75 | 0.97 | 12.42% |
| VFH | Financials | | 102.13 | 88 | 0.47 | 0.59 | 10.7% |
| KBE | Bank | | 47.89 | 95 | 0.52 | 1.16 | 4.06% |
| FAS | Financial Bull 3X | | 110.52 | 100 | 2.32 | 2.39 | 33.72% |
| FAZ | Financial Bear 3X | | 9.91 | 0 | -2.17 | -2.17 | -27.51% |
| UYG | Financials | | 67.66 | 100 | 1.42 | 1.45 | 22.57% |
| IAT | Regional Banks | | 43.65 | 100 | 0.83 | 1.56 | 4.33% |
| KIE | Insurance | | 51.02 | 78 | -0.10 | -0.49 | 12.83% |
| PSCF | SmallCap Financials | | 48.90 | 100 | 1.31 | 1.17 | -0.57% |
| EUFN | Europe Financials | | 23.89 | 95 | 0.44 | 1.49 | 13.98% |
| PGF | Financial Preferred | | 14.87 | 64 | 1.23 | 1.09 | 1.99% |
| 12Stocks.com: Charts, Trends, Fundamental Data and Performances of Financial Stocks | |
|
We now take in-depth look at all Financial stocks including charts, multi-period performances and overall trends (as measured by Smart Investing & Trading Score). One can sort Financial stocks (click link to choose) by Daily, Weekly and by Year-to-Date performances. Also, one can sort by size of the company or by market capitalization. |
| Select Your Default Chart Type: | |||||
| |||||
| Click on stock symbol or name for detailed view. Click on to add stock symbol to your watchlist and to view watchlist. Quick View: Move mouse or cursor over "Daily" to quickly view daily Technical stock chart and over "Weekly" to view weekly Technical stock chart. | |||||

 | TSBK Timberland Bancorp, Inc. |
| Sector: Financials | |
| SubSector: Savings & Loans | |
| MarketCap: 155.03 Millions | |
| Recent Price: 25.88 Smart Investing & Trading Score: 65 | |
| Day Percent Change: 3.03% Day Change: 0.76 | |
| Week Change: -0.92% Year-to-date Change: -17.7% | |
| TSBK Links: Profile News Message Board | |
| Charts:- Daily , Weekly | |
| Add TSBK to Watchlist: View: Get Complete TSBK Trend Analysis ➞ | |
 | TCI Transcontinental Realty Investors, Inc. |
| Sector: Financials | |
| SubSector: REIT - Diversified | |
| MarketCap: 158.653 Millions | |
| Recent Price: 28.41 Smart Investing & Trading Score: 35 | |
| Day Percent Change: 0.00% Day Change: 0.00 | |
| Week Change: 0.21% Year-to-date Change: -17.8% | |
| TCI Links: Profile News Message Board | |
| Charts:- Daily , Weekly | |
| Add TCI to Watchlist: View: Get Complete TCI Trend Analysis ➞ | |
 | REXR Rexford Industrial Realty, Inc. |
| Sector: Financials | |
| SubSector: REIT - Industrial | |
| MarketCap: 4185.99 Millions | |
| Recent Price: 45.90 Smart Investing & Trading Score: 69 | |
| Day Percent Change: 1.12% Day Change: 0.51 | |
| Week Change: 1.75% Year-to-date Change: -18.2% | |
| REXR Links: Profile News Message Board | |
| Charts:- Daily , Weekly | |
| Add REXR to Watchlist: View: Get Complete REXR Trend Analysis ➞ | |
 | OVLY Oak Valley Bancorp |
| Sector: Financials | |
| SubSector: Regional - Pacific Banks | |
| MarketCap: 148.429 Millions | |
| Recent Price: 24.45 Smart Investing & Trading Score: 50 | |
| Day Percent Change: -0.85% Day Change: -0.21 | |
| Week Change: 2.95% Year-to-date Change: -18.4% | |
| OVLY Links: Profile News Message Board | |
| Charts:- Daily , Weekly | |
| Add OVLY to Watchlist: View: Get Complete OVLY Trend Analysis ➞ | |
 | BCBP BCB Bancorp, Inc. |
| Sector: Financials | |
| SubSector: Regional - Northeast Banks | |
| MarketCap: 196.799 Millions | |
| Recent Price: 10.47 Smart Investing & Trading Score: 75 | |
| Day Percent Change: 2.25% Day Change: 0.23 | |
| Week Change: -0.38% Year-to-date Change: -18.5% | |
| BCBP Links: Profile News Message Board | |
| Charts:- Daily , Weekly | |
| Add BCBP to Watchlist: View: Get Complete BCBP Trend Analysis ➞ | |
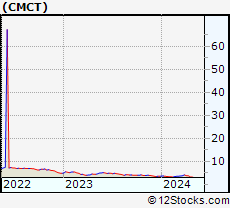 | CMCT CIM Commercial Trust Corporation |
| Sector: Financials | |
| SubSector: REIT - Industrial | |
| MarketCap: 167.049 Millions | |
| Recent Price: 3.00 Smart Investing & Trading Score: 10 | |
| Day Percent Change: -0.66% Day Change: -0.02 | |
| Week Change: -2.44% Year-to-date Change: -18.7% | |
| CMCT Links: Profile News Message Board | |
| Charts:- Daily , Weekly | |
| Add CMCT to Watchlist: View: Get Complete CMCT Trend Analysis ➞ | |
 | PX P10, Inc. |
| Sector: Financials | |
| SubSector: Asset Management | |
| MarketCap: 1300 Millions | |
| Recent Price: 8.28 Smart Investing & Trading Score: 60 | |
| Day Percent Change: -0.48% Day Change: -0.04 | |
| Week Change: 1.22% Year-to-date Change: -19.0% | |
| PX Links: Profile News Message Board | |
| Charts:- Daily , Weekly | |
| Add PX to Watchlist: View: Get Complete PX Trend Analysis ➞ | |
 | PFIS Peoples Financial Services Corp. |
| Sector: Financials | |
| SubSector: Regional - Northeast Banks | |
| MarketCap: 305.499 Millions | |
| Recent Price: 39.44 Smart Investing & Trading Score: 74 | |
| Day Percent Change: 0.41% Day Change: 0.16 | |
| Week Change: 2.04% Year-to-date Change: -19.0% | |
| PFIS Links: Profile News Message Board | |
| Charts:- Daily , Weekly | |
| Add PFIS to Watchlist: View: Get Complete PFIS Trend Analysis ➞ | |
 | COLD Americold Realty Trust |
| Sector: Financials | |
| SubSector: REIT - Industrial | |
| MarketCap: 6569.69 Millions | |
| Recent Price: 24.42 Smart Investing & Trading Score: 67 | |
| Day Percent Change: 1.41% Day Change: 0.34 | |
| Week Change: 1.26% Year-to-date Change: -19.3% | |
| COLD Links: Profile News Message Board | |
| Charts:- Daily , Weekly | |
| Add COLD to Watchlist: View: Get Complete COLD Trend Analysis ➞ | |
 | PPBI Pacific Premier Bancorp, Inc. |
| Sector: Financials | |
| SubSector: Regional - Pacific Banks | |
| MarketCap: 978.029 Millions | |
| Recent Price: 23.45 Smart Investing & Trading Score: 95 | |
| Day Percent Change: 0.73% Day Change: 0.17 | |
| Week Change: 0.73% Year-to-date Change: -19.4% | |
| PPBI Links: Profile News Message Board | |
| Charts:- Daily , Weekly | |
| Add PPBI to Watchlist: View: Get Complete PPBI Trend Analysis ➞ | |
 | LGIH LGI Homes, Inc. |
| Sector: Financials | |
| SubSector: Real Estate Development | |
| MarketCap: 1316.49 Millions | |
| Recent Price: 107.23 Smart Investing & Trading Score: 74 | |
| Day Percent Change: 5.70% Day Change: 5.78 | |
| Week Change: 7.89% Year-to-date Change: -19.5% | |
| LGIH Links: Profile News Message Board | |
| Charts:- Daily , Weekly | |
| Add LGIH to Watchlist: View: Get Complete LGIH Trend Analysis ➞ | |
 | MOFG MidWestOne Financial Group, Inc. |
| Sector: Financials | |
| SubSector: Regional - Southwest Banks | |
| MarketCap: 345.265 Millions | |
| Recent Price: 21.66 Smart Investing & Trading Score: 62 | |
| Day Percent Change: 0.88% Day Change: 0.19 | |
| Week Change: -0.23% Year-to-date Change: -19.5% | |
| MOFG Links: Profile News Message Board | |
| Charts:- Daily , Weekly | |
| Add MOFG to Watchlist: View: Get Complete MOFG Trend Analysis ➞ | |
 | CZNC Citizens & Northern Corporation |
| Sector: Financials | |
| SubSector: Regional - Mid-Atlantic Banks | |
| MarketCap: 274.459 Millions | |
| Recent Price: 18.03 Smart Investing & Trading Score: 67 | |
| Day Percent Change: 2.39% Day Change: 0.42 | |
| Week Change: 0.78% Year-to-date Change: -19.6% | |
| CZNC Links: Profile News Message Board | |
| Charts:- Daily , Weekly | |
| Add CZNC to Watchlist: View: Get Complete CZNC Trend Analysis ➞ | |
 | FCCO First Community Corporation |
| Sector: Financials | |
| SubSector: Regional - Southwest Banks | |
| MarketCap: 123.865 Millions | |
| Recent Price: 17.28 Smart Investing & Trading Score: 100 | |
| Day Percent Change: 6.11% Day Change: 1.00 | |
| Week Change: 7.13% Year-to-date Change: -19.7% | |
| FCCO Links: Profile News Message Board | |
| Charts:- Daily , Weekly | |
| Add FCCO to Watchlist: View: Get Complete FCCO Trend Analysis ➞ | |
 | CFFN Capitol Federal Financial, Inc. |
| Sector: Financials | |
| SubSector: Savings & Loans | |
| MarketCap: 1639.1 Millions | |
| Recent Price: 5.17 Smart Investing & Trading Score: 74 | |
| Day Percent Change: 0.98% Day Change: 0.05 | |
| Week Change: 1.57% Year-to-date Change: -19.8% | |
| CFFN Links: Profile News Message Board | |
| Charts:- Daily , Weekly | |
| Add CFFN to Watchlist: View: Get Complete CFFN Trend Analysis ➞ | |
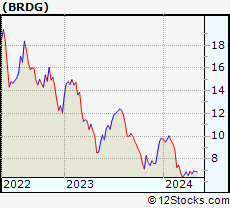 | BRDG Bridge Investment Group Holdings Inc. |
| Sector: Financials | |
| SubSector: Asset Management | |
| MarketCap: 1320 Millions | |
| Recent Price: 7.88 Smart Investing & Trading Score: 100 | |
| Day Percent Change: 6.49% Day Change: 0.48 | |
| Week Change: 15.2% Year-to-date Change: -19.8% | |
| BRDG Links: Profile News Message Board | |
| Charts:- Daily , Weekly | |
| Add BRDG to Watchlist: View: Get Complete BRDG Trend Analysis ➞ | |
 | MMI Marcus & Millichap, Inc. |
| Sector: Financials | |
| SubSector: Real Estate Development | |
| MarketCap: 1005.19 Millions | |
| Recent Price: 35.01 Smart Investing & Trading Score: 74 | |
| Day Percent Change: 2.52% Day Change: 0.86 | |
| Week Change: 3.95% Year-to-date Change: -19.9% | |
| MMI Links: Profile News Message Board | |
| Charts:- Daily , Weekly | |
| Add MMI to Watchlist: View: Get Complete MMI Trend Analysis ➞ | |
 | GSHD Goosehead Insurance, Inc |
| Sector: Financials | |
| SubSector: Insurance Brokers | |
| MarketCap: 1863.57 Millions | |
| Recent Price: 60.67 Smart Investing & Trading Score: 40 | |
| Day Percent Change: -0.33% Day Change: -0.20 | |
| Week Change: 0.52% Year-to-date Change: -20.0% | |
| GSHD Links: Profile News Message Board | |
| Charts:- Daily , Weekly | |
| Add GSHD to Watchlist: View: Get Complete GSHD Trend Analysis ➞ | |
 | CIVB Civista Bancshares, Inc. |
| Sector: Financials | |
| SubSector: Regional - Pacific Banks | |
| MarketCap: 255.929 Millions | |
| Recent Price: 14.73 Smart Investing & Trading Score: 45 | |
| Day Percent Change: 0.55% Day Change: 0.08 | |
| Week Change: -0.67% Year-to-date Change: -20.1% | |
| CIVB Links: Profile News Message Board | |
| Charts:- Daily , Weekly | |
| Add CIVB to Watchlist: View: Get Complete CIVB Trend Analysis ➞ | |
 | LOB Live Oak Bancshares, Inc. |
| Sector: Financials | |
| SubSector: Savings & Loans | |
| MarketCap: 394.23 Millions | |
| Recent Price: 36.34 Smart Investing & Trading Score: 64 | |
| Day Percent Change: 2.05% Day Change: 0.73 | |
| Week Change: 3.18% Year-to-date Change: -20.1% | |
| LOB Links: Profile News Message Board | |
| Charts:- Daily , Weekly | |
| Add LOB to Watchlist: View: Get Complete LOB Trend Analysis ➞ | |
 | FLIC The First of Long Island Corporation |
| Sector: Financials | |
| SubSector: Regional - Northeast Banks | |
| MarketCap: 352.899 Millions | |
| Recent Price: 10.56 Smart Investing & Trading Score: 55 | |
| Day Percent Change: 1.05% Day Change: 0.11 | |
| Week Change: 0.76% Year-to-date Change: -20.2% | |
| FLIC Links: Profile News Message Board | |
| Charts:- Daily , Weekly | |
| Add FLIC to Watchlist: View: Get Complete FLIC Trend Analysis ➞ | |
 | PGC Peapack-Gladstone Financial Corporation |
| Sector: Financials | |
| SubSector: Regional - Northeast Banks | |
| MarketCap: 284.399 Millions | |
| Recent Price: 23.75 Smart Investing & Trading Score: 74 | |
| Day Percent Change: 0.30% Day Change: 0.07 | |
| Week Change: 3.04% Year-to-date Change: -20.4% | |
| PGC Links: Profile News Message Board | |
| Charts:- Daily , Weekly | |
| Add PGC to Watchlist: View: Get Complete PGC Trend Analysis ➞ | |
 | TMP Tompkins Financial Corporation |
| Sector: Financials | |
| SubSector: Regional - Northeast Banks | |
| MarketCap: 1144.79 Millions | |
| Recent Price: 47.92 Smart Investing & Trading Score: 87 | |
| Day Percent Change: 1.18% Day Change: 0.56 | |
| Week Change: 2.09% Year-to-date Change: -20.4% | |
| TMP Links: Profile News Message Board | |
| Charts:- Daily , Weekly | |
| Add TMP to Watchlist: View: Get Complete TMP Trend Analysis ➞ | |
 | EBTC Enterprise Bancorp, Inc. |
| Sector: Financials | |
| SubSector: Savings & Loans | |
| MarketCap: 304.53 Millions | |
| Recent Price: 25.66 Smart Investing & Trading Score: 67 | |
| Day Percent Change: 2.48% Day Change: 0.62 | |
| Week Change: 1.34% Year-to-date Change: -20.5% | |
| EBTC Links: Profile News Message Board | |
| Charts:- Daily , Weekly | |
| Add EBTC to Watchlist: View: Get Complete EBTC Trend Analysis ➞ | |
 | SMBC Southern Missouri Bancorp, Inc. |
| Sector: Financials | |
| SubSector: Savings & Loans | |
| MarketCap: 272.53 Millions | |
| Recent Price: 42.46 Smart Investing & Trading Score: 74 | |
| Day Percent Change: 1.10% Day Change: 0.46 | |
| Week Change: 0.86% Year-to-date Change: -20.5% | |
| SMBC Links: Profile News Message Board | |
| Charts:- Daily , Weekly | |
| Add SMBC to Watchlist: View: Get Complete SMBC Trend Analysis ➞ | |
| For tabular summary view of above stock list: Summary View ➞ 0 - 25 , 25 - 50 , 50 - 75 , 75 - 100 , 100 - 125 , 125 - 150 , 150 - 175 , 175 - 200 , 200 - 225 , 225 - 250 , 250 - 275 , 275 - 300 , 300 - 325 , 325 - 350 , 350 - 375 , 375 - 400 , 400 - 425 , 425 - 450 , 450 - 475 , 475 - 500 , 500 - 525 , 525 - 550 , 550 - 575 , 575 - 600 , 600 - 625 , 625 - 650 , 650 - 675 , 675 - 700 , 700 - 725 , 725 - 750 , 750 - 775 , 775 - 800 , 800 - 825 , 825 - 850 , 850 - 875 , 875 - 900 , 900 - 925 , 925 - 950 , 950 - 975 , 975 - 1000 , 1000 - 1025 , 1025 - 1050 , 1050 - 1075 , 1075 - 1100 , 1100 - 1125 , 1125 - 1150 , 1150 - 1175 , 1175 - 1200 , 1200 - 1225 | ||
| Click To Change The Sort Order: By Market Cap or Company Size Performance: Year-to-date, Week and Day | |
| Select Chart Type: | ||
|
Best Stocks Today 12Stocks.com |
© 2024 12Stocks.com Terms & Conditions Privacy Contact Us
All Information Provided Only For Education And Not To Be Used For Investing or Trading. See Terms & Conditions


One More Thing ... Get Best Stocks Delivered Daily!
Never Ever Miss A Move With Our Top Ten Stocks Lists
Find Best Stocks In Any Market - Bull or Bear Market
Take A Peek At Our Top Ten Stocks Lists: Daily, Weekly, Year-to-Date & Top Trends
Find Best Stocks In Any Market - Bull or Bear Market
Take A Peek At Our Top Ten Stocks Lists: Daily, Weekly, Year-to-Date & Top Trends
Financial Stocks With Best Up Trends [0-bearish to 100-bullish]: Bridge [100], MarketAxess [100], First Community[100], Banco Macro[100], Jones Lang[100], Northrim BanCorp[100], Stratus Properties[100], KKR [100], Metals Acquisition[100], Oppenheimer [100], Cushman & Wakefield[100]
Best Financial Stocks Year-to-Date:
Root [486.15%], Banco Macro[133.1%], SelectQuote [114.6%], Banco BBVA[113.79%], Grupo Financiero[113.38%], Gladstone Capital[108.5%], EverQuote [92.97%], Hippo [92.65%], Grupo Supervielle[90.15%], Yiren Digital[61.54%], Vista Oil[61.34%] Best Financial Stocks This Week:
Bridge [15.2%], Medical Properties[13.39%], Huize Holding[12.97%], SelectQuote [12.21%], Arbor Realty[12.06%], Cipher Mining[11.83%], C3.ai [11.3%], First Foundation[11.01%], Lemonade [10.74%], Upstart [10.67%], Siebert [10%] Best Financial Stocks Daily:
Douglas Elliman[15.18%], Cipher Mining[12.13%], Coinbase Global[8.30%], Iris Energy[6.78%], First Northwest[6.54%], Bridge [6.49%], MarketAxess [6.11%], First Community[6.11%], Banco Macro[5.94%], First Foundation[5.79%], LGI Homes[5.70%]