
 Login Sign Up


| |||||
 |  | ||||

| 12Stocks.com Market Intelligence |
Best Financial Stocks
| In a hurry? Financial Stocks Lists: Performance Trends Table, Stock Charts
Sort Financial stocks: Daily, Weekly, Year-to-Date, Market Cap & Trends. Filter Financial stocks list by size:All Financial Large Mid-Range Small & MicroCap |
| 12Stocks.com Financial Stocks Performances & Trends Daily | |||||||||
|
|  The overall Smart Investing & Trading Score is 58 (0-bearish to 100-bullish) which puts Financial sector in short term neutral trend. The Smart Investing & Trading Score from previous trading session is 63 and hence a deterioration of trend.
| ||||||||
Here are the Smart Investing & Trading Scores of the most requested Financial stocks at 12Stocks.com (click stock name for detailed review):
|


| 12Stocks.com: Investing in Financial sector with Stocks | |
|
The following table helps investors and traders sort through current performance and trends (as measured by Smart Investing & Trading Score) of various
stocks in the Financial sector. Quick View: Move mouse or cursor over stock symbol (ticker) to view short-term Technical chart and over stock name to view long term chart. Click on  to add stock symbol to your watchlist and to add stock symbol to your watchlist and  to view watchlist. Click on any ticker or stock name for detailed market intelligence report for that stock. to view watchlist. Click on any ticker or stock name for detailed market intelligence report for that stock. |
12Stocks.com Performance of Stocks in Financial Sector
| Ticker | Stock Name | Watchlist | Category | Recent Price | Smart Investing & Trading Score | Change % | YTD Change% |
| NRDS | NerdWallet |   | Credit Services | 12.65 | 10 | -1.94% | -15.33% |
| WD | Walker & Dunlop | | Mortgage | 93.94 | 67 | 0.78% | -15.38% |
| CIM | Chimera | | Mortgage | 4.22 | 69 | 0.72% | -15.43% |
| AUBN | Auburn National | | Regional Banks | 17.96 | 49 | 3.52% | -15.60% |
| BKU | BankUnited | | Regional Banks | 27.35 | 42 | 0.33% | -15.66% |
| BXMT | Blackstone Mortgage | | Mortgage | 17.91 | 20 | 0.00% | -15.80% |
| BSBK | Bogota | | Banks Regional | 6.77 | 48 | -1.88% | -15.80% |
| NBTB | NBT Bancorp | | Regional Banks | 35.27 | 68 | -1.95% | -15.84% |
| WABC | Westamerica Ban | | Regional Banks | 47.47 | 80 | 0.06% | -15.85% |
| SMBK | Smart | | Regional Banks | 20.60 | 67 | -0.29% | -15.88% |
| FAF | First American | | Insurance | 54.18 | 17 | -0.07% | -15.92% |
| CBU | Community Bank | | Regional Banks | 43.79 | 40 | -1.90% | -15.97% |
| NKSH | National Bankshares | | Regional Banks | 27.16 | 0 | 0.04% | -16.04% |
| FBNC | First Bancorp | | Regional Banks | 31.03 | 0 | -1.55% | -16.16% |
| CCNE | CNB | | Regional Banks | 18.94 | 10 | -0.68% | -16.16% |
| LBAI | Lakeland Bancorp | | Regional Banks | 12.39 | 42 | -1.04% | -16.23% |
| PUK | Prudential | | Life Insurance | 18.80 | 74 | 2.68% | -16.26% |
| WAFD | Washington Federal | | S&L | 27.58 | 42 | -1.18% | -16.32% |
| NREF | NexPoint Real | | REIT | 13.16 | 74 | -0.75% | -16.36% |
| NRIM | Northrim BanCorp | | Regional Banks | 47.80 | 57 | -2.49% | -16.45% |
| NAVI | Navient | | Credit Services | 15.55 | 0 | -1.08% | -16.49% |
| CBAN | Colony Bankcorp | | Regional Banks | 11.07 | 74 | 2.50% | -16.77% |
| TCI | Transcontinental Realty | | REIT - | 28.75 | 10 | -0.73% | -16.81% |
| BANR | Banner | | Regional Banks | 44.51 | 35 | -1.87% | -16.90% |
| PDLB | PDL Community | | REIT - Retail | 8.10 | 17 | -0.61% | -17.01% |
| For chart view version of above stock list: Chart View ➞ 0 - 25 , 25 - 50 , 50 - 75 , 75 - 100 , 100 - 125 , 125 - 150 , 150 - 175 , 175 - 200 , 200 - 225 , 225 - 250 , 250 - 275 , 275 - 300 , 300 - 325 , 325 - 350 , 350 - 375 , 375 - 400 , 400 - 425 , 425 - 450 , 450 - 475 , 475 - 500 , 500 - 525 , 525 - 550 , 550 - 575 , 575 - 600 , 600 - 625 , 625 - 650 , 650 - 675 , 675 - 700 , 700 - 725 , 725 - 750 , 750 - 775 , 775 - 800 , 800 - 825 , 825 - 850 , 850 - 875 , 875 - 900 , 900 - 925 , 925 - 950 , 950 - 975 , 975 - 1000 , 1000 - 1025 , 1025 - 1050 , 1050 - 1075 , 1075 - 1100 , 1100 - 1125 , 1125 - 1150 , 1150 - 1175 , 1175 - 1200 , 1200 - 1225 , 1225 - 1250 | ||
 | Click To Change The Sort Order: By Market Cap or Company Size Performance: Year-to-date, Week and Day |  |
|
Get the most comprehensive stock market coverage daily at 12Stocks.com ➞ Best Stocks Today ➞ Best Stocks Weekly ➞ Best Stocks Year-to-Date ➞ Best Stocks Trends ➞  Best Stocks Today 12Stocks.com Best Nasdaq Stocks ➞ Best S&P 500 Stocks ➞ Best Tech Stocks ➞ Best Biotech Stocks ➞ |
| Detailed Overview of Financial Stocks |
| Financial Technical Overview, Leaders & Laggards, Top Financial ETF Funds & Detailed Financial Stocks List, Charts, Trends & More |
| Financial Sector: Technical Analysis, Trends & YTD Performance | |
| Financial sector is composed of stocks
from banks, brokers, insurance, REITs
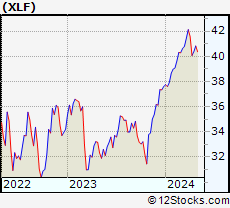
and services subsectors. Financial sector, as represented by XLF, an exchange-traded fund [ETF] that holds basket of Financial stocks (e.g, Bank of America, Goldman Sachs) is up by 8.4% and is currently outperforming the overall market by 1.84% year-to-date. Below is a quick view of Technical charts and trends: |
|
 XLF Weekly Chart |
|
| Long Term Trend: Very Good | |
| Medium Term Trend: Good | |
 XLF Daily Chart |
|
| Short Term Trend: Deteriorating | |
| Overall Trend Score: 58 | |
| YTD Performance: 8.4% | |
| **Trend Scores & Views Are Only For Educational Purposes And Not For Investing | |
| 12Stocks.com: Top Performing Financial Sector Stocks | ||||||||||||||||||||||||||||||||||||||||||||||||
 The top performing Financial sector stocks year to date are
Now, more recently, over last week, the top performing Financial sector stocks on the move are


|
||||||||||||||||||||||||||||||||||||||||||||||||
| 12Stocks.com: Investing in Financial Sector using Exchange Traded Funds | |
|
The following table shows list of key exchange traded funds (ETF) that
help investors track Financial Index. For detailed view, check out our ETF Funds section of our website. Quick View: Move mouse or cursor over ETF symbol (ticker) to view short-term Technical chart and over ETF name to view long term chart. Click on ticker or stock name for detailed view. Click on to add stock symbol to your watchlist and to view watchlist. |
12Stocks.com List of ETFs that track Financial Index
| Ticker | ETF Name | Watchlist | Recent Price | Smart Investing & Trading Score | Change % | Week % | Year-to-date % |
| XLF | Financial | | 40.76 | 58 | -0.15 | -0.15 | 8.4% |
| IAI | Broker-Dealers & Secs | | 112.90 | 75 | -0.10 | -0.1 | 4.03% |
| IYF | Financials | | 92.16 | 76 | -0.01 | -0.01 | 7.9% |
| IYG | Financial Services | | 64.34 | 76 | -0.42 | -0.42 | 7.71% |
| KRE | Regional Banking | | 47.77 | 47 | -0.87 | -0.87 | -8.89% |
| IXG | Global Financials | | 84.35 | 83 | 0.19 | 0.19 | 7.34% |
| VFH | Financials | | 98.74 | 76 | -0.19 | -0.19 | 7.02% |
| KBE | Bank | | 45.10 | 55 | -0.51 | -0.51 | -2% |
| FAS | Financial Bull 3X | | 100.33 | 58 | -0.30 | -0.3 | 21.39% |
| FAZ | Financial Bear 3X | | 10.93 | 42 | 0.64 | 0.64 | -20.04% |
| UYG | Financials | | 63.42 | 53 | -0.36 | -0.36 | 14.89% |
| IAT | Regional Banks | | 41.57 | 73 | -0.36 | -0.36 | -0.65% |
| KIE | Insurance | | 48.79 | 58 | 0.54 | 0.54 | 7.89% |
| PSCF | SmallCap Financials | | 46.33 | 47 | -0.06 | -0.06 | -5.79% |
| EUFN | Europe Financials | | 22.50 | 83 | 0.18 | 0.18 | 7.35% |
| PGF | Financial Preferred | | 14.64 | 39 | 0.48 | 0.48 | 0.41% |
| 12Stocks.com: Charts, Trends, Fundamental Data and Performances of Financial Stocks | |
|
We now take in-depth look at all Financial stocks including charts, multi-period performances and overall trends (as measured by Smart Investing & Trading Score). One can sort Financial stocks (click link to choose) by Daily, Weekly and by Year-to-Date performances. Also, one can sort by size of the company or by market capitalization. |
| Select Your Default Chart Type: | |||||
| |||||
| Click on stock symbol or name for detailed view. Click on to add stock symbol to your watchlist and to view watchlist. Quick View: Move mouse or cursor over "Daily" to quickly view daily Technical stock chart and over "Weekly" to view weekly Technical stock chart. | |||||

 | NRDS NerdWallet, Inc. |
| Sector: Financials | |
| SubSector: Credit Services | |
| MarketCap: 759 Millions | |
| Recent Price: 12.65 Smart Investing & Trading Score: 10 | |
| Day Percent Change: -1.94% Day Change: -0.25 | |
| Week Change: -1.94% Year-to-date Change: -15.3% | |
| NRDS Links: Profile News Message Board | |
| Charts:- Daily , Weekly | |
| Add NRDS to Watchlist: View: Get Complete NRDS Trend Analysis ➞ | |
 | WD Walker & Dunlop, Inc. |
| Sector: Financials | |
| SubSector: Mortgage Investment | |
| MarketCap: 1312.99 Millions | |
| Recent Price: 93.94 Smart Investing & Trading Score: 67 | |
| Day Percent Change: 0.78% Day Change: 0.73 | |
| Week Change: 0.78% Year-to-date Change: -15.4% | |
| WD Links: Profile News Message Board | |
| Charts:- Daily , Weekly | |
| Add WD to Watchlist: View: Get Complete WD Trend Analysis ➞ | |
 | CIM Chimera Investment Corporation |
| Sector: Financials | |
| SubSector: Mortgage Investment | |
| MarketCap: 2164.09 Millions | |
| Recent Price: 4.22 Smart Investing & Trading Score: 69 | |
| Day Percent Change: 0.72% Day Change: 0.03 | |
| Week Change: 0.72% Year-to-date Change: -15.4% | |
| CIM Links: Profile News Message Board | |
| Charts:- Daily , Weekly | |
| Add CIM to Watchlist: View: Get Complete CIM Trend Analysis ➞ | |
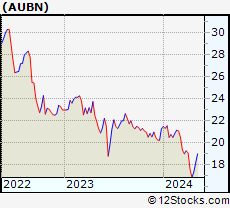 | AUBN Auburn National Bancorporation, Inc. |
| Sector: Financials | |
| SubSector: Regional - Southeast Banks | |
| MarketCap: 121.035 Millions | |
| Recent Price: 17.96 Smart Investing & Trading Score: 49 | |
| Day Percent Change: 3.52% Day Change: 0.61 | |
| Week Change: 3.52% Year-to-date Change: -15.6% | |
| AUBN Links: Profile News Message Board | |
| Charts:- Daily , Weekly | |
| Add AUBN to Watchlist: View: Get Complete AUBN Trend Analysis ➞ | |
 | BKU BankUnited, Inc. |
| Sector: Financials | |
| SubSector: Regional - Mid-Atlantic Banks | |
| MarketCap: 1905.99 Millions | |
| Recent Price: 27.35 Smart Investing & Trading Score: 42 | |
| Day Percent Change: 0.33% Day Change: 0.09 | |
| Week Change: 0.33% Year-to-date Change: -15.7% | |
| BKU Links: Profile News Message Board | |
| Charts:- Daily , Weekly | |
| Add BKU to Watchlist: View: Get Complete BKU Trend Analysis ➞ | |
 | BXMT Blackstone Mortgage Trust, Inc. |
| Sector: Financials | |
| SubSector: Mortgage Investment | |
| MarketCap: 2820.69 Millions | |
| Recent Price: 17.91 Smart Investing & Trading Score: 20 | |
| Day Percent Change: 0.00% Day Change: 0.00 | |
| Week Change: 0% Year-to-date Change: -15.8% | |
| BXMT Links: Profile News Message Board | |
| Charts:- Daily , Weekly | |
| Add BXMT to Watchlist: View: Get Complete BXMT Trend Analysis ➞ | |
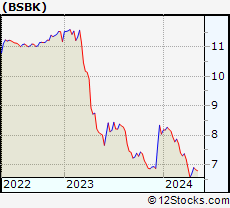 | BSBK Bogota Financial Corp. |
| Sector: Financials | |
| SubSector: Banks Regional | |
| MarketCap: 12157 Millions | |
| Recent Price: 6.77 Smart Investing & Trading Score: 48 | |
| Day Percent Change: -1.88% Day Change: -0.13 | |
| Week Change: -1.88% Year-to-date Change: -15.8% | |
| BSBK Links: Profile News Message Board | |
| Charts:- Daily , Weekly | |
| Add BSBK to Watchlist: View: Get Complete BSBK Trend Analysis ➞ | |
 | NBTB NBT Bancorp Inc. |
| Sector: Financials | |
| SubSector: Regional - Northeast Banks | |
| MarketCap: 1451.89 Millions | |
| Recent Price: 35.27 Smart Investing & Trading Score: 68 | |
| Day Percent Change: -1.95% Day Change: -0.70 | |
| Week Change: -1.95% Year-to-date Change: -15.8% | |
| NBTB Links: Profile News Message Board | |
| Charts:- Daily , Weekly | |
| Add NBTB to Watchlist: View: Get Complete NBTB Trend Analysis ➞ | |
 | WABC Westamerica Bancorporation |
| Sector: Financials | |
| SubSector: Regional - Pacific Banks | |
| MarketCap: 1557.69 Millions | |
| Recent Price: 47.47 Smart Investing & Trading Score: 80 | |
| Day Percent Change: 0.06% Day Change: 0.03 | |
| Week Change: 0.06% Year-to-date Change: -15.9% | |
| WABC Links: Profile News Message Board | |
| Charts:- Daily , Weekly | |
| Add WABC to Watchlist: View: Get Complete WABC Trend Analysis ➞ | |
 | SMBK SmartFinancial, Inc. |
| Sector: Financials | |
| SubSector: Regional - Southeast Banks | |
| MarketCap: 174.035 Millions | |
| Recent Price: 20.60 Smart Investing & Trading Score: 67 | |
| Day Percent Change: -0.29% Day Change: -0.06 | |
| Week Change: -0.29% Year-to-date Change: -15.9% | |
| SMBK Links: Profile News Message Board | |
| Charts:- Daily , Weekly | |
| Add SMBK to Watchlist: View: Get Complete SMBK Trend Analysis ➞ | |
 | FAF First American Financial Corporation |
| Sector: Financials | |
| SubSector: Property & Casualty Insurance | |
| MarketCap: 4163.82 Millions | |
| Recent Price: 54.18 Smart Investing & Trading Score: 17 | |
| Day Percent Change: -0.07% Day Change: -0.04 | |
| Week Change: -0.07% Year-to-date Change: -15.9% | |
| FAF Links: Profile News Message Board | |
| Charts:- Daily , Weekly | |
| Add FAF to Watchlist: View: Get Complete FAF Trend Analysis ➞ | |
 | CBU Community Bank System, Inc. |
| Sector: Financials | |
| SubSector: Regional - Midwest Banks | |
| MarketCap: 2787.8 Millions | |
| Recent Price: 43.79 Smart Investing & Trading Score: 40 | |
| Day Percent Change: -1.90% Day Change: -0.85 | |
| Week Change: -1.9% Year-to-date Change: -16.0% | |
| CBU Links: Profile News Message Board | |
| Charts:- Daily , Weekly | |
| Add CBU to Watchlist: View: Get Complete CBU Trend Analysis ➞ | |
 | NKSH National Bankshares, Inc. |
| Sector: Financials | |
| SubSector: Regional - Mid-Atlantic Banks | |
| MarketCap: 209.759 Millions | |
| Recent Price: 27.16 Smart Investing & Trading Score: 0 | |
| Day Percent Change: 0.04% Day Change: 0.01 | |
| Week Change: 0.04% Year-to-date Change: -16.0% | |
| NKSH Links: Profile News Message Board | |
| Charts:- Daily , Weekly | |
| Add NKSH to Watchlist: View: Get Complete NKSH Trend Analysis ➞ | |
 | FBNC First Bancorp |
| Sector: Financials | |
| SubSector: Regional - Mid-Atlantic Banks | |
| MarketCap: 664.959 Millions | |
| Recent Price: 31.03 Smart Investing & Trading Score: 0 | |
| Day Percent Change: -1.55% Day Change: -0.49 | |
| Week Change: -1.55% Year-to-date Change: -16.2% | |
| FBNC Links: Profile News Message Board | |
| Charts:- Daily , Weekly | |
| Add FBNC to Watchlist: View: Get Complete FBNC Trend Analysis ➞ | |
 | CCNE CNB Financial Corporation |
| Sector: Financials | |
| SubSector: Regional - Northeast Banks | |
| MarketCap: 286.599 Millions | |
| Recent Price: 18.94 Smart Investing & Trading Score: 10 | |
| Day Percent Change: -0.68% Day Change: -0.13 | |
| Week Change: -0.68% Year-to-date Change: -16.2% | |
| CCNE Links: Profile News Message Board | |
| Charts:- Daily , Weekly | |
| Add CCNE to Watchlist: View: Get Complete CCNE Trend Analysis ➞ | |
 | LBAI Lakeland Bancorp, Inc. |
| Sector: Financials | |
| SubSector: Regional - Northeast Banks | |
| MarketCap: 534.599 Millions | |
| Recent Price: 12.39 Smart Investing & Trading Score: 42 | |
| Day Percent Change: -1.04% Day Change: -0.13 | |
| Week Change: -1.04% Year-to-date Change: -16.2% | |
| LBAI Links: Profile News Message Board | |
| Charts:- Daily , Weekly | |
| Add LBAI to Watchlist: View: Get Complete LBAI Trend Analysis ➞ | |
 | PUK Prudential plc |
| Sector: Financials | |
| SubSector: Life Insurance | |
| MarketCap: 28247.4 Millions | |
| Recent Price: 18.80 Smart Investing & Trading Score: 74 | |
| Day Percent Change: 2.68% Day Change: 0.49 | |
| Week Change: 2.68% Year-to-date Change: -16.3% | |
| PUK Links: Profile News Message Board | |
| Charts:- Daily , Weekly | |
| Add PUK to Watchlist: View: Get Complete PUK Trend Analysis ➞ | |
 | WAFD Washington Federal, Inc. |
| Sector: Financials | |
| SubSector: Savings & Loans | |
| MarketCap: 2219.2 Millions | |
| Recent Price: 27.58 Smart Investing & Trading Score: 42 | |
| Day Percent Change: -1.18% Day Change: -0.33 | |
| Week Change: -1.18% Year-to-date Change: -16.3% | |
| WAFD Links: Profile News Message Board | |
| Charts:- Daily , Weekly | |
| Add WAFD to Watchlist: View: Get Complete WAFD Trend Analysis ➞ | |
 | NREF NexPoint Real Estate Finance, Inc. |
| Sector: Financials | |
| SubSector: REIT Diversified | |
| MarketCap: 97267 Millions | |
| Recent Price: 13.16 Smart Investing & Trading Score: 74 | |
| Day Percent Change: -0.75% Day Change: -0.10 | |
| Week Change: -0.75% Year-to-date Change: -16.4% | |
| NREF Links: Profile News Message Board | |
| Charts:- Daily , Weekly | |
| Add NREF to Watchlist: View: Get Complete NREF Trend Analysis ➞ | |
 | NRIM Northrim BanCorp, Inc. |
| Sector: Financials | |
| SubSector: Regional - Pacific Banks | |
| MarketCap: 147.629 Millions | |
| Recent Price: 47.80 Smart Investing & Trading Score: 57 | |
| Day Percent Change: -2.49% Day Change: -1.22 | |
| Week Change: -2.49% Year-to-date Change: -16.5% | |
| NRIM Links: Profile News Message Board | |
| Charts:- Daily , Weekly | |
| Add NRIM to Watchlist: View: Get Complete NRIM Trend Analysis ➞ | |
 | NAVI Navient Corporation |
| Sector: Financials | |
| SubSector: Credit Services | |
| MarketCap: 1362.48 Millions | |
| Recent Price: 15.55 Smart Investing & Trading Score: 0 | |
| Day Percent Change: -1.08% Day Change: -0.17 | |
| Week Change: -1.08% Year-to-date Change: -16.5% | |
| NAVI Links: Profile News Message Board | |
| Charts:- Daily , Weekly | |
| Add NAVI to Watchlist: View: Get Complete NAVI Trend Analysis ➞ | |
 | CBAN Colony Bankcorp, Inc. |
| Sector: Financials | |
| SubSector: Regional - Mid-Atlantic Banks | |
| MarketCap: 115.559 Millions | |
| Recent Price: 11.07 Smart Investing & Trading Score: 74 | |
| Day Percent Change: 2.50% Day Change: 0.27 | |
| Week Change: 2.5% Year-to-date Change: -16.8% | |
| CBAN Links: Profile News Message Board | |
| Charts:- Daily , Weekly | |
| Add CBAN to Watchlist: View: Get Complete CBAN Trend Analysis ➞ | |
 | TCI Transcontinental Realty Investors, Inc. |
| Sector: Financials | |
| SubSector: REIT - Diversified | |
| MarketCap: 158.653 Millions | |
| Recent Price: 28.75 Smart Investing & Trading Score: 10 | |
| Day Percent Change: -0.73% Day Change: -0.21 | |
| Week Change: -0.73% Year-to-date Change: -16.8% | |
| TCI Links: Profile News Message Board | |
| Charts:- Daily , Weekly | |
| Add TCI to Watchlist: View: Get Complete TCI Trend Analysis ➞ | |
 | BANR Banner Corporation |
| Sector: Financials | |
| SubSector: Regional - Mid-Atlantic Banks | |
| MarketCap: 1187.09 Millions | |
| Recent Price: 44.51 Smart Investing & Trading Score: 35 | |
| Day Percent Change: -1.87% Day Change: -0.85 | |
| Week Change: -1.87% Year-to-date Change: -16.9% | |
| BANR Links: Profile News Message Board | |
| Charts:- Daily , Weekly | |
| Add BANR to Watchlist: View: Get Complete BANR Trend Analysis ➞ | |
 | PDLB PDL Community Bancorp |
| Sector: Financials | |
| SubSector: REIT - Retail | |
| MarketCap: 206.114 Millions | |
| Recent Price: 8.10 Smart Investing & Trading Score: 17 | |
| Day Percent Change: -0.61% Day Change: -0.05 | |
| Week Change: -0.61% Year-to-date Change: -17.0% | |
| PDLB Links: Profile News Message Board | |
| Charts:- Daily , Weekly | |
| Add PDLB to Watchlist: View: Get Complete PDLB Trend Analysis ➞ | |
| For tabular summary view of above stock list: Summary View ➞ 0 - 25 , 25 - 50 , 50 - 75 , 75 - 100 , 100 - 125 , 125 - 150 , 150 - 175 , 175 - 200 , 200 - 225 , 225 - 250 , 250 - 275 , 275 - 300 , 300 - 325 , 325 - 350 , 350 - 375 , 375 - 400 , 400 - 425 , 425 - 450 , 450 - 475 , 475 - 500 , 500 - 525 , 525 - 550 , 550 - 575 , 575 - 600 , 600 - 625 , 625 - 650 , 650 - 675 , 675 - 700 , 700 - 725 , 725 - 750 , 750 - 775 , 775 - 800 , 800 - 825 , 825 - 850 , 850 - 875 , 875 - 900 , 900 - 925 , 925 - 950 , 950 - 975 , 975 - 1000 , 1000 - 1025 , 1025 - 1050 , 1050 - 1075 , 1075 - 1100 , 1100 - 1125 , 1125 - 1150 , 1150 - 1175 , 1175 - 1200 , 1200 - 1225 , 1225 - 1250 | ||
| Click To Change The Sort Order: By Market Cap or Company Size Performance: Year-to-date, Week and Day | |
| Select Chart Type: | ||
|
Best Stocks Today 12Stocks.com |
© 2024 12Stocks.com Terms & Conditions Privacy Contact Us
All Information Provided Only For Education And Not To Be Used For Investing or Trading. See Terms & Conditions


One More Thing ... Get Best Stocks Delivered Daily!
Never Ever Miss A Move With Our Top Ten Stocks Lists
Find Best Stocks In Any Market - Bull or Bear Market
Take A Peek At Our Top Ten Stocks Lists: Daily, Weekly, Year-to-Date & Top Trends
Find Best Stocks In Any Market - Bull or Bear Market
Take A Peek At Our Top Ten Stocks Lists: Daily, Weekly, Year-to-Date & Top Trends
Financial Stocks With Best Up Trends [0-bearish to 100-bullish]: Heartland [100], Fulton [100], B. Riley[100], ICICI Bank[100], Piedmont Office[100], Douglas Emmett[100], BrasilAgro -[100], LPL [100], Highwoods Properties[100], Stifel [100], iShares ESG[100]
Best Financial Stocks Year-to-Date:
Root [538.11%], Hippo [140.94%], Gladstone Capital[102.15%], Banco Macro[85.19%], B. Riley[83.66%], Grupo Financiero[81.06%], Banco BBVA[72.43%], Yiren Digital[60.9%], EverQuote [59.97%], Fidelis Insurance[58.53%], Heritage Insurance[57.52%] Best Financial Stocks This Week:
Heartland [15.15%], AltC Acquisition[12.57%], Douglas Elliman[10.92%], Fulton [7.55%], NexGen Energy[6.16%], Medical Properties[5.99%], Clipper Realty[5.54%], AlTi Global[4.85%], Citizens [4.81%], B. Riley[4.7%], Peakstone Realty[4.03%] Best Financial Stocks Daily:
Heartland [15.15%], AltC Acquisition[12.57%], Douglas Elliman[10.92%], Fulton [7.55%], NexGen Energy[6.16%], Medical Properties[5.99%], Clipper Realty[5.54%], AlTi Global[4.85%], Citizens [4.81%], B. Riley[4.70%], Peakstone Realty[4.03%]