
 Login Sign Up


| |||||
 |  | ||||

| 12Stocks.com Market Intelligence |
Best Financial Stocks
| In a hurry? Financial Stocks Lists: Performance Trends Table, Stock Charts
Sort Financial stocks: Daily, Weekly, Year-to-Date, Market Cap & Trends. Filter Financial stocks list by size:All Financial Large Mid-Range Small & MicroCap |
| 12Stocks.com Financial Stocks Performances & Trends Daily | |||||||||
|
|  The overall Smart Investing & Trading Score is 95 (0-bearish to 100-bullish) which puts Financial sector in short term bullish trend. The Smart Investing & Trading Score from previous trading session is 85 and hence an improvement of trend.
| ||||||||
Here are the Smart Investing & Trading Scores of the most requested Financial stocks at 12Stocks.com (click stock name for detailed review):
|


| 12Stocks.com: Investing in Financial sector with Stocks | |
|
The following table helps investors and traders sort through current performance and trends (as measured by Smart Investing & Trading Score) of various
stocks in the Financial sector. Quick View: Move mouse or cursor over stock symbol (ticker) to view short-term Technical chart and over stock name to view long term chart. Click on  to add stock symbol to your watchlist and to add stock symbol to your watchlist and  to view watchlist. Click on any ticker or stock name for detailed market intelligence report for that stock. to view watchlist. Click on any ticker or stock name for detailed market intelligence report for that stock. |
12Stocks.com Performance of Stocks in Financial Sector
| Ticker | Stock Name | Watchlist | Category | Recent Price | Smart Investing & Trading Score | Change % | YTD Change% |
| KYN | Kayne Anderson |   | Closed-End Fund - Equity | 9.77 | 83 | 1.98% | 11.28% |
| CTRE | CareTrust REIT | | REIT | 24.88 | 58 | 0.04% | 11.17% |
| WRB | W. R. | | Insurance | 78.55 | 32 | -0.20% | 11.07% |
| ETY | Eaton Vance | | Closed-End Fund - Equity | 13.53 | 100 | 0.52% | 10.99% |
| KSM | DWS Strategic | | Closed-End Fund - Debt | 9.60 | 90 | 0.31% | 10.98% |
| HSBC | HSBC | | Foreign Banks | 44.98 | 95 | 0.45% | 10.95% |
| LYG | Lloyds Banking | | Foreign Banks | 2.65 | 90 | 0.76% | 10.88% |
| SKWD | Skyward Specialty | | Insurance - Property & Casualty | 37.61 | 90 | 0.17% | 10.78% |
| AIRC | Apartment ome | | REIT | 38.65 | 80 | 0.16% | 10.73% |
| FHN | First Horizon | | Regional Banks | 15.67 | 68 | -0.19% | 10.66% |
| CIB | Bancolombia S.A | | Foreign Banks | 34.03 | 85 | -0.70% | 10.59% |
| EOS | Eaton Vance | | Closed-End Fund - Equity | 20.70 | 100 | 0.88% | 10.58% |
| LAMR | Lamar Advertising | | REIT - | 117.51 | 80 | 0.68% | 10.57% |
| BANC | Banc of California | | Regional Banks | 14.84 | 100 | 0.34% | 10.50% |
| SIXA | 6 Meridian | | Exchange Traded Fund | 40.58 | 85 | 0.53% | 10.50% |
| RLI | RLI | | Insurance | 146.98 | 87 | 0.44% | 10.41% |
| AESR | Anfield U.S. | | Exchange Traded Fund | 15.27 | 95 | 0.26% | 10.41% |
| THQ | Tekla Healthcare | | Closed-End Fund - Equity | 19.99 | 95 | 0.20% | 10.38% |
| DEMZ | Demz Political | | Exchange Traded Fund | 32.53 | 77 | 1.24% | 10.38% |
| VIRT | Virtu | | Brokerage | 22.36 | 78 | -1.80% | 10.37% |
| RDN | Radian | | Insurance | 31.50 | 95 | 0.61% | 10.33% |
| GDXU | MicroSectors Gold | | Exchange Traded Fund | 36.84 | 68 | -1.55% | 10.33% |
| BGX | Blackstone / | | Closed-End Fund - Debt | 12.63 | 100 | 2.02% | 10.31% |
| BK | Bank of New York | | Asset Mgmt | 57.40 | 95 | -0.14% | 10.28% |
| FITB | Fifth Third | | Regional Banks | 38.03 | 95 | 0.08% | 10.26% |
| For chart view version of above stock list: Chart View ➞ 0 - 25 , 25 - 50 , 50 - 75 , 75 - 100 , 100 - 125 , 125 - 150 , 150 - 175 , 175 - 200 , 200 - 225 , 225 - 250 , 250 - 275 , 275 - 300 , 300 - 325 , 325 - 350 , 350 - 375 , 375 - 400 , 400 - 425 , 425 - 450 , 450 - 475 , 475 - 500 , 500 - 525 , 525 - 550 , 550 - 575 , 575 - 600 , 600 - 625 , 625 - 650 , 650 - 675 , 675 - 700 , 700 - 725 , 725 - 750 , 750 - 775 , 775 - 800 , 800 - 825 , 825 - 850 , 850 - 875 , 875 - 900 , 900 - 925 , 925 - 950 , 950 - 975 , 975 - 1000 , 1000 - 1025 , 1025 - 1050 , 1050 - 1075 , 1075 - 1100 , 1100 - 1125 , 1125 - 1150 , 1150 - 1175 , 1175 - 1200 , 1200 - 1225 | ||
 | Click To Change The Sort Order: By Market Cap or Company Size Performance: Year-to-date, Week and Day |  |
|
Get the most comprehensive stock market coverage daily at 12Stocks.com ➞ Best Stocks Today ➞ Best Stocks Weekly ➞ Best Stocks Year-to-Date ➞ Best Stocks Trends ➞  Best Stocks Today 12Stocks.com Best Nasdaq Stocks ➞ Best S&P 500 Stocks ➞ Best Tech Stocks ➞ Best Biotech Stocks ➞ |
| Detailed Overview of Financial Stocks |
| Financial Technical Overview, Leaders & Laggards, Top Financial ETF Funds & Detailed Financial Stocks List, Charts, Trends & More |
| Financial Sector: Technical Analysis, Trends & YTD Performance | |
| Financial sector is composed of stocks
from banks, brokers, insurance, REITs
and services subsectors. Financial sector, as represented by XLF, an exchange-traded fund [ETF] that holds basket of Financial stocks (e.g, Bank of America, Goldman Sachs) is up by 9.6% and is currently outperforming the overall market by 1.48% year-to-date. Below is a quick view of Technical charts and trends: |
|
 XLF Weekly Chart |
|
| Long Term Trend: Good | |
| Medium Term Trend: Good | |
 XLF Daily Chart |
|
| Short Term Trend: Very Good | |
| Overall Trend Score: 95 | |
| YTD Performance: 9.6% | |
| **Trend Scores & Views Are Only For Educational Purposes And Not For Investing | |
| 12Stocks.com: Top Performing Financial Sector Stocks | ||||||||||||||||||||||||||||||||||||||||||||||||
 The top performing Financial sector stocks year to date are
Now, more recently, over last week, the top performing Financial sector stocks on the move are


|
||||||||||||||||||||||||||||||||||||||||||||||||
| 12Stocks.com: Investing in Financial Sector using Exchange Traded Funds | |
|
The following table shows list of key exchange traded funds (ETF) that
help investors track Financial Index. For detailed view, check out our ETF Funds section of our website. Quick View: Move mouse or cursor over ETF symbol (ticker) to view short-term Technical chart and over ETF name to view long term chart. Click on ticker or stock name for detailed view. Click on to add stock symbol to your watchlist and to view watchlist. |
12Stocks.com List of ETFs that track Financial Index
| Ticker | ETF Name | Watchlist | Recent Price | Smart Investing & Trading Score | Change % | Week % | Year-to-date % |
| XLF | Financial | | 41.21 | 95 | 0.34 | 1.63 | 9.6% |
| IAI | Broker-Dealers & Secs | | 115.55 | 100 | -0.16 | 1.12 | 6.47% |
| IYF | Financials | | 93.74 | 90 | 0.14 | 1.37 | 9.75% |
| IYG | Financial Services | | 65.00 | 95 | 0.26 | 1.42 | 8.81% |
| KRE | Regional Banking | | 49.88 | 100 | -0.32 | 0.46 | -4.86% |
| IXG | Global Financials | | 86.14 | 95 | 0.81 | 1.53 | 9.62% |
| VFH | Financials | | 100.09 | 95 | 0.24 | 1.41 | 8.49% |
| KBE | Bank | | 46.82 | 100 | -0.15 | 0.93 | 1.74% |
| FAS | Financial Bull 3X | | 103.26 | 95 | 1.02 | 4.48 | 24.94% |
| FAZ | Financial Bear 3X | | 10.61 | 5 | -0.93 | -4.24 | -22.38% |
| UYG | Financials | | 64.72 | 95 | 0.72 | 3.07 | 17.25% |
| IAT | Regional Banks | | 42.49 | 100 | -0.42 | 0.47 | 1.55% |
| KIE | Insurance | | 50.71 | 95 | 0.66 | 2.49 | 12.14% |
| PSCF | SmallCap Financials | | 47.63 | 100 | 0.01 | 0.73 | -3.16% |
| EUFN | Europe Financials | | 23.25 | 100 | 1.13 | 2.67 | 10.93% |
| PGF | Financial Preferred | | 14.81 | 62 | -0.34 | -0.27 | 1.58% |
| 12Stocks.com: Charts, Trends, Fundamental Data and Performances of Financial Stocks | |
|
We now take in-depth look at all Financial stocks including charts, multi-period performances and overall trends (as measured by Smart Investing & Trading Score). One can sort Financial stocks (click link to choose) by Daily, Weekly and by Year-to-Date performances. Also, one can sort by size of the company or by market capitalization. |
| Select Your Default Chart Type: | |||||
| |||||
| Click on stock symbol or name for detailed view. Click on to add stock symbol to your watchlist and to view watchlist. Quick View: Move mouse or cursor over "Daily" to quickly view daily Technical stock chart and over "Weekly" to view weekly Technical stock chart. | |||||

 | KYN Kayne Anderson MLP/Midstream Investment Company |
| Sector: Financials | |
| SubSector: Closed-End Fund - Equity | |
| MarketCap: 440.947 Millions | |
| Recent Price: 9.77 Smart Investing & Trading Score: 83 | |
| Day Percent Change: 1.98% Day Change: 0.19 | |
| Week Change: 2.3% Year-to-date Change: 11.3% | |
| KYN Links: Profile News Message Board | |
| Charts:- Daily , Weekly | |
| Add KYN to Watchlist: View: Get Complete KYN Trend Analysis ➞ | |
 | CTRE CareTrust REIT, Inc. |
| Sector: Financials | |
| SubSector: REIT - Healthcare Facilities | |
| MarketCap: 1507.94 Millions | |
| Recent Price: 24.88 Smart Investing & Trading Score: 58 | |
| Day Percent Change: 0.04% Day Change: 0.01 | |
| Week Change: -0.36% Year-to-date Change: 11.2% | |
| CTRE Links: Profile News Message Board | |
| Charts:- Daily , Weekly | |
| Add CTRE to Watchlist: View: Get Complete CTRE Trend Analysis ➞ | |
 | WRB W. R. Berkley Corporation |
| Sector: Financials | |
| SubSector: Property & Casualty Insurance | |
| MarketCap: 9863.82 Millions | |
| Recent Price: 78.55 Smart Investing & Trading Score: 32 | |
| Day Percent Change: -0.20% Day Change: -0.16 | |
| Week Change: -0.01% Year-to-date Change: 11.1% | |
| WRB Links: Profile News Message Board | |
| Charts:- Daily , Weekly | |
| Add WRB to Watchlist: View: Get Complete WRB Trend Analysis ➞ | |
 | ETY Eaton Vance Tax-Managed Diversified Equity Income Fund |
| Sector: Financials | |
| SubSector: Closed-End Fund - Equity | |
| MarketCap: 1228.97 Millions | |
| Recent Price: 13.53 Smart Investing & Trading Score: 100 | |
| Day Percent Change: 0.52% Day Change: 0.07 | |
| Week Change: 0.97% Year-to-date Change: 11.0% | |
| ETY Links: Profile News Message Board | |
| Charts:- Daily , Weekly | |
| Add ETY to Watchlist: View: Get Complete ETY Trend Analysis ➞ | |
 | KSM DWS Strategic Municipal Income Trust |
| Sector: Financials | |
| SubSector: Closed-End Fund - Debt | |
| MarketCap: 103.607 Millions | |
| Recent Price: 9.60 Smart Investing & Trading Score: 90 | |
| Day Percent Change: 0.31% Day Change: 0.03 | |
| Week Change: 0.84% Year-to-date Change: 11.0% | |
| KSM Links: Profile News Message Board | |
| Charts:- Daily , Weekly | |
| Add KSM to Watchlist: View: Get Complete KSM Trend Analysis ➞ | |
 | HSBC HSBC Holdings plc |
| Sector: Financials | |
| SubSector: Foreign Money Center Banks | |
| MarketCap: 127701 Millions | |
| Recent Price: 44.98 Smart Investing & Trading Score: 95 | |
| Day Percent Change: 0.45% Day Change: 0.20 | |
| Week Change: 1.19% Year-to-date Change: 11.0% | |
| HSBC Links: Profile News Message Board | |
| Charts:- Daily , Weekly | |
| Add HSBC to Watchlist: View: Get Complete HSBC Trend Analysis ➞ | |
 | LYG Lloyds Banking Group plc |
| Sector: Financials | |
| SubSector: Foreign Money Center Banks | |
| MarketCap: 28885.4 Millions | |
| Recent Price: 2.65 Smart Investing & Trading Score: 90 | |
| Day Percent Change: 0.76% Day Change: 0.02 | |
| Week Change: 1.92% Year-to-date Change: 10.9% | |
| LYG Links: Profile News Message Board | |
| Charts:- Daily , Weekly | |
| Add LYG to Watchlist: View: Get Complete LYG Trend Analysis ➞ | |
 | SKWD Skyward Specialty Insurance Group, Inc. |
| Sector: Financials | |
| SubSector: Insurance - Property & Casualty | |
| MarketCap: 936 Millions | |
| Recent Price: 37.61 Smart Investing & Trading Score: 90 | |
| Day Percent Change: 0.17% Day Change: 0.06 | |
| Week Change: 2.69% Year-to-date Change: 10.8% | |
| SKWD Links: Profile News Message Board | |
| Charts:- Daily , Weekly | |
| Add SKWD to Watchlist: View: Get Complete SKWD Trend Analysis ➞ | |
 | AIRC Apartment Income REIT Corp. |
| Sector: Financials | |
| SubSector: REIT - Residential | |
| MarketCap: 5280 Millions | |
| Recent Price: 38.65 Smart Investing & Trading Score: 80 | |
| Day Percent Change: 0.16% Day Change: 0.06 | |
| Week Change: 0.25% Year-to-date Change: 10.7% | |
| AIRC Links: Profile News Message Board | |
| Charts:- Daily , Weekly | |
| Add AIRC to Watchlist: View: Get Complete AIRC Trend Analysis ➞ | |
 | FHN First Horizon National Corporation |
| Sector: Financials | |
| SubSector: Regional - Southeast Banks | |
| MarketCap: 2661.05 Millions | |
| Recent Price: 15.67 Smart Investing & Trading Score: 68 | |
| Day Percent Change: -0.19% Day Change: -0.03 | |
| Week Change: -0.82% Year-to-date Change: 10.7% | |
| FHN Links: Profile News Message Board | |
| Charts:- Daily , Weekly | |
| Add FHN to Watchlist: View: Get Complete FHN Trend Analysis ➞ | |
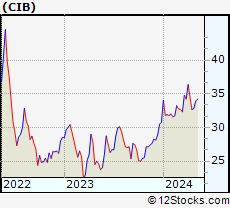 | CIB Bancolombia S.A. |
| Sector: Financials | |
| SubSector: Foreign Regional Banks | |
| MarketCap: 5031.99 Millions | |
| Recent Price: 34.03 Smart Investing & Trading Score: 85 | |
| Day Percent Change: -0.70% Day Change: -0.24 | |
| Week Change: 0.29% Year-to-date Change: 10.6% | |
| CIB Links: Profile News Message Board | |
| Charts:- Daily , Weekly | |
| Add CIB to Watchlist: View: Get Complete CIB Trend Analysis ➞ | |
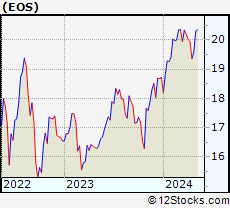 | EOS Eaton Vance Enhanced Equity Income Fund II |
| Sector: Financials | |
| SubSector: Closed-End Fund - Equity | |
| MarketCap: 595.947 Millions | |
| Recent Price: 20.70 Smart Investing & Trading Score: 100 | |
| Day Percent Change: 0.88% Day Change: 0.18 | |
| Week Change: 1.97% Year-to-date Change: 10.6% | |
| EOS Links: Profile News Message Board | |
| Charts:- Daily , Weekly | |
| Add EOS to Watchlist: View: Get Complete EOS Trend Analysis ➞ | |
 | LAMR Lamar Advertising Company (REIT) |
| Sector: Financials | |
| SubSector: REIT - Diversified | |
| MarketCap: 4838.33 Millions | |
| Recent Price: 117.51 Smart Investing & Trading Score: 80 | |
| Day Percent Change: 0.68% Day Change: 0.79 | |
| Week Change: 2.11% Year-to-date Change: 10.6% | |
| LAMR Links: Profile News Message Board | |
| Charts:- Daily , Weekly | |
| Add LAMR to Watchlist: View: Get Complete LAMR Trend Analysis ➞ | |
 | BANC Banc of California, Inc. |
| Sector: Financials | |
| SubSector: Regional - Pacific Banks | |
| MarketCap: 459.929 Millions | |
| Recent Price: 14.84 Smart Investing & Trading Score: 100 | |
| Day Percent Change: 0.34% Day Change: 0.05 | |
| Week Change: 1.44% Year-to-date Change: 10.5% | |
| BANC Links: Profile News Message Board | |
| Charts:- Daily , Weekly | |
| Add BANC to Watchlist: View: Get Complete BANC Trend Analysis ➞ | |
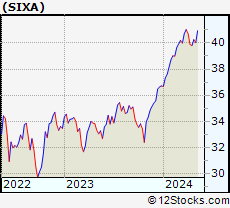 | SIXA 6 Meridian Mega Cap Equity ETF |
| Sector: Financials | |
| SubSector: Exchange Traded Fund | |
| MarketCap: 60157 Millions | |
| Recent Price: 40.58 Smart Investing & Trading Score: 85 | |
| Day Percent Change: 0.53% Day Change: 0.22 | |
| Week Change: 1.36% Year-to-date Change: 10.5% | |
| SIXA Links: Profile News Message Board | |
| Charts:- Daily , Weekly | |
| Add SIXA to Watchlist: View: Get Complete SIXA Trend Analysis ➞ | |
 | RLI RLI Corp. |
| Sector: Financials | |
| SubSector: Property & Casualty Insurance | |
| MarketCap: 3534.92 Millions | |
| Recent Price: 146.98 Smart Investing & Trading Score: 87 | |
| Day Percent Change: 0.44% Day Change: 0.64 | |
| Week Change: 2.38% Year-to-date Change: 10.4% | |
| RLI Links: Profile News Message Board | |
| Charts:- Daily , Weekly | |
| Add RLI to Watchlist: View: Get Complete RLI Trend Analysis ➞ | |
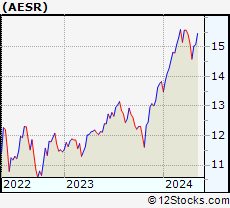 | AESR Anfield U.S. Equity Sector Rotation ETF |
| Sector: Financials | |
| SubSector: Exchange Traded Fund | |
| MarketCap: 60157 Millions | |
| Recent Price: 15.27 Smart Investing & Trading Score: 95 | |
| Day Percent Change: 0.26% Day Change: 0.04 | |
| Week Change: 1.26% Year-to-date Change: 10.4% | |
| AESR Links: Profile News Message Board | |
| Charts:- Daily , Weekly | |
| Add AESR to Watchlist: View: Get Complete AESR Trend Analysis ➞ | |
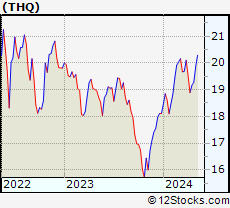 | THQ Tekla Healthcare Opportunities Fund |
| Sector: Financials | |
| SubSector: Closed-End Fund - Equity | |
| MarketCap: 518.247 Millions | |
| Recent Price: 19.99 Smart Investing & Trading Score: 95 | |
| Day Percent Change: 0.20% Day Change: 0.04 | |
| Week Change: 0.6% Year-to-date Change: 10.4% | |
| THQ Links: Profile News Message Board | |
| Charts:- Daily , Weekly | |
| Add THQ to Watchlist: View: Get Complete THQ Trend Analysis ➞ | |
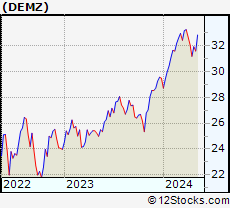 | DEMZ Demz Political Contributions ETF |
| Sector: Financials | |
| SubSector: Exchange Traded Fund | |
| MarketCap: 60157 Millions | |
| Recent Price: 32.53 Smart Investing & Trading Score: 77 | |
| Day Percent Change: 1.24% Day Change: 0.40 | |
| Week Change: 3.04% Year-to-date Change: 10.4% | |
| DEMZ Links: Profile News Message Board | |
| Charts:- Daily , Weekly | |
| Add DEMZ to Watchlist: View: Get Complete DEMZ Trend Analysis ➞ | |
 | VIRT Virtu Financial, Inc. |
| Sector: Financials | |
| SubSector: Investment Brokerage - National | |
| MarketCap: 4305.15 Millions | |
| Recent Price: 22.36 Smart Investing & Trading Score: 78 | |
| Day Percent Change: -1.80% Day Change: -0.41 | |
| Week Change: -0.8% Year-to-date Change: 10.4% | |
| VIRT Links: Profile News Message Board | |
| Charts:- Daily , Weekly | |
| Add VIRT to Watchlist: View: Get Complete VIRT Trend Analysis ➞ | |
 | RDN Radian Group Inc. |
| Sector: Financials | |
| SubSector: Property & Casualty Insurance | |
| MarketCap: 2950.12 Millions | |
| Recent Price: 31.50 Smart Investing & Trading Score: 95 | |
| Day Percent Change: 0.61% Day Change: 0.19 | |
| Week Change: 2.31% Year-to-date Change: 10.3% | |
| RDN Links: Profile News Message Board | |
| Charts:- Daily , Weekly | |
| Add RDN to Watchlist: View: Get Complete RDN Trend Analysis ➞ | |
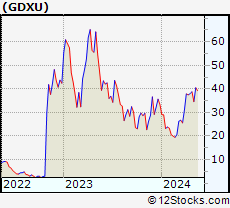 | GDXU MicroSectors Gold Miners 3X Leveraged ETNs |
| Sector: Financials | |
| SubSector: Exchange Traded Fund | |
| MarketCap: 60157 Millions | |
| Recent Price: 36.84 Smart Investing & Trading Score: 68 | |
| Day Percent Change: -1.55% Day Change: -0.58 | |
| Week Change: 6.38% Year-to-date Change: 10.3% | |
| GDXU Links: Profile News Message Board | |
| Charts:- Daily , Weekly | |
| Add GDXU to Watchlist: View: Get Complete GDXU Trend Analysis ➞ | |
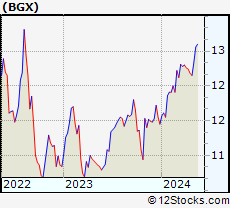 | BGX Blackstone / GSO Long-Short Credit Income Fund |
| Sector: Financials | |
| SubSector: Closed-End Fund - Debt | |
| MarketCap: 135.407 Millions | |
| Recent Price: 12.63 Smart Investing & Trading Score: 100 | |
| Day Percent Change: 2.02% Day Change: 0.25 | |
| Week Change: 2.35% Year-to-date Change: 10.3% | |
| BGX Links: Profile News Message Board | |
| Charts:- Daily , Weekly | |
| Add BGX to Watchlist: View: Get Complete BGX Trend Analysis ➞ | |
 | BK The Bank of New York Mellon Corporation |
| Sector: Financials | |
| SubSector: Asset Management | |
| MarketCap: 29807.5 Millions | |
| Recent Price: 57.40 Smart Investing & Trading Score: 95 | |
| Day Percent Change: -0.14% Day Change: -0.08 | |
| Week Change: 0.7% Year-to-date Change: 10.3% | |
| BK Links: Profile News Message Board | |
| Charts:- Daily , Weekly | |
| Add BK to Watchlist: View: Get Complete BK Trend Analysis ➞ | |
 | FITB Fifth Third Bancorp |
| Sector: Financials | |
| SubSector: Regional - Midwest Banks | |
| MarketCap: 10197 Millions | |
| Recent Price: 38.03 Smart Investing & Trading Score: 95 | |
| Day Percent Change: 0.08% Day Change: 0.03 | |
| Week Change: 1.25% Year-to-date Change: 10.3% | |
| FITB Links: Profile News Message Board | |
| Charts:- Daily , Weekly | |
| Add FITB to Watchlist: View: Get Complete FITB Trend Analysis ➞ | |
| For tabular summary view of above stock list: Summary View ➞ 0 - 25 , 25 - 50 , 50 - 75 , 75 - 100 , 100 - 125 , 125 - 150 , 150 - 175 , 175 - 200 , 200 - 225 , 225 - 250 , 250 - 275 , 275 - 300 , 300 - 325 , 325 - 350 , 350 - 375 , 375 - 400 , 400 - 425 , 425 - 450 , 450 - 475 , 475 - 500 , 500 - 525 , 525 - 550 , 550 - 575 , 575 - 600 , 600 - 625 , 625 - 650 , 650 - 675 , 675 - 700 , 700 - 725 , 725 - 750 , 750 - 775 , 775 - 800 , 800 - 825 , 825 - 850 , 850 - 875 , 875 - 900 , 900 - 925 , 925 - 950 , 950 - 975 , 975 - 1000 , 1000 - 1025 , 1025 - 1050 , 1050 - 1075 , 1075 - 1100 , 1100 - 1125 , 1125 - 1150 , 1150 - 1175 , 1175 - 1200 , 1200 - 1225 | ||
| Click To Change The Sort Order: By Market Cap or Company Size Performance: Year-to-date, Week and Day | |
| Select Chart Type: | ||
|
Best Stocks Today 12Stocks.com |
© 2024 12Stocks.com Terms & Conditions Privacy Contact Us
All Information Provided Only For Education And Not To Be Used For Investing or Trading. See Terms & Conditions


One More Thing ... Get Best Stocks Delivered Daily!
Never Ever Miss A Move With Our Top Ten Stocks Lists
Find Best Stocks In Any Market - Bull or Bear Market
Take A Peek At Our Top Ten Stocks Lists: Daily, Weekly, Year-to-Date & Top Trends
Find Best Stocks In Any Market - Bull or Bear Market
Take A Peek At Our Top Ten Stocks Lists: Daily, Weekly, Year-to-Date & Top Trends
Financial Stocks With Best Up Trends [0-bearish to 100-bullish]: Ambac [100], EverQuote [100], TOP [100], ProAssurance [100], Gladstone Commercial[100], USCB [100], Siebert [100], Eaton Vance[100], Star [100], John Hancock[100], AXIS Capital[100]
Best Financial Stocks Year-to-Date:
Root [501.43%], Banco Macro[121.01%], EverQuote [106.62%], Grupo Financiero[106.49%], Gladstone Capital[105.89%], Hippo [103.51%], Banco BBVA[102.39%], SelectQuote [77.37%], Grupo Supervielle[77.09%], Yiren Digital[65.71%], LendingTree [61.38%] Best Financial Stocks This Week:
Trupanion [28.72%], Ambac [22.97%], SelectQuote [19.12%], EverQuote [16.28%], eHealth [12.5%], Root [12.07%], Screaming Eagle[10%], Globe Life[9.81%], ProAssurance [9.62%], UBS [8.72%], IRSA Inversiones[8.64%] Best Financial Stocks Daily:
Ambac [19.31%], EverQuote [18.40%], Trupanion [13.51%], eHealth [11.32%], Root [9.93%], TOP [9.84%], ProAssurance [9.70%], UBS [7.03%], Huize Holding[6.81%], SelectQuote [6.11%], B. Riley[6.00%]