
 Login Sign Up


| |||||
 |  | ||||

| 12Stocks.com Market Intelligence |
Best Financial Stocks
| In a hurry? Financial Stocks Lists: Performance Trends Table, Stock Charts
Sort Financial stocks: Daily, Weekly, Year-to-Date, Market Cap & Trends. Filter Financial stocks list by size:All Financial Large Mid-Range Small & MicroCap |
| 12Stocks.com Financial Stocks Performances & Trends Daily | |||||||||
|
|  The overall Smart Investing & Trading Score is 75 (0-bearish to 100-bullish) which puts Financial sector in short term neutral to bullish trend. The Smart Investing & Trading Score from previous trading session is 70 and hence an improvement of trend.
| ||||||||
Here are the Smart Investing & Trading Scores of the most requested Financial stocks at 12Stocks.com (click stock name for detailed review):
|

| 12Stocks.com: Investing in Financial sector with Stocks | |
|
The following table helps investors and traders sort through current performance and trends (as measured by Smart Investing & Trading Score) of various
stocks in the Financial sector. Quick View: Move mouse or cursor over stock symbol (ticker) to view short-term Technical chart and over stock name to view long term chart. Click on  to add stock symbol to your watchlist and to add stock symbol to your watchlist and  to view watchlist. Click on any ticker or stock name for detailed market intelligence report for that stock. to view watchlist. Click on any ticker or stock name for detailed market intelligence report for that stock. |
12Stocks.com Performance of Stocks in Financial Sector
| Ticker | Stock Name | Watchlist | Category | Recent Price | Smart Investing & Trading Score | Change % | YTD Change% |
| TIPT | Tiptree |   | Life Insurance | 16.40 | 49 | -0.03% | -13.53% |
| BSRR | Sierra Bancorp | | Regional Banks | 19.46 | 67 | 2.80% | -13.70% |
| CBU | Community Bank | | Regional Banks | 44.92 | 67 | 1.06% | -13.80% |
| FBMS | First Bancshares | | Regional Banks | 25.26 | 87 | 2.64% | -13.88% |
| LOB | Live Oak | | S&L | 39.18 | 80 | 2.00% | -13.89% |
| CIGI | Colliers | | Property Mgmt | 108.88 | 32 | 0.29% | -13.94% |
| FIBK | First Interstate | | Regional Banks | 26.46 | 74 | 1.34% | -13.95% |
| ALEX | Alexander & Baldwin | | Real Estatet | 16.36 | 74 | 1.43% | -13.99% |
| CHMI | Cherry Hill | | Mortgage | 3.48 | 67 | -0.43% | -13.99% |
| ABR | Arbor Realty | | Mortgage | 13.06 | 74 | 2.31% | -14.00% |
| KRBN | KraneShares Trust | | Exchange Traded Fund | 31.34 | 30 | -1.20% | -14.00% |
| PSA | Public Storage | | REIT - Industrial | 262.26 | 32 | 0.31% | -14.01% |
| BANR | Banner | | Regional Banks | 46.03 | 67 | 1.79% | -14.06% |
| LBAI | Lakeland Bancorp | | Regional Banks | 12.70 | 74 | 0.79% | -14.13% |
| NSA | National Storage | | REIT - Industrial | 35.60 | 42 | 0.45% | -14.15% |
| AWH | Allied World | | Insurance | 3.50 | 39 | 0.00% | -14.22% |
| HBNC | Horizon Bancorp | | Regional Banks | 12.27 | 74 | 1.74% | -14.26% |
| FRBA | First Bank | | Regional Banks | 12.60 | 49 | 0.92% | -14.29% |
| FBIZ | First Business | | Regional Banks | 34.34 | 49 | -0.75% | -14.36% |
| KRC | Kilroy Realty | | REIT - Office | 34.06 | 62 | 1.92% | -14.51% |
| BDN | Brandywine Realty | | REIT - | 4.62 | 74 | 3.71% | -14.54% |
| BKU | BankUnited | | Regional Banks | 27.71 | 74 | 0.98% | -14.55% |
| PFS | Provident | | S&L | 15.40 | 74 | 1.35% | -14.56% |
| WABC | Westamerica Ban | | Regional Banks | 48.18 | 100 | 1.71% | -14.59% |
| BEN | Franklin Resources | | Asset Mgmt | 25.45 | 32 | -0.53% | -14.59% |
| For chart view version of above stock list: Chart View ➞ 0 - 25 , 25 - 50 , 50 - 75 , 75 - 100 , 100 - 125 , 125 - 150 , 150 - 175 , 175 - 200 , 200 - 225 , 225 - 250 , 250 - 275 , 275 - 300 , 300 - 325 , 325 - 350 , 350 - 375 , 375 - 400 , 400 - 425 , 425 - 450 , 450 - 475 , 475 - 500 , 500 - 525 , 525 - 550 , 550 - 575 , 575 - 600 , 600 - 625 , 625 - 650 , 650 - 675 , 675 - 700 , 700 - 725 , 725 - 750 , 750 - 775 , 775 - 800 , 800 - 825 , 825 - 850 | ||
 | Click To Change The Sort Order: By Market Cap or Company Size Performance: Year-to-date, Week and Day |  |
|
Get the most comprehensive stock market coverage daily at 12Stocks.com ➞ Best Stocks Today ➞ Best Stocks Weekly ➞ Best Stocks Year-to-Date ➞ Best Stocks Trends ➞  Best Stocks Today 12Stocks.com Best Nasdaq Stocks ➞ Best S&P 500 Stocks ➞ Best Tech Stocks ➞ Best Biotech Stocks ➞ |
| Detailed Overview of Financial Stocks |
| Financial Technical Overview, Leaders & Laggards, Top Financial ETF Funds & Detailed Financial Stocks List, Charts, Trends & More |
| Financial Sector: Technical Analysis, Trends & YTD Performance | |
| Financial sector is composed of stocks
from banks, brokers, insurance, REITs
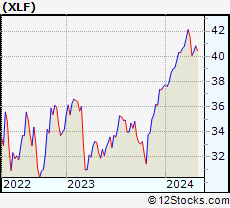
and services subsectors. Financial sector, as represented by XLF, an exchange-traded fund [ETF] that holds basket of Financial stocks (e.g, Bank of America, Goldman Sachs) is up by 9.31% and is currently outperforming the overall market by 3.82% year-to-date. Below is a quick view of Technical charts and trends: |
|
 XLF Weekly Chart |
|
| Long Term Trend: Very Good | |
| Medium Term Trend: Not Good | |
 XLF Daily Chart |
|
| Short Term Trend: Very Good | |
| Overall Trend Score: 75 | |
| YTD Performance: 9.31% | |
| **Trend Scores & Views Are Only For Educational Purposes And Not For Investing | |
| 12Stocks.com: Top Performing Financial Sector Stocks | ||||||||||||||||||||||||||||||||||||||||||||||||
 The top performing Financial sector stocks year to date are
Now, more recently, over last week, the top performing Financial sector stocks on the move are


|
||||||||||||||||||||||||||||||||||||||||||||||||
| 12Stocks.com: Investing in Financial Sector using Exchange Traded Funds | |
|
The following table shows list of key exchange traded funds (ETF) that
help investors track Financial Index. For detailed view, check out our ETF Funds section of our website. Quick View: Move mouse or cursor over ETF symbol (ticker) to view short-term Technical chart and over ETF name to view long term chart. Click on ticker or stock name for detailed view. Click on to add stock symbol to your watchlist and to view watchlist. |
12Stocks.com List of ETFs that track Financial Index
| Ticker | ETF Name | Watchlist | Recent Price | Smart Investing & Trading Score | Change % | Week % | Year-to-date % |
| XLF | Financial | | 41.10 | 75 | 0.56 | 1.78 | 9.31% |
| IAI | Broker-Dealers & Secs | | 113.16 | 75 | 0.25 | 1.92 | 4.27% |
| IYF | Financials | | 93.14 | 75 | 0.51 | 2.02 | 9.05% |
| IYG | Financial Services | | 64.83 | 75 | 0.71 | 2.23 | 8.53% |
| KRE | Regional Banking | | 48.84 | 74 | 2.33 | 3.22 | -6.84% |
| IXG | Global Financials | | 84.47 | 75 | 0.55 | 1.94 | 7.49% |
| VFH | Financials | | 99.84 | 75 | 1.56 | 2.14 | 8.22% |
| KBE | Bank | | 45.75 | 100 | 1.28 | 3.02 | -0.59% |
| FAS | Financial Bull 3X | | 103.04 | 75 | 1.42 | 5.21 | 24.66% |
| FAZ | Financial Bear 3X | | 10.56 | 25 | -2.00 | -5.76 | -22.79% |
| UYG | Financials | | 64.85 | 75 | 1.52 | 3.86 | 17.48% |
| IAT | Regional Banks | | 41.97 | 93 | 1.00 | 3.01 | 0.3% |
| KIE | Insurance | | 49.76 | 70 | 0.60 | 1.38 | 10.03% |
| PSCF | SmallCap Financials | | 46.24 | 52 | -0.01 | 1.69 | -5.99% |
| EUFN | Europe Financials | | 22.59 | 75 | 1.92 | 2.89 | 7.75% |
| PGF | Financial Preferred | | 14.66 | 32 | 1.00 | 0.93 | 0.58% |
| 12Stocks.com: Charts, Trends, Fundamental Data and Performances of Financial Stocks | |
|
We now take in-depth look at all Financial stocks including charts, multi-period performances and overall trends (as measured by Smart Investing & Trading Score). One can sort Financial stocks (click link to choose) by Daily, Weekly and by Year-to-Date performances. Also, one can sort by size of the company or by market capitalization. |
| Select Your Default Chart Type: | |||||
| |||||
| Click on stock symbol or name for detailed view. Click on to add stock symbol to your watchlist and to view watchlist. Quick View: Move mouse or cursor over "Daily" to quickly view daily Technical stock chart and over "Weekly" to view weekly Technical stock chart. | |||||

 | TIPT Tiptree Inc. |
| Sector: Financials | |
| SubSector: Life Insurance | |
| MarketCap: 183.486 Millions | |
| Recent Price: 16.40 Smart Investing & Trading Score: 49 | |
| Day Percent Change: -0.03% Day Change: 0.00 | |
| Week Change: 0.37% Year-to-date Change: -13.5% | |
| TIPT Links: Profile News Message Board | |
| Charts:- Daily , Weekly | |
| Add TIPT to Watchlist: View: Get Complete TIPT Trend Analysis ➞ | |
 | BSRR Sierra Bancorp |
| Sector: Financials | |
| SubSector: Regional - Pacific Banks | |
| MarketCap: 256.929 Millions | |
| Recent Price: 19.46 Smart Investing & Trading Score: 67 | |
| Day Percent Change: 2.80% Day Change: 0.53 | |
| Week Change: 3.79% Year-to-date Change: -13.7% | |
| BSRR Links: Profile News Message Board | |
| Charts:- Daily , Weekly | |
| Add BSRR to Watchlist: View: Get Complete BSRR Trend Analysis ➞ | |
 | CBU Community Bank System, Inc. |
| Sector: Financials | |
| SubSector: Regional - Midwest Banks | |
| MarketCap: 2787.8 Millions | |
| Recent Price: 44.92 Smart Investing & Trading Score: 67 | |
| Day Percent Change: 1.06% Day Change: 0.47 | |
| Week Change: 0.94% Year-to-date Change: -13.8% | |
| CBU Links: Profile News Message Board | |
| Charts:- Daily , Weekly | |
| Add CBU to Watchlist: View: Get Complete CBU Trend Analysis ➞ | |
 | FBMS The First Bancshares, Inc. |
| Sector: Financials | |
| SubSector: Regional - Southeast Banks | |
| MarketCap: 359.535 Millions | |
| Recent Price: 25.26 Smart Investing & Trading Score: 87 | |
| Day Percent Change: 2.64% Day Change: 0.65 | |
| Week Change: 2.89% Year-to-date Change: -13.9% | |
| FBMS Links: Profile News Message Board | |
| Charts:- Daily , Weekly | |
| Add FBMS to Watchlist: View: Get Complete FBMS Trend Analysis ➞ | |
 | LOB Live Oak Bancshares, Inc. |
| Sector: Financials | |
| SubSector: Savings & Loans | |
| MarketCap: 394.23 Millions | |
| Recent Price: 39.18 Smart Investing & Trading Score: 80 | |
| Day Percent Change: 2.00% Day Change: 0.77 | |
| Week Change: 3.38% Year-to-date Change: -13.9% | |
| LOB Links: Profile News Message Board | |
| Charts:- Daily , Weekly | |
| Add LOB to Watchlist: View: Get Complete LOB Trend Analysis ➞ | |
 | CIGI Colliers International Group Inc. |
| Sector: Financials | |
| SubSector: Property Management | |
| MarketCap: 1928.42 Millions | |
| Recent Price: 108.88 Smart Investing & Trading Score: 32 | |
| Day Percent Change: 0.29% Day Change: 0.32 | |
| Week Change: 2.5% Year-to-date Change: -13.9% | |
| CIGI Links: Profile News Message Board | |
| Charts:- Daily , Weekly | |
| Add CIGI to Watchlist: View: Get Complete CIGI Trend Analysis ➞ | |
 | FIBK First Interstate BancSystem, Inc. |
| Sector: Financials | |
| SubSector: Regional - Pacific Banks | |
| MarketCap: 1797.69 Millions | |
| Recent Price: 26.46 Smart Investing & Trading Score: 74 | |
| Day Percent Change: 1.34% Day Change: 0.35 | |
| Week Change: 3.36% Year-to-date Change: -14.0% | |
| FIBK Links: Profile News Message Board | |
| Charts:- Daily , Weekly | |
| Add FIBK to Watchlist: View: Get Complete FIBK Trend Analysis ➞ | |
 | ALEX Alexander & Baldwin, Inc. |
| Sector: Financials | |
| SubSector: Real Estate Development | |
| MarketCap: 751.419 Millions | |
| Recent Price: 16.36 Smart Investing & Trading Score: 74 | |
| Day Percent Change: 1.43% Day Change: 0.23 | |
| Week Change: 1.68% Year-to-date Change: -14.0% | |
| ALEX Links: Profile News Message Board | |
| Charts:- Daily , Weekly | |
| Add ALEX to Watchlist: View: Get Complete ALEX Trend Analysis ➞ | |
 | CHMI Cherry Hill Mortgage Investment Corporation |
| Sector: Financials | |
| SubSector: Mortgage Investment | |
| MarketCap: 124.839 Millions | |
| Recent Price: 3.48 Smart Investing & Trading Score: 67 | |
| Day Percent Change: -0.43% Day Change: -0.02 | |
| Week Change: 5.3% Year-to-date Change: -14.0% | |
| CHMI Links: Profile News Message Board | |
| Charts:- Daily , Weekly | |
| Add CHMI to Watchlist: View: Get Complete CHMI Trend Analysis ➞ | |
 | ABR Arbor Realty Trust, Inc. |
| Sector: Financials | |
| SubSector: Mortgage Investment | |
| MarketCap: 648.939 Millions | |
| Recent Price: 13.06 Smart Investing & Trading Score: 74 | |
| Day Percent Change: 2.31% Day Change: 0.29 | |
| Week Change: 3.45% Year-to-date Change: -14.0% | |
| ABR Links: Profile News Message Board | |
| Charts:- Daily , Weekly | |
| Add ABR to Watchlist: View: Get Complete ABR Trend Analysis ➞ | |
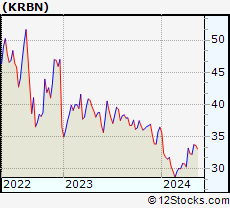 | KRBN KraneShares Trust KFA Global Carbon ETF |
| Sector: Financials | |
| SubSector: Exchange Traded Fund | |
| MarketCap: 60157 Millions | |
| Recent Price: 31.34 Smart Investing & Trading Score: 30 | |
| Day Percent Change: -1.20% Day Change: -0.38 | |
| Week Change: -2.97% Year-to-date Change: -14.0% | |
| KRBN Links: Profile News Message Board | |
| Charts:- Daily , Weekly | |
| Add KRBN to Watchlist: View: Get Complete KRBN Trend Analysis ➞ | |
 | PSA Public Storage |
| Sector: Financials | |
| SubSector: REIT - Industrial | |
| MarketCap: 32733.9 Millions | |
| Recent Price: 262.26 Smart Investing & Trading Score: 32 | |
| Day Percent Change: 0.31% Day Change: 0.82 | |
| Week Change: 0.72% Year-to-date Change: -14.0% | |
| PSA Links: Profile News Message Board | |
| Charts:- Daily , Weekly | |
| Add PSA to Watchlist: View: Get Complete PSA Trend Analysis ➞ | |
 | BANR Banner Corporation |
| Sector: Financials | |
| SubSector: Regional - Mid-Atlantic Banks | |
| MarketCap: 1187.09 Millions | |
| Recent Price: 46.03 Smart Investing & Trading Score: 67 | |
| Day Percent Change: 1.79% Day Change: 0.81 | |
| Week Change: 2.43% Year-to-date Change: -14.1% | |
| BANR Links: Profile News Message Board | |
| Charts:- Daily , Weekly | |
| Add BANR to Watchlist: View: Get Complete BANR Trend Analysis ➞ | |
 | LBAI Lakeland Bancorp, Inc. |
| Sector: Financials | |
| SubSector: Regional - Northeast Banks | |
| MarketCap: 534.599 Millions | |
| Recent Price: 12.70 Smart Investing & Trading Score: 74 | |
| Day Percent Change: 0.79% Day Change: 0.10 | |
| Week Change: 6.28% Year-to-date Change: -14.1% | |
| LBAI Links: Profile News Message Board | |
| Charts:- Daily , Weekly | |
| Add LBAI to Watchlist: View: Get Complete LBAI Trend Analysis ➞ | |
 | NSA National Storage Affiliates Trust |
| Sector: Financials | |
| SubSector: REIT - Industrial | |
| MarketCap: 1623.99 Millions | |
| Recent Price: 35.60 Smart Investing & Trading Score: 42 | |
| Day Percent Change: 0.45% Day Change: 0.16 | |
| Week Change: 0.28% Year-to-date Change: -14.2% | |
| NSA Links: Profile News Message Board | |
| Charts:- Daily , Weekly | |
| Add NSA to Watchlist: View: Get Complete NSA Trend Analysis ➞ | |
 | AWH Allied World Assurance Company Holdings, AG |
| Sector: Financials | |
| SubSector: Property & Casualty Insurance | |
| MarketCap: 4663.47 Millions | |
| Recent Price: 3.50 Smart Investing & Trading Score: 39 | |
| Day Percent Change: 0.00% Day Change: 0.00 | |
| Week Change: 0.29% Year-to-date Change: -14.2% | |
| AWH Links: Profile News Message Board | |
| Charts:- Daily , Weekly | |
| Add AWH to Watchlist: View: Get Complete AWH Trend Analysis ➞ | |
 | HBNC Horizon Bancorp, Inc. |
| Sector: Financials | |
| SubSector: Regional - Northeast Banks | |
| MarketCap: 405.999 Millions | |
| Recent Price: 12.27 Smart Investing & Trading Score: 74 | |
| Day Percent Change: 1.74% Day Change: 0.21 | |
| Week Change: 3.63% Year-to-date Change: -14.3% | |
| HBNC Links: Profile News Message Board | |
| Charts:- Daily , Weekly | |
| Add HBNC to Watchlist: View: Get Complete HBNC Trend Analysis ➞ | |
 | FRBA First Bank |
| Sector: Financials | |
| SubSector: Regional - Mid-Atlantic Banks | |
| MarketCap: 124.859 Millions | |
| Recent Price: 12.60 Smart Investing & Trading Score: 49 | |
| Day Percent Change: 0.92% Day Change: 0.12 | |
| Week Change: -0.94% Year-to-date Change: -14.3% | |
| FRBA Links: Profile News Message Board | |
| Charts:- Daily , Weekly | |
| Add FRBA to Watchlist: View: Get Complete FRBA Trend Analysis ➞ | |
 | FBIZ First Business Financial Services, Inc. |
| Sector: Financials | |
| SubSector: Regional - Midwest Banks | |
| MarketCap: 144.97 Millions | |
| Recent Price: 34.34 Smart Investing & Trading Score: 49 | |
| Day Percent Change: -0.75% Day Change: -0.26 | |
| Week Change: 0.12% Year-to-date Change: -14.4% | |
| FBIZ Links: Profile News Message Board | |
| Charts:- Daily , Weekly | |
| Add FBIZ to Watchlist: View: Get Complete FBIZ Trend Analysis ➞ | |
 | KRC Kilroy Realty Corporation |
| Sector: Financials | |
| SubSector: REIT - Office | |
| MarketCap: 6390.46 Millions | |
| Recent Price: 34.06 Smart Investing & Trading Score: 62 | |
| Day Percent Change: 1.92% Day Change: 0.64 | |
| Week Change: 2.93% Year-to-date Change: -14.5% | |
| KRC Links: Profile News Message Board | |
| Charts:- Daily , Weekly | |
| Add KRC to Watchlist: View: Get Complete KRC Trend Analysis ➞ | |
 | BDN Brandywine Realty Trust |
| Sector: Financials | |
| SubSector: REIT - Diversified | |
| MarketCap: 1688.13 Millions | |
| Recent Price: 4.62 Smart Investing & Trading Score: 74 | |
| Day Percent Change: 3.71% Day Change: 0.17 | |
| Week Change: 5.37% Year-to-date Change: -14.5% | |
| BDN Links: Profile News Message Board | |
| Charts:- Daily , Weekly | |
| Add BDN to Watchlist: View: Get Complete BDN Trend Analysis ➞ | |
 | BKU BankUnited, Inc. |
| Sector: Financials | |
| SubSector: Regional - Mid-Atlantic Banks | |
| MarketCap: 1905.99 Millions | |
| Recent Price: 27.71 Smart Investing & Trading Score: 74 | |
| Day Percent Change: 0.98% Day Change: 0.27 | |
| Week Change: 3.74% Year-to-date Change: -14.6% | |
| BKU Links: Profile News Message Board | |
| Charts:- Daily , Weekly | |
| Add BKU to Watchlist: View: Get Complete BKU Trend Analysis ➞ | |
 | PFS Provident Financial Services, Inc. |
| Sector: Financials | |
| SubSector: Savings & Loans | |
| MarketCap: 829.73 Millions | |
| Recent Price: 15.40 Smart Investing & Trading Score: 74 | |
| Day Percent Change: 1.35% Day Change: 0.21 | |
| Week Change: 6.54% Year-to-date Change: -14.6% | |
| PFS Links: Profile News Message Board | |
| Charts:- Daily , Weekly | |
| Add PFS to Watchlist: View: Get Complete PFS Trend Analysis ➞ | |
 | WABC Westamerica Bancorporation |
| Sector: Financials | |
| SubSector: Regional - Pacific Banks | |
| MarketCap: 1557.69 Millions | |
| Recent Price: 48.18 Smart Investing & Trading Score: 100 | |
| Day Percent Change: 1.71% Day Change: 0.81 | |
| Week Change: 2.99% Year-to-date Change: -14.6% | |
| WABC Links: Profile News Message Board | |
| Charts:- Daily , Weekly | |
| Add WABC to Watchlist: View: Get Complete WABC Trend Analysis ➞ | |
 | BEN Franklin Resources, Inc. |
| Sector: Financials | |
| SubSector: Asset Management | |
| MarketCap: 9419.73 Millions | |
| Recent Price: 25.45 Smart Investing & Trading Score: 32 | |
| Day Percent Change: -0.53% Day Change: -0.13 | |
| Week Change: 1.17% Year-to-date Change: -14.6% | |
| BEN Links: Profile News Message Board | |
| Charts:- Daily , Weekly | |
| Add BEN to Watchlist: View: Get Complete BEN Trend Analysis ➞ | |
| For tabular summary view of above stock list: Summary View ➞ 0 - 25 , 25 - 50 , 50 - 75 , 75 - 100 , 100 - 125 , 125 - 150 , 150 - 175 , 175 - 200 , 200 - 225 , 225 - 250 , 250 - 275 , 275 - 300 , 300 - 325 , 325 - 350 , 350 - 375 , 375 - 400 , 400 - 425 , 425 - 450 , 450 - 475 , 475 - 500 , 500 - 525 , 525 - 550 , 550 - 575 , 575 - 600 , 600 - 625 , 625 - 650 , 650 - 675 , 675 - 700 , 700 - 725 , 725 - 750 , 750 - 775 , 775 - 800 , 800 - 825 , 825 - 850 | ||
| Click To Change The Sort Order: By Market Cap or Company Size Performance: Year-to-date, Week and Day | |
| Select Chart Type: | ||
|
Best Stocks Today 12Stocks.com |
© 2024 12Stocks.com Terms & Conditions Privacy Contact Us
All Information Provided Only For Education And Not To Be Used For Investing or Trading. See Terms & Conditions


One More Thing ... Get Best Stocks Delivered Daily!
Never Ever Miss A Move With Our Top Ten Stocks Lists
Find Best Stocks In Any Market - Bull or Bear Market
Take A Peek At Our Top Ten Stocks Lists: Daily, Weekly, Year-to-Date & Top Trends
Find Best Stocks In Any Market - Bull or Bear Market
Take A Peek At Our Top Ten Stocks Lists: Daily, Weekly, Year-to-Date & Top Trends
Financial Stocks With Best Up Trends [0-bearish to 100-bullish]: NBT Bancorp[100], Peoples Bancorp[100], Piedmont Office[100], Preferred Bank[100], RLI [100], Popular [100], Equity Bancshares[100], Highwoods Properties[100], Banco Santander[100], BOK [100], Heartland [100]
Best Financial Stocks Year-to-Date:
Hippo [129.8%], Banco Macro[83.68%], Grupo Financiero[80.94%], Yiren Digital[61.22%], Grupo Supervielle[54.93%], Heritage Insurance[54.52%], Fidelis Insurance[53.46%], EverQuote [52.7%], First [51.11%], Mercury General[50.13%], GEO [39.75%] Best Financial Stocks This Week:
Cipher Mining[23.83%], Grupo Supervielle[14.36%], Iris Energy[13.74%], Coinbase Global[12.08%], ServisFirst Bancshares[10.36%], Grupo Financiero[9.77%], Peakstone Realty[9.39%], KB [9.26%], LendingTree [9.14%], Hywin [8.88%], New York[7.97%] Best Financial Stocks Daily:
ServisFirst Bancshares[8.42%], Franklin Street[6.26%], Heritage Insurance[6.05%], Peakstone Realty[5.54%], Fanhua [5.14%], Upstart [4.98%], LendingTree [4.84%], TrustCo Bank[4.78%], Coinbase Global[4.68%], NBT Bancorp[4.51%], Dime Community[4.51%]