
 Login Sign Up


| |||||
 |  | ||||

| 12Stocks.com Market Intelligence |
Best Financial Stocks
| In a hurry? Financial Stocks Lists: Performance Trends Table, Stock Charts
Sort Financial stocks: Daily, Weekly, Year-to-Date, Market Cap & Trends. Filter Financial stocks list by size:All Financial Large Mid-Range Small & MicroCap |
| 12Stocks.com Financial Stocks Performances & Trends Daily | |||||||||
|
|  The overall Smart Investing & Trading Score is 75 (0-bearish to 100-bullish) which puts Financial sector in short term neutral to bullish trend. The Smart Investing & Trading Score from previous trading session is 70 and hence an improvement of trend.
| ||||||||
Here are the Smart Investing & Trading Scores of the most requested Financial stocks at 12Stocks.com (click stock name for detailed review):
|

| 12Stocks.com: Investing in Financial sector with Stocks | |
|
The following table helps investors and traders sort through current performance and trends (as measured by Smart Investing & Trading Score) of various
stocks in the Financial sector. Quick View: Move mouse or cursor over stock symbol (ticker) to view short-term Technical chart and over stock name to view long term chart. Click on  to add stock symbol to your watchlist and to add stock symbol to your watchlist and  to view watchlist. Click on any ticker or stock name for detailed market intelligence report for that stock. to view watchlist. Click on any ticker or stock name for detailed market intelligence report for that stock. |
12Stocks.com Performance of Stocks in Financial Sector
| Ticker | Stock Name | Watchlist | Category | Recent Price | Smart Investing & Trading Score | Change % | YTD Change% |
| BRKL | Brookline Bancorp |   | S&L | 9.61 | 74 | 2.56% | -11.92% |
| FCF | First Commonwealth | | Regional Banks | 13.60 | 74 | 2.33% | -11.92% |
| CVLY | Codorus Valley | | Regional Banks | 22.63 | 74 | 1.41% | -11.96% |
| GLPI | Gaming and | | REIT - | 43.44 | 49 | 1.07% | -11.98% |
| CWH | Camping World | | REIT - Office | 23.11 | 32 | 0.87% | -12.00% |
| FMNB | Farmers National | | Regional Banks | 12.71 | 60 | 2.01% | -12.04% |
| KIM | Kimco Realty | | REIT - Retail | 18.74 | 64 | 0.75% | -12.06% |
| EFSC | Enterprise | | Regional - Southwest Banks | 39.16 | 60 | -1.37% | -12.28% |
| FR | First Industrial | | REIT - Industrial | 46.18 | 25 | 0.83% | -12.32% |
| BLFY | Blue Foundry | | Banks - Regional | 8.42 | 49 | 0.00% | -12.56% |
| HFWA | Heritage | | Regional Banks | 18.70 | 74 | 3.20% | -12.58% |
| NWBI | Northwest Bancshares | | S&L | 10.91 | 47 | -1.36% | -12.58% |
| VTR | Ventas | | REIT | 43.53 | 74 | 0.93% | -12.66% |
| WPC | W. P. | | REIT - | 56.53 | 74 | 0.55% | -12.78% |
| BHB | Bar Harbor | | Regional Banks | 25.60 | 74 | 0.47% | -12.81% |
| SAMG | Silvercrest Asset | | Asset Mgmt | 14.81 | 42 | 0.00% | -12.88% |
| AHH | Armada Hoffler | | REIT - | 10.78 | 74 | 0.51% | -12.89% |
| THFF | First | | Regional Banks | 37.48 | 74 | 1.63% | -12.90% |
| HTH | Hilltop | | Mortgage | 30.61 | 74 | 0.87% | -13.08% |
| MSB | Mesabi Trust | | Investments | 17.78 | 59 | 0.74% | -13.14% |
| NBTB | NBT Bancorp | | Regional Banks | 36.36 | 100 | 4.51% | -13.24% |
| FPI | Farmland Partners | | REIT - | 10.82 | 74 | 0.14% | -13.26% |
| HDB | HDFC Bank | | Foreign Banks | 58.20 | 71 | -0.17% | -13.28% |
| CUBI | Customers Bancorp | | Regional Banks | 49.95 | 42 | 2.00% | -13.31% |
| USCB | USCB | | Banks - Regional | 10.64 | 34 | 0.00% | -13.36% |
| For chart view version of above stock list: Chart View ➞ 0 - 25 , 25 - 50 , 50 - 75 , 75 - 100 , 100 - 125 , 125 - 150 , 150 - 175 , 175 - 200 , 200 - 225 , 225 - 250 , 250 - 275 , 275 - 300 , 300 - 325 , 325 - 350 , 350 - 375 , 375 - 400 , 400 - 425 , 425 - 450 , 450 - 475 , 475 - 500 , 500 - 525 , 525 - 550 , 550 - 575 , 575 - 600 , 600 - 625 , 625 - 650 , 650 - 675 , 675 - 700 , 700 - 725 , 725 - 750 , 750 - 775 , 775 - 800 , 800 - 825 , 825 - 850 | ||
 | Click To Change The Sort Order: By Market Cap or Company Size Performance: Year-to-date, Week and Day |  |
|
Get the most comprehensive stock market coverage daily at 12Stocks.com ➞ Best Stocks Today ➞ Best Stocks Weekly ➞ Best Stocks Year-to-Date ➞ Best Stocks Trends ➞  Best Stocks Today 12Stocks.com Best Nasdaq Stocks ➞ Best S&P 500 Stocks ➞ Best Tech Stocks ➞ Best Biotech Stocks ➞ |
| Detailed Overview of Financial Stocks |
| Financial Technical Overview, Leaders & Laggards, Top Financial ETF Funds & Detailed Financial Stocks List, Charts, Trends & More |
| Financial Sector: Technical Analysis, Trends & YTD Performance | |
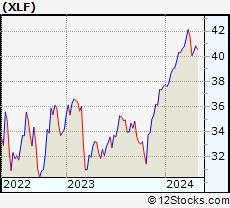
| Financial sector is composed of stocks
from banks, brokers, insurance, REITs
and services subsectors. Financial sector, as represented by XLF, an exchange-traded fund [ETF] that holds basket of Financial stocks (e.g, Bank of America, Goldman Sachs) is up by 9.31% and is currently outperforming the overall market by 3.82% year-to-date. Below is a quick view of Technical charts and trends: |
|
 XLF Weekly Chart |
|
| Long Term Trend: Very Good | |
| Medium Term Trend: Not Good | |
 XLF Daily Chart |
|
| Short Term Trend: Very Good | |
| Overall Trend Score: 75 | |
| YTD Performance: 9.31% | |
| **Trend Scores & Views Are Only For Educational Purposes And Not For Investing | |
| 12Stocks.com: Top Performing Financial Sector Stocks | ||||||||||||||||||||||||||||||||||||||||||||||||
 The top performing Financial sector stocks year to date are
Now, more recently, over last week, the top performing Financial sector stocks on the move are


|
||||||||||||||||||||||||||||||||||||||||||||||||
| 12Stocks.com: Investing in Financial Sector using Exchange Traded Funds | |
|
The following table shows list of key exchange traded funds (ETF) that
help investors track Financial Index. For detailed view, check out our ETF Funds section of our website. Quick View: Move mouse or cursor over ETF symbol (ticker) to view short-term Technical chart and over ETF name to view long term chart. Click on ticker or stock name for detailed view. Click on to add stock symbol to your watchlist and to view watchlist. |
12Stocks.com List of ETFs that track Financial Index
| Ticker | ETF Name | Watchlist | Recent Price | Smart Investing & Trading Score | Change % | Week % | Year-to-date % |
| XLF | Financial | | 41.10 | 75 | 0.56 | 1.78 | 9.31% |
| IAI | Broker-Dealers & Secs | | 113.16 | 75 | 0.25 | 1.92 | 4.27% |
| IYF | Financials | | 93.14 | 75 | 0.51 | 2.02 | 9.05% |
| IYG | Financial Services | | 64.83 | 75 | 0.71 | 2.23 | 8.53% |
| KRE | Regional Banking | | 48.84 | 74 | 2.33 | 3.22 | -6.84% |
| IXG | Global Financials | | 84.47 | 75 | 0.55 | 1.94 | 7.49% |
| VFH | Financials | | 99.84 | 75 | 1.56 | 2.14 | 8.22% |
| KBE | Bank | | 45.75 | 100 | 1.28 | 3.02 | -0.59% |
| FAS | Financial Bull 3X | | 103.04 | 75 | 1.42 | 5.21 | 24.66% |
| FAZ | Financial Bear 3X | | 10.56 | 25 | -2.00 | -5.76 | -22.79% |
| UYG | Financials | | 64.85 | 75 | 1.52 | 3.86 | 17.48% |
| IAT | Regional Banks | | 41.97 | 93 | 1.00 | 3.01 | 0.3% |
| KIE | Insurance | | 49.76 | 70 | 0.60 | 1.38 | 10.03% |
| PSCF | SmallCap Financials | | 46.24 | 52 | -0.01 | 1.69 | -5.99% |
| EUFN | Europe Financials | | 22.59 | 75 | 1.92 | 2.89 | 7.75% |
| PGF | Financial Preferred | | 14.66 | 32 | 1.00 | 0.93 | 0.58% |
| 12Stocks.com: Charts, Trends, Fundamental Data and Performances of Financial Stocks | |
|
We now take in-depth look at all Financial stocks including charts, multi-period performances and overall trends (as measured by Smart Investing & Trading Score). One can sort Financial stocks (click link to choose) by Daily, Weekly and by Year-to-Date performances. Also, one can sort by size of the company or by market capitalization. |
| Select Your Default Chart Type: | |||||
| |||||
| Click on stock symbol or name for detailed view. Click on to add stock symbol to your watchlist and to view watchlist. Quick View: Move mouse or cursor over "Daily" to quickly view daily Technical stock chart and over "Weekly" to view weekly Technical stock chart. | |||||

 | BRKL Brookline Bancorp, Inc. |
| Sector: Financials | |
| SubSector: Savings & Loans | |
| MarketCap: 894.43 Millions | |
| Recent Price: 9.61 Smart Investing & Trading Score: 74 | |
| Day Percent Change: 2.56% Day Change: 0.24 | |
| Week Change: 2.45% Year-to-date Change: -11.9% | |
| BRKL Links: Profile News Message Board | |
| Charts:- Daily , Weekly | |
| Add BRKL to Watchlist: View: Get Complete BRKL Trend Analysis ➞ | |
 | FCF First Commonwealth Financial Corporation |
| Sector: Financials | |
| SubSector: Regional - Northeast Banks | |
| MarketCap: 900.299 Millions | |
| Recent Price: 13.60 Smart Investing & Trading Score: 74 | |
| Day Percent Change: 2.33% Day Change: 0.31 | |
| Week Change: 3.03% Year-to-date Change: -11.9% | |
| FCF Links: Profile News Message Board | |
| Charts:- Daily , Weekly | |
| Add FCF to Watchlist: View: Get Complete FCF Trend Analysis ➞ | |
 | CVLY Codorus Valley Bancorp, Inc. |
| Sector: Financials | |
| SubSector: Regional - Northeast Banks | |
| MarketCap: 173.799 Millions | |
| Recent Price: 22.63 Smart Investing & Trading Score: 74 | |
| Day Percent Change: 1.41% Day Change: 0.32 | |
| Week Change: 1.28% Year-to-date Change: -12.0% | |
| CVLY Links: Profile News Message Board | |
| Charts:- Daily , Weekly | |
| Add CVLY to Watchlist: View: Get Complete CVLY Trend Analysis ➞ | |
 | GLPI Gaming and Leisure Properties, Inc. |
| Sector: Financials | |
| SubSector: REIT - Diversified | |
| MarketCap: 4922.33 Millions | |
| Recent Price: 43.44 Smart Investing & Trading Score: 49 | |
| Day Percent Change: 1.07% Day Change: 0.46 | |
| Week Change: 1.5% Year-to-date Change: -12.0% | |
| GLPI Links: Profile News Message Board | |
| Charts:- Daily , Weekly | |
| Add GLPI to Watchlist: View: Get Complete GLPI Trend Analysis ➞ | |
 | CWH Camping World Holdings, Inc. |
| Sector: Financials | |
| SubSector: REIT - Office | |
| MarketCap: 473.566 Millions | |
| Recent Price: 23.11 Smart Investing & Trading Score: 32 | |
| Day Percent Change: 0.87% Day Change: 0.20 | |
| Week Change: 3.49% Year-to-date Change: -12.0% | |
| CWH Links: Profile News Message Board | |
| Charts:- Daily , Weekly | |
| Add CWH to Watchlist: View: Get Complete CWH Trend Analysis ➞ | |
 | FMNB Farmers National Banc Corp. |
| Sector: Financials | |
| SubSector: Regional - Midwest Banks | |
| MarketCap: 366.57 Millions | |
| Recent Price: 12.71 Smart Investing & Trading Score: 60 | |
| Day Percent Change: 2.01% Day Change: 0.25 | |
| Week Change: 2.42% Year-to-date Change: -12.0% | |
| FMNB Links: Profile News Message Board | |
| Charts:- Daily , Weekly | |
| Add FMNB to Watchlist: View: Get Complete FMNB Trend Analysis ➞ | |
 | KIM Kimco Realty Corporation |
| Sector: Financials | |
| SubSector: REIT - Retail | |
| MarketCap: 5358.64 Millions | |
| Recent Price: 18.74 Smart Investing & Trading Score: 64 | |
| Day Percent Change: 0.75% Day Change: 0.14 | |
| Week Change: 2.97% Year-to-date Change: -12.1% | |
| KIM Links: Profile News Message Board | |
| Charts:- Daily , Weekly | |
| Add KIM to Watchlist: View: Get Complete KIM Trend Analysis ➞ | |
 | EFSC Enterprise Financial Services Corp |
| Sector: Financials | |
| SubSector: Regional - Southwest Banks | |
| MarketCap: 770.165 Millions | |
| Recent Price: 39.16 Smart Investing & Trading Score: 60 | |
| Day Percent Change: -1.37% Day Change: -0.55 | |
| Week Change: -1.3% Year-to-date Change: -12.3% | |
| EFSC Links: Profile News Message Board | |
| Charts:- Daily , Weekly | |
| Add EFSC to Watchlist: View: Get Complete EFSC Trend Analysis ➞ | |
 | FR First Industrial Realty Trust, Inc. |
| Sector: Financials | |
| SubSector: REIT - Industrial | |
| MarketCap: 3883.39 Millions | |
| Recent Price: 46.18 Smart Investing & Trading Score: 25 | |
| Day Percent Change: 0.83% Day Change: 0.38 | |
| Week Change: 1.21% Year-to-date Change: -12.3% | |
| FR Links: Profile News Message Board | |
| Charts:- Daily , Weekly | |
| Add FR to Watchlist: View: Get Complete FR Trend Analysis ➞ | |
 | BLFY Blue Foundry Bancorp |
| Sector: Financials | |
| SubSector: Banks - Regional | |
| MarketCap: 264 Millions | |
| Recent Price: 8.42 Smart Investing & Trading Score: 49 | |
| Day Percent Change: 0.00% Day Change: 0.00 | |
| Week Change: -0.12% Year-to-date Change: -12.6% | |
| BLFY Links: Profile News Message Board | |
| Charts:- Daily , Weekly | |
| Add BLFY to Watchlist: View: Get Complete BLFY Trend Analysis ➞ | |
 | HFWA Heritage Financial Corporation |
| Sector: Financials | |
| SubSector: Regional - Pacific Banks | |
| MarketCap: 752.829 Millions | |
| Recent Price: 18.70 Smart Investing & Trading Score: 74 | |
| Day Percent Change: 3.20% Day Change: 0.58 | |
| Week Change: 2.92% Year-to-date Change: -12.6% | |
| HFWA Links: Profile News Message Board | |
| Charts:- Daily , Weekly | |
| Add HFWA to Watchlist: View: Get Complete HFWA Trend Analysis ➞ | |
 | NWBI Northwest Bancshares, Inc. |
| Sector: Financials | |
| SubSector: Savings & Loans | |
| MarketCap: 1266.3 Millions | |
| Recent Price: 10.91 Smart Investing & Trading Score: 47 | |
| Day Percent Change: -1.36% Day Change: -0.15 | |
| Week Change: -1.98% Year-to-date Change: -12.6% | |
| NWBI Links: Profile News Message Board | |
| Charts:- Daily , Weekly | |
| Add NWBI to Watchlist: View: Get Complete NWBI Trend Analysis ➞ | |
 | VTR Ventas, Inc. |
| Sector: Financials | |
| SubSector: REIT - Healthcare Facilities | |
| MarketCap: 11180.4 Millions | |
| Recent Price: 43.53 Smart Investing & Trading Score: 74 | |
| Day Percent Change: 0.93% Day Change: 0.40 | |
| Week Change: 0.93% Year-to-date Change: -12.7% | |
| VTR Links: Profile News Message Board | |
| Charts:- Daily , Weekly | |
| Add VTR to Watchlist: View: Get Complete VTR Trend Analysis ➞ | |
 | WPC W. P. Carey Inc. |
| Sector: Financials | |
| SubSector: REIT - Diversified | |
| MarketCap: 9560.03 Millions | |
| Recent Price: 56.53 Smart Investing & Trading Score: 74 | |
| Day Percent Change: 0.55% Day Change: 0.31 | |
| Week Change: 0.57% Year-to-date Change: -12.8% | |
| WPC Links: Profile News Message Board | |
| Charts:- Daily , Weekly | |
| Add WPC to Watchlist: View: Get Complete WPC Trend Analysis ➞ | |
 | BHB Bar Harbor Bankshares |
| Sector: Financials | |
| SubSector: Regional - Northeast Banks | |
| MarketCap: 298.099 Millions | |
| Recent Price: 25.60 Smart Investing & Trading Score: 74 | |
| Day Percent Change: 0.47% Day Change: 0.12 | |
| Week Change: 0.47% Year-to-date Change: -12.8% | |
| BHB Links: Profile News Message Board | |
| Charts:- Daily , Weekly | |
| Add BHB to Watchlist: View: Get Complete BHB Trend Analysis ➞ | |
 | SAMG Silvercrest Asset Management Group Inc. |
| Sector: Financials | |
| SubSector: Asset Management | |
| MarketCap: 116.303 Millions | |
| Recent Price: 14.81 Smart Investing & Trading Score: 42 | |
| Day Percent Change: 0.00% Day Change: 0.00 | |
| Week Change: 1.3% Year-to-date Change: -12.9% | |
| SAMG Links: Profile News Message Board | |
| Charts:- Daily , Weekly | |
| Add SAMG to Watchlist: View: Get Complete SAMG Trend Analysis ➞ | |
 | AHH Armada Hoffler Properties, Inc. |
| Sector: Financials | |
| SubSector: REIT - Diversified | |
| MarketCap: 550.653 Millions | |
| Recent Price: 10.78 Smart Investing & Trading Score: 74 | |
| Day Percent Change: 0.51% Day Change: 0.05 | |
| Week Change: 2.62% Year-to-date Change: -12.9% | |
| AHH Links: Profile News Message Board | |
| Charts:- Daily , Weekly | |
| Add AHH to Watchlist: View: Get Complete AHH Trend Analysis ➞ | |
 | THFF First Financial Corporation |
| Sector: Financials | |
| SubSector: Regional - Midwest Banks | |
| MarketCap: 433.07 Millions | |
| Recent Price: 37.48 Smart Investing & Trading Score: 74 | |
| Day Percent Change: 1.63% Day Change: 0.60 | |
| Week Change: 2.38% Year-to-date Change: -12.9% | |
| THFF Links: Profile News Message Board | |
| Charts:- Daily , Weekly | |
| Add THFF to Watchlist: View: Get Complete THFF Trend Analysis ➞ | |
 | HTH Hilltop Holdings Inc. |
| Sector: Financials | |
| SubSector: Mortgage Investment | |
| MarketCap: 1317.89 Millions | |
| Recent Price: 30.61 Smart Investing & Trading Score: 74 | |
| Day Percent Change: 0.87% Day Change: 0.27 | |
| Week Change: 2.05% Year-to-date Change: -13.1% | |
| HTH Links: Profile News Message Board | |
| Charts:- Daily , Weekly | |
| Add HTH to Watchlist: View: Get Complete HTH Trend Analysis ➞ | |
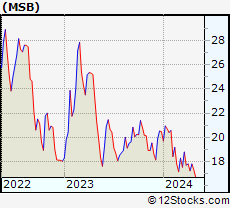 | MSB Mesabi Trust |
| Sector: Financials | |
| SubSector: Diversified Investments | |
| MarketCap: 184.57 Millions | |
| Recent Price: 17.78 Smart Investing & Trading Score: 59 | |
| Day Percent Change: 0.74% Day Change: 0.13 | |
| Week Change: -0.06% Year-to-date Change: -13.1% | |
| MSB Links: Profile News Message Board | |
| Charts:- Daily , Weekly | |
| Add MSB to Watchlist: View: Get Complete MSB Trend Analysis ➞ | |
 | NBTB NBT Bancorp Inc. |
| Sector: Financials | |
| SubSector: Regional - Northeast Banks | |
| MarketCap: 1451.89 Millions | |
| Recent Price: 36.36 Smart Investing & Trading Score: 100 | |
| Day Percent Change: 4.51% Day Change: 1.57 | |
| Week Change: 5.06% Year-to-date Change: -13.2% | |
| NBTB Links: Profile News Message Board | |
| Charts:- Daily , Weekly | |
| Add NBTB to Watchlist: View: Get Complete NBTB Trend Analysis ➞ | |
 | FPI Farmland Partners Inc. |
| Sector: Financials | |
| SubSector: REIT - Diversified | |
| MarketCap: 182.653 Millions | |
| Recent Price: 10.82 Smart Investing & Trading Score: 74 | |
| Day Percent Change: 0.14% Day Change: 0.01 | |
| Week Change: 0.7% Year-to-date Change: -13.3% | |
| FPI Links: Profile News Message Board | |
| Charts:- Daily , Weekly | |
| Add FPI to Watchlist: View: Get Complete FPI Trend Analysis ➞ | |
 | HDB HDFC Bank Limited |
| Sector: Financials | |
| SubSector: Foreign Regional Banks | |
| MarketCap: 29894.1 Millions | |
| Recent Price: 58.20 Smart Investing & Trading Score: 71 | |
| Day Percent Change: -0.17% Day Change: -0.10 | |
| Week Change: -1.44% Year-to-date Change: -13.3% | |
| HDB Links: Profile News Message Board | |
| Charts:- Daily , Weekly | |
| Add HDB to Watchlist: View: Get Complete HDB Trend Analysis ➞ | |
 | CUBI Customers Bancorp, Inc. |
| Sector: Financials | |
| SubSector: Regional - Northeast Banks | |
| MarketCap: 385.399 Millions | |
| Recent Price: 49.95 Smart Investing & Trading Score: 42 | |
| Day Percent Change: 2.00% Day Change: 0.98 | |
| Week Change: 3.59% Year-to-date Change: -13.3% | |
| CUBI Links: Profile News Message Board | |
| Charts:- Daily , Weekly | |
| Add CUBI to Watchlist: View: Get Complete CUBI Trend Analysis ➞ | |
 | USCB USCB Financial Holdings, Inc. |
| Sector: Financials | |
| SubSector: Banks - Regional | |
| MarketCap: 198 Millions | |
| Recent Price: 10.64 Smart Investing & Trading Score: 34 | |
| Day Percent Change: 0.00% Day Change: 0.00 | |
| Week Change: -0.09% Year-to-date Change: -13.4% | |
| USCB Links: Profile News Message Board | |
| Charts:- Daily , Weekly | |
| Add USCB to Watchlist: View: Get Complete USCB Trend Analysis ➞ | |
| For tabular summary view of above stock list: Summary View ➞ 0 - 25 , 25 - 50 , 50 - 75 , 75 - 100 , 100 - 125 , 125 - 150 , 150 - 175 , 175 - 200 , 200 - 225 , 225 - 250 , 250 - 275 , 275 - 300 , 300 - 325 , 325 - 350 , 350 - 375 , 375 - 400 , 400 - 425 , 425 - 450 , 450 - 475 , 475 - 500 , 500 - 525 , 525 - 550 , 550 - 575 , 575 - 600 , 600 - 625 , 625 - 650 , 650 - 675 , 675 - 700 , 700 - 725 , 725 - 750 , 750 - 775 , 775 - 800 , 800 - 825 , 825 - 850 | ||
| Click To Change The Sort Order: By Market Cap or Company Size Performance: Year-to-date, Week and Day | |
| Select Chart Type: | ||
|
Best Stocks Today 12Stocks.com |
© 2024 12Stocks.com Terms & Conditions Privacy Contact Us
All Information Provided Only For Education And Not To Be Used For Investing or Trading. See Terms & Conditions


One More Thing ... Get Best Stocks Delivered Daily!
Never Ever Miss A Move With Our Top Ten Stocks Lists
Find Best Stocks In Any Market - Bull or Bear Market
Take A Peek At Our Top Ten Stocks Lists: Daily, Weekly, Year-to-Date & Top Trends
Find Best Stocks In Any Market - Bull or Bear Market
Take A Peek At Our Top Ten Stocks Lists: Daily, Weekly, Year-to-Date & Top Trends
Financial Stocks With Best Up Trends [0-bearish to 100-bullish]: NBT Bancorp[100], Peoples Bancorp[100], Piedmont Office[100], Preferred Bank[100], RLI [100], Popular [100], Equity Bancshares[100], Highwoods Properties[100], Banco Santander[100], BOK [100], Heartland [100]
Best Financial Stocks Year-to-Date:
Hippo [129.8%], Banco Macro[83.68%], Grupo Financiero[80.94%], Yiren Digital[61.22%], Grupo Supervielle[54.93%], Heritage Insurance[54.52%], Fidelis Insurance[53.46%], EverQuote [52.7%], First [51.11%], Mercury General[50.13%], GEO [39.75%] Best Financial Stocks This Week:
Cipher Mining[23.83%], Grupo Supervielle[14.36%], Iris Energy[13.74%], Coinbase Global[12.08%], ServisFirst Bancshares[10.36%], Grupo Financiero[9.77%], Peakstone Realty[9.39%], KB [9.26%], LendingTree [9.14%], Hywin [8.88%], New York[7.97%] Best Financial Stocks Daily:
ServisFirst Bancshares[8.42%], Franklin Street[6.26%], Heritage Insurance[6.05%], Peakstone Realty[5.54%], Fanhua [5.14%], Upstart [4.98%], LendingTree [4.84%], TrustCo Bank[4.78%], Coinbase Global[4.68%], NBT Bancorp[4.51%], Dime Community[4.51%]