
 Login Sign Up


| |||||
 |  | ||||

| 12Stocks.com Market Intelligence |
Best Financial Stocks
| In a hurry? Financial Stocks Lists: Performance Trends Table, Stock Charts
Sort Financial stocks: Daily, Weekly, Year-to-Date, Market Cap & Trends. Filter Financial stocks list by size:All Financial Large Mid-Range Small & MicroCap |
| 12Stocks.com Financial Stocks Performances & Trends Daily | |||||||||
|
|  The overall Smart Investing & Trading Score is 83 (0-bearish to 100-bullish) which puts Financial sector in short term bullish trend. The Smart Investing & Trading Score from previous trading session is 63 and hence an improvement of trend.
| ||||||||
Here are the Smart Investing & Trading Scores of the most requested Financial stocks at 12Stocks.com (click stock name for detailed review):
|


| 12Stocks.com: Investing in Financial sector with Stocks | |
|
The following table helps investors and traders sort through current performance and trends (as measured by Smart Investing & Trading Score) of various
stocks in the Financial sector. Quick View: Move mouse or cursor over stock symbol (ticker) to view short-term Technical chart and over stock name to view long term chart. Click on  to add stock symbol to your watchlist and to add stock symbol to your watchlist and  to view watchlist. Click on any ticker or stock name for detailed market intelligence report for that stock. to view watchlist. Click on any ticker or stock name for detailed market intelligence report for that stock. |
12Stocks.com Performance of Stocks in Financial Sector
| Ticker | Stock Name | Watchlist | Category | Recent Price | Trend Score | Change % | YTD Change% |
| AGNC | AGNC |   | Mortgage | 9.27 | 37 | -0.64% | -5.50% |
| COLD | Americold Realty | | REIT - Industrial | 22.45 | 35 | 0.97% | -25.82% |
| FNF | Fidelity National | | Insurance | 50.76 | 88 | 0.72% | -0.52% |
| PAGS | PagSeguro Digital | | Credit Services | 12.75 | 64 | 0.55% | 2.25% |
| OHI | Omega Healthcare | | REIT | 30.88 | 66 | -0.68% | 0.72% |
| KRC | Kilroy Realty | | REIT - Office | 34.07 | 69 | 2.81% | -14.48% |
| SEIC | SEI s | | Asset Mgmt | 66.73 | 51 | 0.24% | 5.00% |
| REG | Regency Centers | | REIT - Retail | 58.47 | 25 | 0.33% | -12.73% |
| VNO | Vornado Realty | | REIT - | 27.04 | 60 | 2.97% | -4.28% |
| CBSH | Commerce Bancshares | | Regional Banks | 55.55 | 83 | 0.25% | 4.01% |
| AEG | Aegon N.V | | Life Insurance | 6.25 | 100 | 0.89% | 8.59% |
| RNR | RenaissanceRe | | Insurance | 221.32 | 47 | 1.02% | 12.92% |
| AMH | American Homes | | REIT | 36.28 | 100 | -0.36% | 0.89% |
| AIZ | Assurant | | Insurance | 174.71 | 58 | 1.06% | 3.69% |
| FRT | Federal Realty | | REIT - Retail | 102.89 | 88 | 0.68% | -0.16% |
| ARES | Ares Management | | Asset Mgmt | 133.57 | 55 | -0.04% | 12.32% |
| EQH | Equitable | | Insurance | 37.23 | 75 | 0.94% | 11.82% |
| NNN | National Retail | | REIT - | 40.37 | 20 | -0.96% | -6.33% |
| KIM | Kimco Realty | | REIT - Retail | 18.67 | 64 | 1.58% | -12.39% |
| AFG | American | | Insurance | 128.06 | 68 | 0.57% | 7.71% |
| JLL | Jones Lang | | Property Mgmt | 183.85 | 85 | 0.74% | -2.66% |
| CACC | Credit Acceptance | | Credit Services | 531.19 | 32 | 0.87% | -0.29% |
| CIB | Bancolombia S.A | | Foreign Banks | 33.35 | 70 | 1.61% | 8.38% |
| GLPI | Gaming and | | REIT - | 43.02 | 35 | 1.31% | -12.84% |
| DEI | Douglas Emmett | | REIT - | 13.66 | 93 | 2.21% | -5.76% |
| For chart view version of above stock list: Chart View ➞ 0 - 25 , 25 - 50 , 50 - 75 , 75 - 100 , 100 - 125 , 125 - 150 , 150 - 175 , 175 - 200 , 200 - 225 , 225 - 250 , 250 - 275 , 275 - 300 , 300 - 325 , 325 - 350 , 350 - 375 , 375 - 400 , 400 - 425 , 425 - 450 , 450 - 475 , 475 - 500 , 500 - 525 , 525 - 550 , 550 - 575 , 575 - 600 , 600 - 625 , 625 - 650 , 650 - 675 , 675 - 700 , 700 - 725 , 725 - 750 , 750 - 775 , 775 - 800 , 800 - 825 , 825 - 850 , 850 - 875 , 875 - 900 , 900 - 925 , 925 - 950 , 950 - 975 , 975 - 1000 , 1000 - 1025 , 1025 - 1050 , 1050 - 1075 , 1075 - 1100 , 1100 - 1125 , 1125 - 1150 , 1150 - 1175 | ||
 | Click To Change The Sort Order: By Market Cap or Company Size Performance: Year-to-date, Week and Day |  |
|
Get the most comprehensive stock market coverage daily at 12Stocks.com ➞ Best Stocks Today ➞ Best Stocks Weekly ➞ Best Stocks Year-to-Date ➞ Best Stocks Trends ➞  Best Stocks Today 12Stocks.com Best Nasdaq Stocks ➞ Best S&P 500 Stocks ➞ Best Tech Stocks ➞ Best Biotech Stocks ➞ |
| Detailed Overview of Financial Stocks |
| Financial Technical Overview, Leaders & Laggards, Top Financial ETF Funds & Detailed Financial Stocks List, Charts, Trends & More |
| Financial Sector: Technical Analysis, Trends & YTD Performance | |
| Financial sector is composed of stocks
from banks, brokers, insurance, REITs
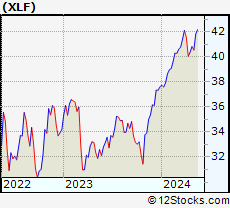
and services subsectors. Financial sector, as represented by XLF, an exchange-traded fund [ETF] that holds basket of Financial stocks (e.g, Bank of America, Goldman Sachs) is up by 8.74% and is currently outperforming the overall market by 2.24% year-to-date. Below is a quick view of Technical charts and trends: |
|
 XLF Weekly Chart |
|
| Long Term Trend: Very Good | |
| Medium Term Trend: Good | |
 XLF Daily Chart |
|
| Short Term Trend: Deteriorating | |
| Overall Trend Score: 83 | |
| YTD Performance: 8.74% | |
| **Trend Scores & Views Are Only For Educational Purposes And Not For Investing | |
| 12Stocks.com: Top Performing Financial Sector Stocks | ||||||||||||||||||||||||||||||||||||||||||||||||
 The top performing Financial sector stocks year to date are
Now, more recently, over last week, the top performing Financial sector stocks on the move are


|
||||||||||||||||||||||||||||||||||||||||||||||||
| 12Stocks.com: Investing in Financial Sector using Exchange Traded Funds | |
|
The following table shows list of key exchange traded funds (ETF) that
help investors track Financial Index. For detailed view, check out our ETF Funds section of our website. Quick View: Move mouse or cursor over ETF symbol (ticker) to view short-term Technical chart and over ETF name to view long term chart. Click on ticker or stock name for detailed view. Click on to add stock symbol to your watchlist and to view watchlist. |
12Stocks.com List of ETFs that track Financial Index
| Ticker | ETF Name | Watchlist | Recent Price | Smart Investing & Trading Score | Change % | Week % | Year-to-date % |
| XLF | Financial | | 40.88 | 83 | 0.16 | 0.16 | 8.74% |
| IAI | Broker-Dealers & Secs | | 113.43 | 83 | 0.37 | 0.37 | 4.51% |
| IYF | Financials | | 92.51 | 83 | 0.37 | 0.37 | 8.31% |
| IYG | Financial Services | | 64.57 | 83 | -0.06 | -0.06 | 8.09% |
| KRE | Regional Banking | | 48.25 | 54 | 0.12 | 0.12 | -7.97% |
| IXG | Global Financials | | 84.47 | 83 | 0.33 | 0.33 | 7.5% |
| VFH | Financials | | 99.23 | 83 | 0.31 | 0.31 | 7.56% |
| KBE | Bank | | 45.40 | 80 | 0.15 | 0.15 | -1.35% |
| FAS | Financial Bull 3X | | 101.08 | 75 | 0.45 | 0.45 | 22.3% |
| FAZ | Financial Bear 3X | | 10.81 | 32 | -0.51 | -0.51 | -20.96% |
| UYG | Financials | | 64.02 | 70 | 0.58 | 0.58 | 15.98% |
| IAT | Regional Banks | | 41.82 | 73 | 0.24 | 0.24 | -0.05% |
| KIE | Insurance | | 48.88 | 58 | 0.73 | 0.73 | 8.1% |
| PSCF | SmallCap Financials | | 46.33 | 47 | -0.06 | -0.06 | -5.79% |
| EUFN | Europe Financials | | 22.45 | 83 | -0.07 | -0.07 | 7.08% |
| PGF | Financial Preferred | | 14.63 | 39 | 0.38 | 0.38 | 0.31% |
| 12Stocks.com: Charts, Trends, Fundamental Data and Performances of Financial Stocks | |
|
We now take in-depth look at all Financial stocks including charts, multi-period performances and overall trends (as measured by Smart Investing & Trading Score). One can sort Financial stocks (click link to choose) by Daily, Weekly and by Year-to-Date performances. Also, one can sort by size of the company or by market capitalization. |
| Select Your Default Chart Type: | |||||
| |||||
| Click on stock symbol or name for detailed view. Click on to add stock symbol to your watchlist and to view watchlist. Quick View: Move mouse or cursor over "Daily" to quickly view daily Technical stock chart and over "Weekly" to view weekly Technical stock chart. | |||||

 | AGNC AGNC Investment Corp. |
| Sector: Financials | |
| SubSector: Mortgage Investment | |
| MarketCap: 6622.19 Millions | |
| Recent Price: 9.27 Smart Investing & Trading Score: 37 | |
| Day Percent Change: -0.64% Day Change: -0.06 | |
| Week Change: -0.64% Year-to-date Change: -5.5% | |
| AGNC Links: Profile News Message Board | |
| Charts:- Daily , Weekly | |
| Add AGNC to Watchlist: View: Get Complete AGNC Trend Analysis ➞ | |
 | COLD Americold Realty Trust |
| Sector: Financials | |
| SubSector: REIT - Industrial | |
| MarketCap: 6569.69 Millions | |
| Recent Price: 22.45 Smart Investing & Trading Score: 35 | |
| Day Percent Change: 0.97% Day Change: 0.21 | |
| Week Change: 0.97% Year-to-date Change: -25.8% | |
| COLD Links: Profile News Message Board | |
| Charts:- Daily , Weekly | |
| Add COLD to Watchlist: View: Get Complete COLD Trend Analysis ➞ | |
 | FNF Fidelity National Financial, Inc. |
| Sector: Financials | |
| SubSector: Surety & Title Insurance | |
| MarketCap: 6532.18 Millions | |
| Recent Price: 50.76 Smart Investing & Trading Score: 88 | |
| Day Percent Change: 0.72% Day Change: 0.37 | |
| Week Change: 0.72% Year-to-date Change: -0.5% | |
| FNF Links: Profile News Message Board | |
| Charts:- Daily , Weekly | |
| Add FNF to Watchlist: View: Get Complete FNF Trend Analysis ➞ | |
 | PAGS PagSeguro Digital Ltd. |
| Sector: Financials | |
| SubSector: Credit Services | |
| MarketCap: 6500.78 Millions | |
| Recent Price: 12.75 Smart Investing & Trading Score: 64 | |
| Day Percent Change: 0.55% Day Change: 0.07 | |
| Week Change: 0.55% Year-to-date Change: 2.3% | |
| PAGS Links: Profile News Message Board | |
| Charts:- Daily , Weekly | |
| Add PAGS to Watchlist: View: Get Complete PAGS Trend Analysis ➞ | |
 | OHI Omega Healthcare Investors, Inc. |
| Sector: Financials | |
| SubSector: REIT - Healthcare Facilities | |
| MarketCap: 6433.84 Millions | |
| Recent Price: 30.88 Smart Investing & Trading Score: 66 | |
| Day Percent Change: -0.68% Day Change: -0.21 | |
| Week Change: -0.68% Year-to-date Change: 0.7% | |
| OHI Links: Profile News Message Board | |
| Charts:- Daily , Weekly | |
| Add OHI to Watchlist: View: Get Complete OHI Trend Analysis ➞ | |
 | KRC Kilroy Realty Corporation |
| Sector: Financials | |
| SubSector: REIT - Office | |
| MarketCap: 6390.46 Millions | |
| Recent Price: 34.07 Smart Investing & Trading Score: 69 | |
| Day Percent Change: 2.81% Day Change: 0.93 | |
| Week Change: 2.81% Year-to-date Change: -14.5% | |
| KRC Links: Profile News Message Board | |
| Charts:- Daily , Weekly | |
| Add KRC to Watchlist: View: Get Complete KRC Trend Analysis ➞ | |
 | SEIC SEI Investments Company |
| Sector: Financials | |
| SubSector: Asset Management | |
| MarketCap: 6367.03 Millions | |
| Recent Price: 66.73 Smart Investing & Trading Score: 51 | |
| Day Percent Change: 0.24% Day Change: 0.16 | |
| Week Change: 0.24% Year-to-date Change: 5.0% | |
| SEIC Links: Profile News Message Board | |
| Charts:- Daily , Weekly | |
| Add SEIC to Watchlist: View: Get Complete SEIC Trend Analysis ➞ | |
 | REG Regency Centers Corporation |
| Sector: Financials | |
| SubSector: REIT - Retail | |
| MarketCap: 6345.84 Millions | |
| Recent Price: 58.47 Smart Investing & Trading Score: 25 | |
| Day Percent Change: 0.33% Day Change: 0.19 | |
| Week Change: 0.33% Year-to-date Change: -12.7% | |
| REG Links: Profile News Message Board | |
| Charts:- Daily , Weekly | |
| Add REG to Watchlist: View: Get Complete REG Trend Analysis ➞ | |
 | VNO Vornado Realty Trust |
| Sector: Financials | |
| SubSector: REIT - Diversified | |
| MarketCap: 6300.63 Millions | |
| Recent Price: 27.04 Smart Investing & Trading Score: 60 | |
| Day Percent Change: 2.97% Day Change: 0.78 | |
| Week Change: 2.97% Year-to-date Change: -4.3% | |
| VNO Links: Profile News Message Board | |
| Charts:- Daily , Weekly | |
| Add VNO to Watchlist: View: Get Complete VNO Trend Analysis ➞ | |
 | CBSH Commerce Bancshares, Inc. |
| Sector: Financials | |
| SubSector: Regional - Midwest Banks | |
| MarketCap: 6201.5 Millions | |
| Recent Price: 55.55 Smart Investing & Trading Score: 83 | |
| Day Percent Change: 0.25% Day Change: 0.14 | |
| Week Change: 0.25% Year-to-date Change: 4.0% | |
| CBSH Links: Profile News Message Board | |
| Charts:- Daily , Weekly | |
| Add CBSH to Watchlist: View: Get Complete CBSH Trend Analysis ➞ | |
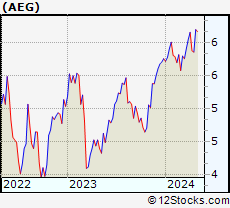 | AEG Aegon N.V. |
| Sector: Financials | |
| SubSector: Life Insurance | |
| MarketCap: 6154.26 Millions | |
| Recent Price: 6.25 Smart Investing & Trading Score: 100 | |
| Day Percent Change: 0.89% Day Change: 0.05 | |
| Week Change: 0.89% Year-to-date Change: 8.6% | |
| AEG Links: Profile News Message Board | |
| Charts:- Daily , Weekly | |
| Add AEG to Watchlist: View: Get Complete AEG Trend Analysis ➞ | |
 | RNR RenaissanceRe Holdings Ltd. |
| Sector: Financials | |
| SubSector: Property & Casualty Insurance | |
| MarketCap: 6153.32 Millions | |
| Recent Price: 221.32 Smart Investing & Trading Score: 47 | |
| Day Percent Change: 1.02% Day Change: 2.24 | |
| Week Change: 1.02% Year-to-date Change: 12.9% | |
| RNR Links: Profile News Message Board | |
| Charts:- Daily , Weekly | |
| Add RNR to Watchlist: View: Get Complete RNR Trend Analysis ➞ | |
 | AMH American Homes 4 Rent |
| Sector: Financials | |
| SubSector: REIT - Residential | |
| MarketCap: 6135.31 Millions | |
| Recent Price: 36.28 Smart Investing & Trading Score: 100 | |
| Day Percent Change: -0.36% Day Change: -0.13 | |
| Week Change: -0.36% Year-to-date Change: 0.9% | |
| AMH Links: Profile News Message Board | |
| Charts:- Daily , Weekly | |
| Add AMH to Watchlist: View: Get Complete AMH Trend Analysis ➞ | |
 | AIZ Assurant, Inc. |
| Sector: Financials | |
| SubSector: Accident & Health Insurance | |
| MarketCap: 6110.3 Millions | |
| Recent Price: 174.71 Smart Investing & Trading Score: 58 | |
| Day Percent Change: 1.06% Day Change: 1.83 | |
| Week Change: 1.06% Year-to-date Change: 3.7% | |
| AIZ Links: Profile News Message Board | |
| Charts:- Daily , Weekly | |
| Add AIZ to Watchlist: View: Get Complete AIZ Trend Analysis ➞ | |
 | FRT Federal Realty Investment Trust |
| Sector: Financials | |
| SubSector: REIT - Retail | |
| MarketCap: 5878.64 Millions | |
| Recent Price: 102.89 Smart Investing & Trading Score: 88 | |
| Day Percent Change: 0.68% Day Change: 0.70 | |
| Week Change: 0.68% Year-to-date Change: -0.2% | |
| FRT Links: Profile News Message Board | |
| Charts:- Daily , Weekly | |
| Add FRT to Watchlist: View: Get Complete FRT Trend Analysis ➞ | |
 | ARES Ares Management Corporation |
| Sector: Financials | |
| SubSector: Asset Management | |
| MarketCap: 5826.23 Millions | |
| Recent Price: 133.57 Smart Investing & Trading Score: 55 | |
| Day Percent Change: -0.04% Day Change: -0.05 | |
| Week Change: -0.04% Year-to-date Change: 12.3% | |
| ARES Links: Profile News Message Board | |
| Charts:- Daily , Weekly | |
| Add ARES to Watchlist: View: Get Complete ARES Trend Analysis ➞ | |
 | EQH Equitable Holdings, Inc. |
| Sector: Financials | |
| SubSector: Insurance Brokers | |
| MarketCap: 5520.07 Millions | |
| Recent Price: 37.23 Smart Investing & Trading Score: 75 | |
| Day Percent Change: 0.94% Day Change: 0.34 | |
| Week Change: 0.94% Year-to-date Change: 11.8% | |
| EQH Links: Profile News Message Board | |
| Charts:- Daily , Weekly | |
| Add EQH to Watchlist: View: Get Complete EQH Trend Analysis ➞ | |
 | NNN National Retail Properties, Inc. |
| Sector: Financials | |
| SubSector: REIT - Diversified | |
| MarketCap: 5459.93 Millions | |
| Recent Price: 40.37 Smart Investing & Trading Score: 20 | |
| Day Percent Change: -0.96% Day Change: -0.39 | |
| Week Change: -0.96% Year-to-date Change: -6.3% | |
| NNN Links: Profile News Message Board | |
| Charts:- Daily , Weekly | |
| Add NNN to Watchlist: View: Get Complete NNN Trend Analysis ➞ | |
 | KIM Kimco Realty Corporation |
| Sector: Financials | |
| SubSector: REIT - Retail | |
| MarketCap: 5358.64 Millions | |
| Recent Price: 18.67 Smart Investing & Trading Score: 64 | |
| Day Percent Change: 1.58% Day Change: 0.29 | |
| Week Change: 1.58% Year-to-date Change: -12.4% | |
| KIM Links: Profile News Message Board | |
| Charts:- Daily , Weekly | |
| Add KIM to Watchlist: View: Get Complete KIM Trend Analysis ➞ | |
 | AFG American Financial Group, Inc. |
| Sector: Financials | |
| SubSector: Property & Casualty Insurance | |
| MarketCap: 5353.82 Millions | |
| Recent Price: 128.06 Smart Investing & Trading Score: 68 | |
| Day Percent Change: 0.57% Day Change: 0.72 | |
| Week Change: 0.57% Year-to-date Change: 7.7% | |
| AFG Links: Profile News Message Board | |
| Charts:- Daily , Weekly | |
| Add AFG to Watchlist: View: Get Complete AFG Trend Analysis ➞ | |
 | JLL Jones Lang LaSalle Incorporated |
| Sector: Financials | |
| SubSector: Property Management | |
| MarketCap: 5259.32 Millions | |
| Recent Price: 183.85 Smart Investing & Trading Score: 85 | |
| Day Percent Change: 0.74% Day Change: 1.34 | |
| Week Change: 0.74% Year-to-date Change: -2.7% | |
| JLL Links: Profile News Message Board | |
| Charts:- Daily , Weekly | |
| Add JLL to Watchlist: View: Get Complete JLL Trend Analysis ➞ | |
 | CACC Credit Acceptance Corporation |
| Sector: Financials | |
| SubSector: Credit Services | |
| MarketCap: 5219.28 Millions | |
| Recent Price: 531.19 Smart Investing & Trading Score: 32 | |
| Day Percent Change: 0.87% Day Change: 4.59 | |
| Week Change: 0.87% Year-to-date Change: -0.3% | |
| CACC Links: Profile News Message Board | |
| Charts:- Daily , Weekly | |
| Add CACC to Watchlist: View: Get Complete CACC Trend Analysis ➞ | |
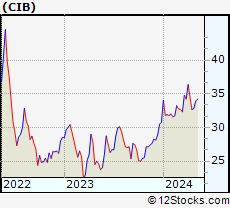 | CIB Bancolombia S.A. |
| Sector: Financials | |
| SubSector: Foreign Regional Banks | |
| MarketCap: 5031.99 Millions | |
| Recent Price: 33.35 Smart Investing & Trading Score: 70 | |
| Day Percent Change: 1.61% Day Change: 0.53 | |
| Week Change: 1.61% Year-to-date Change: 8.4% | |
| CIB Links: Profile News Message Board | |
| Charts:- Daily , Weekly | |
| Add CIB to Watchlist: View: Get Complete CIB Trend Analysis ➞ | |
 | GLPI Gaming and Leisure Properties, Inc. |
| Sector: Financials | |
| SubSector: REIT - Diversified | |
| MarketCap: 4922.33 Millions | |
| Recent Price: 43.02 Smart Investing & Trading Score: 35 | |
| Day Percent Change: 1.31% Day Change: 0.55 | |
| Week Change: 1.31% Year-to-date Change: -12.8% | |
| GLPI Links: Profile News Message Board | |
| Charts:- Daily , Weekly | |
| Add GLPI to Watchlist: View: Get Complete GLPI Trend Analysis ➞ | |
 | DEI Douglas Emmett, Inc. |
| Sector: Financials | |
| SubSector: REIT - Diversified | |
| MarketCap: 4917.83 Millions | |
| Recent Price: 13.66 Smart Investing & Trading Score: 93 | |
| Day Percent Change: 2.21% Day Change: 0.29 | |
| Week Change: 2.21% Year-to-date Change: -5.8% | |
| DEI Links: Profile News Message Board | |
| Charts:- Daily , Weekly | |
| Add DEI to Watchlist: View: Get Complete DEI Trend Analysis ➞ | |
| For tabular summary view of above stock list: Summary View ➞ 0 - 25 , 25 - 50 , 50 - 75 , 75 - 100 , 100 - 125 , 125 - 150 , 150 - 175 , 175 - 200 , 200 - 225 , 225 - 250 , 250 - 275 , 275 - 300 , 300 - 325 , 325 - 350 , 350 - 375 , 375 - 400 , 400 - 425 , 425 - 450 , 450 - 475 , 475 - 500 , 500 - 525 , 525 - 550 , 550 - 575 , 575 - 600 , 600 - 625 , 625 - 650 , 650 - 675 , 675 - 700 , 700 - 725 , 725 - 750 , 750 - 775 , 775 - 800 , 800 - 825 , 825 - 850 , 850 - 875 , 875 - 900 , 900 - 925 , 925 - 950 , 950 - 975 , 975 - 1000 , 1000 - 1025 , 1025 - 1050 , 1050 - 1075 , 1075 - 1100 , 1100 - 1125 , 1125 - 1150 , 1150 - 1175 | ||
| Click To Change The Sort Order: By Market Cap or Company Size Performance: Year-to-date, Week and Day | |
| Select Chart Type: | ||
|
Best Stocks Today 12Stocks.com |
© 2024 12Stocks.com Terms & Conditions Privacy Contact Us
All Information Provided Only For Education And Not To Be Used For Investing or Trading. See Terms & Conditions


One More Thing ... Get Best Stocks Delivered Daily!
Never Ever Miss A Move With Our Top Ten Stocks Lists
Find Best Stocks In Any Market - Bull or Bear Market
Take A Peek At Our Top Ten Stocks Lists: Daily, Weekly, Year-to-Date & Top Trends
Find Best Stocks In Any Market - Bull or Bear Market
Take A Peek At Our Top Ten Stocks Lists: Daily, Weekly, Year-to-Date & Top Trends
Financial Stocks With Best Up Trends [0-bearish to 100-bullish]: Heartland [100], Fulton [100], B. Riley[100], ICICI Bank[100], Lazard [100], LPL [100], Highwoods Properties[100], Byline Bancorp[100], Cousins Properties[100], Associated Banc-Corp[100], PayPal [100]
Best Financial Stocks Year-to-Date:
Root [531.23%], Hippo [142.48%], Gladstone Capital[102.06%], Banco Macro[83%], B. Riley[82.92%], Grupo Financiero[81.93%], Banco BBVA[71.88%], Yiren Digital[63.62%], EverQuote [58.91%], Heritage Insurance[54.83%], Lufax Holding[51.79%] Best Financial Stocks This Week:
Heartland [19.15%], Fulton [9.96%], Territorial Bancorp[7.5%], Citizens [5.77%], Cartica Acquisition[4.84%], Hudson Pacific[4.81%], KE [4.42%], B. Riley[4.28%], Medical Properties[4.21%], NexGen Energy[4.08%], ICICI Bank[3.92%] Best Financial Stocks Daily:
Heartland [19.15%], Fulton [9.96%], Territorial Bancorp[7.50%], Citizens [5.77%], Cartica Acquisition[4.84%], Hudson Pacific[4.81%], KE [4.42%], B. Riley[4.28%], Medical Properties[4.21%], NexGen Energy[4.08%], ICICI Bank[3.92%]