
 Login Sign Up


| |||||
 |  | ||||

| 12Stocks.com Market Intelligence |
Best Financial Stocks
| In a hurry? Financial Stocks Lists: Performance Trends Table, Stock Charts
Sort Financial stocks: Daily, Weekly, Year-to-Date, Market Cap & Trends. Filter Financial stocks list by size:All Financial Large Mid-Range Small & MicroCap |
| 12Stocks.com Financial Stocks Performances & Trends Daily | |||||||||
|
|  The overall Smart Investing & Trading Score is 33 (0-bearish to 100-bullish) which puts Financial sector in short term bearish to neutral trend. The Smart Investing & Trading Score from previous trading session is 26 and an improvement of trend continues.
| ||||||||
Here are the Smart Investing & Trading Scores of the most requested Financial stocks at 12Stocks.com (click stock name for detailed review):
|


| 12Stocks.com: Investing in Financial sector with Stocks | |
|
The following table helps investors and traders sort through current performance and trends (as measured by Smart Investing & Trading Score) of various
stocks in the Financial sector. Quick View: Move mouse or cursor over stock symbol (ticker) to view short-term Technical chart and over stock name to view long term chart. Click on  to add stock symbol to your watchlist and to add stock symbol to your watchlist and  to view watchlist. Click on any ticker or stock name for detailed market intelligence report for that stock. to view watchlist. Click on any ticker or stock name for detailed market intelligence report for that stock. |
12Stocks.com Performance of Stocks in Financial Sector
| Ticker | Stock Name | Watchlist | Category | Recent Price | Trend Score | Change % | YTD Change% |
| IVZ | Invesco |   | Asset Mgmt | 21.17 | 85 | 0.81% | 22.47% |
| ARES | Ares Management | | Asset Mgmt | 187.98 | 85 | -0.30% | 7.02% |
| NTST | NetSTREIT | | REIT Retail | 18.59 | 85 | -0.85% | 33.24% |
| SVC | Service Properties | | REIT | 2.75 | 83 | 4.75% | 9.46% |
| JOE | St. Joe | | Real Estatet | 51.00 | 83 | 1.33% | 13.85% |
| TCI | Transcontinental Realty | | REIT - | 42.00 | 83 | 0.91% | 40.89% |
| TRC | Tejon Ranch | | Property Mgmt | 18.36 | 83 | 0.66% | 15.47% |
| PKST | Peakstone Realty | | REIT - | 13.92 | 83 | 0.51% | 28.06% |
| APAM | Artisan Partners | | Asset Mgmt | 46.72 | 83 | 0.26% | 11.91% |
| ESSA | ESSA Bancorp | | S&L | 640.00 | 83 | 0.00% | NA |
| AMG | Affiliated Managers | | Asset Mgmt | 212.65 | 83 | -0.87% | 15.00% |
| CIO | City Office | | REIT - Office | 6.98 | 83 | 0.43% | 31.92% |
| CBRE | CBRE | | Property Mgmt | 156.47 | 83 | 0.28% | 19.18% |
| GL | Globe Life | | Life Insurance | 139.51 | 83 | 0.12% | 25.62% |
| AIV | Apartment | | REIT | 8.68 | 81 | 2.48% | 2.31% |
| NKSH | National Bankshares | | Regional Banks | 28.54 | 81 | 2.40% | -0.59% |
| ARE | Alexandria Real | | REIT - Office | 78.14 | 81 | 1.32% | -18.78% |
| TROW | T. Rowe | | Asset Mgmt | 105.65 | 81 | -0.27% | -5.27% |
| VCTR | Victory Capital | | Asset Mgmt | 69.24 | 80 | 0.45% | 6.50% |
| LTC | LTC Properties | | REIT | 35.15 | 80 | 1.18% | 3.98% |
| ERIE | Erie Indemnity | | Insurance | 356.82 | 80 | 0.17% | -12.85% |
| BHB | Bar Harbor | | Regional Banks | 30.36 | 78 | 4.69% | 0.18% |
| EGP | East Properties | | REIT - Industrial | 164.25 | 78 | 0.40% | 3.16% |
| O | Realty ome | | REIT - Retail | 57.20 | 78 | -0.44% | 9.17% |
| ORC | Orchid Island | | Mortgage | 7.12 | 78 | -0.70% | -4.30% |
| For chart view version of above stock list: Chart View ➞ 0 - 25 , 25 - 50 , 50 - 75 , 75 - 100 , 100 - 125 , 125 - 150 , 150 - 175 , 175 - 200 , 200 - 225 , 225 - 250 , 250 - 275 , 275 - 300 , 300 - 325 , 325 - 350 , 350 - 375 , 375 - 400 , 400 - 425 , 425 - 450 , 450 - 475 , 475 - 500 , 500 - 525 , 525 - 550 , 550 - 575 | ||
 | Click To Change The Sort Order: By Market Cap or Company Size Performance: Year-to-date, Week and Day |  |
|
Get the most comprehensive stock market coverage daily at 12Stocks.com ➞ Best Stocks Today ➞ Best Stocks Weekly ➞ Best Stocks Year-to-Date ➞ Best Stocks Trends ➞  Best Stocks Today 12Stocks.com Best Nasdaq Stocks ➞ Best S&P 500 Stocks ➞ Best Tech Stocks ➞ Best Biotech Stocks ➞ |
| Detailed Overview of Financial Stocks |
| Financial Technical Overview, Leaders & Laggards, Top Financial ETF Funds & Detailed Financial Stocks List, Charts, Trends & More |
| Financial Sector: Technical Analysis, Trends & YTD Performance | |
| Financial sector is composed of stocks
from banks, brokers, insurance, REITs
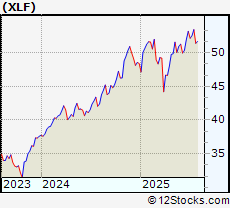
and services subsectors. Financial sector, as represented by XLF, an exchange-traded fund [ETF] that holds basket of Financial stocks (e.g, Bank of America, Goldman Sachs) is up by 7.36% and is currently outperforming the overall market by 0.31% year-to-date. Below is a quick view of Technical charts and trends: |
|
 XLF Weekly Chart |
|
| Long Term Trend: Good | |
| Medium Term Trend: Not Good | |
 XLF Daily Chart |
|
| Short Term Trend: Not Good | |
| Overall Trend Score: 33 | |
| YTD Performance: 7.36% | |
| **Trend Scores & Views Are Only For Educational Purposes And Not For Investing | |
| 12Stocks.com: Top Performing Financial Sector Stocks | ||||||||||||||||||||||||||||||||||||||||||||||||
 The top performing Financial sector stocks year to date are
Now, more recently, over last week, the top performing Financial sector stocks on the move are


|
||||||||||||||||||||||||||||||||||||||||||||||||
| 12Stocks.com: Investing in Financial Sector using Exchange Traded Funds | |
|
The following table shows list of key exchange traded funds (ETF) that
help investors track Financial Index. For detailed view, check out our ETF Funds section of our website. Quick View: Move mouse or cursor over ETF symbol (ticker) to view short-term Technical chart and over ETF name to view long term chart. Click on ticker or stock name for detailed view. Click on to add stock symbol to your watchlist and to view watchlist. |
12Stocks.com List of ETFs that track Financial Index
| Ticker | ETF Name | Watchlist | Recent Price | Smart Investing & Trading Score | Change % | Week % | Year-to-date % |
| XLF | Financial | | 51.70 | 33 | -0.4 | 0.58 | 7.36% |
| IAI | Broker-Dealers & Secs | | 173.45 | 53 | -0.87 | 1.45 | 20.77% |
| KBE | Bank | | 56.27 | 51 | 0.52 | 1.83 | 2.16% |
| FAS | Financial Bull 3X | | 159.77 | 33 | -1.27 | 1.61 | 6.12% |
| FAZ | Financial Bear 3X | | 4.60 | 62 | 1.32 | -1.5 | -26.44% |
| UYG | Financials | | 92.14 | 26 | -0.79 | 0.92 | 8.14% |
| KIE | Insurance | | 56.82 | 35 | 0.71 | 1.99 | 1.03% |
| 12Stocks.com: Charts, Trends, Fundamental Data and Performances of Financial Stocks | |
|
We now take in-depth look at all Financial stocks including charts, multi-period performances and overall trends (as measured by Smart Investing & Trading Score). One can sort Financial stocks (click link to choose) by Daily, Weekly and by Year-to-Date performances. Also, one can sort by size of the company or by market capitalization. |
| Select Your Default Chart Type: | |||||
| |||||
| Click on stock symbol or name for detailed view. Click on to add stock symbol to your watchlist and to view watchlist. Quick View: Move mouse or cursor over "Daily" to quickly view daily Technical stock chart and over "Weekly" to view weekly Technical stock chart. | |||||

 | IVZ Invesco Ltd. |
| Sector: Financials | |
| SubSector: Asset Management | |
| MarketCap: 4578.23 Millions | |
| Recent Price: 21.17 Smart Investing & Trading Score: 85 | |
| Day Percent Change: 0.81% Day Change: 0.17 | |
| Week Change: 2.72% Year-to-date Change: 22.5% | |
| IVZ Links: Profile News Message Board | |
| Charts:- Daily , Weekly | |
| Add IVZ to Watchlist: View: Get Complete IVZ Trend Analysis ➞ | |
 | ARES Ares Management Corporation |
| Sector: Financials | |
| SubSector: Asset Management | |
| MarketCap: 5826.23 Millions | |
| Recent Price: 187.98 Smart Investing & Trading Score: 85 | |
| Day Percent Change: -0.3% Day Change: -0.57 | |
| Week Change: 2.82% Year-to-date Change: 7.0% | |
| ARES Links: Profile News Message Board | |
| Charts:- Daily , Weekly | |
| Add ARES to Watchlist: View: Get Complete ARES Trend Analysis ➞ | |
 | NTST NetSTREIT Corp. |
| Sector: Financials | |
| SubSector: REIT Retail | |
| MarketCap: 51267 Millions | |
| Recent Price: 18.59 Smart Investing & Trading Score: 85 | |
| Day Percent Change: -0.85% Day Change: -0.16 | |
| Week Change: 1.53% Year-to-date Change: 33.2% | |
| NTST Links: Profile News Message Board | |
| Charts:- Daily , Weekly | |
| Add NTST to Watchlist: View: Get Complete NTST Trend Analysis ➞ | |
 | SVC Service Properties Trust |
| Sector: Financials | |
| SubSector: REIT - Hotel/Motel | |
| MarketCap: 1067.74 Millions | |
| Recent Price: 2.75 Smart Investing & Trading Score: 83 | |
| Day Percent Change: 4.75% Day Change: 0.13 | |
| Week Change: 6.37% Year-to-date Change: 9.5% | |
| SVC Links: Profile News Message Board | |
| Charts:- Daily , Weekly | |
| Add SVC to Watchlist: View: Get Complete SVC Trend Analysis ➞ | |
 | JOE The St. Joe Company |
| Sector: Financials | |
| SubSector: Real Estate Development | |
| MarketCap: 1029.39 Millions | |
| Recent Price: 51.00 Smart Investing & Trading Score: 83 | |
| Day Percent Change: 1.33% Day Change: 0.67 | |
| Week Change: 2.29% Year-to-date Change: 13.9% | |
| JOE Links: Profile News Message Board | |
| Charts:- Daily , Weekly | |
| Add JOE to Watchlist: View: Get Complete JOE Trend Analysis ➞ | |
 | TCI Transcontinental Realty Investors, Inc. |
| Sector: Financials | |
| SubSector: REIT - Diversified | |
| MarketCap: 158.653 Millions | |
| Recent Price: 42.00 Smart Investing & Trading Score: 83 | |
| Day Percent Change: 0.91% Day Change: 0.38 | |
| Week Change: 5.58% Year-to-date Change: 40.9% | |
| TCI Links: Profile News Message Board | |
| Charts:- Daily , Weekly | |
| Add TCI to Watchlist: View: Get Complete TCI Trend Analysis ➞ | |
 | TRC Tejon Ranch Co. |
| Sector: Financials | |
| SubSector: Property Management | |
| MarketCap: 346.442 Millions | |
| Recent Price: 18.36 Smart Investing & Trading Score: 83 | |
| Day Percent Change: 0.66% Day Change: 0.12 | |
| Week Change: 2.68% Year-to-date Change: 15.5% | |
| TRC Links: Profile News Message Board | |
| Charts:- Daily , Weekly | |
| Add TRC to Watchlist: View: Get Complete TRC Trend Analysis ➞ | |
 | PKST Peakstone Realty Trust |
| Sector: Financials | |
| SubSector: REIT - Diversified | |
| MarketCap: 1050 Millions | |
| Recent Price: 13.92 Smart Investing & Trading Score: 83 | |
| Day Percent Change: 0.51% Day Change: 0.07 | |
| Week Change: 2.05% Year-to-date Change: 28.1% | |
| PKST Links: Profile News Message Board | |
| Charts:- Daily , Weekly | |
| Add PKST to Watchlist: View: Get Complete PKST Trend Analysis ➞ | |
 | APAM Artisan Partners Asset Management Inc. |
| Sector: Financials | |
| SubSector: Asset Management | |
| MarketCap: 1688.33 Millions | |
| Recent Price: 46.72 Smart Investing & Trading Score: 83 | |
| Day Percent Change: 0.26% Day Change: 0.12 | |
| Week Change: 4.19% Year-to-date Change: 11.9% | |
| APAM Links: Profile News Message Board | |
| Charts:- Daily , Weekly | |
| Add APAM to Watchlist: View: Get Complete APAM Trend Analysis ➞ | |
 | ESSA ESSA Bancorp, Inc. |
| Sector: Financials | |
| SubSector: Savings & Loans | |
| MarketCap: 171.33 Millions | |
| Recent Price: 640.00 Smart Investing & Trading Score: 83 | |
| Day Percent Change: 0% Day Change: 0 | |
| Week Change: 0.79% Year-to-date Change: 3,207.8% | |
| ESSA Links: Profile News Message Board | |
| Charts:- Daily , Weekly | |
| Add ESSA to Watchlist: View: Get Complete ESSA Trend Analysis ➞ | |
 | AMG Affiliated Managers Group, Inc. |
| Sector: Financials | |
| SubSector: Asset Management | |
| MarketCap: 2849.63 Millions | |
| Recent Price: 212.65 Smart Investing & Trading Score: 83 | |
| Day Percent Change: -0.87% Day Change: -1.87 | |
| Week Change: 2.7% Year-to-date Change: 15.0% | |
| AMG Links: Profile News Message Board | |
| Charts:- Daily , Weekly | |
| Add AMG to Watchlist: View: Get Complete AMG Trend Analysis ➞ | |
 | CIO City Office REIT, Inc. |
| Sector: Financials | |
| SubSector: REIT - Office | |
| MarketCap: 478.566 Millions | |
| Recent Price: 6.98 Smart Investing & Trading Score: 83 | |
| Day Percent Change: 0.43% Day Change: 0.03 | |
| Week Change: 0.72% Year-to-date Change: 31.9% | |
| CIO Links: Profile News Message Board | |
| Charts:- Daily , Weekly | |
| Add CIO to Watchlist: View: Get Complete CIO Trend Analysis ➞ | |
 | CBRE CBRE Group, Inc. |
| Sector: Financials | |
| SubSector: Property Management | |
| MarketCap: 12799.2 Millions | |
| Recent Price: 156.47 Smart Investing & Trading Score: 83 | |
| Day Percent Change: 0.28% Day Change: 0.44 | |
| Week Change: 1.64% Year-to-date Change: 19.2% | |
| CBRE Links: Profile News Message Board | |
| Charts:- Daily , Weekly | |
| Add CBRE to Watchlist: View: Get Complete CBRE Trend Analysis ➞ | |
 | GL Globe Life Inc. |
| Sector: Financials | |
| SubSector: Life Insurance | |
| MarketCap: 7596.46 Millions | |
| Recent Price: 139.51 Smart Investing & Trading Score: 83 | |
| Day Percent Change: 0.12% Day Change: 0.17 | |
| Week Change: 1.65% Year-to-date Change: 25.6% | |
| GL Links: Profile News Message Board | |
| Charts:- Daily , Weekly | |
| Add GL to Watchlist: View: Get Complete GL Trend Analysis ➞ | |
 | AIV Apartment Investment and Management Company |
| Sector: Financials | |
| SubSector: REIT - Residential | |
| MarketCap: 4485.11 Millions | |
| Recent Price: 8.68 Smart Investing & Trading Score: 81 | |
| Day Percent Change: 2.48% Day Change: 0.21 | |
| Week Change: 3.46% Year-to-date Change: 2.3% | |
| AIV Links: Profile News Message Board | |
| Charts:- Daily , Weekly | |
| Add AIV to Watchlist: View: Get Complete AIV Trend Analysis ➞ | |
 | NKSH National Bankshares, Inc. |
| Sector: Financials | |
| SubSector: Regional - Mid-Atlantic Banks | |
| MarketCap: 209.759 Millions | |
| Recent Price: 28.54 Smart Investing & Trading Score: 81 | |
| Day Percent Change: 2.4% Day Change: 0.67 | |
| Week Change: 5.27% Year-to-date Change: -0.6% | |
| NKSH Links: Profile News Message Board | |
| Charts:- Daily , Weekly | |
| Add NKSH to Watchlist: View: Get Complete NKSH Trend Analysis ➞ | |
 | ARE Alexandria Real Estate Equities, Inc. |
| Sector: Financials | |
| SubSector: REIT - Office | |
| MarketCap: 16793.6 Millions | |
| Recent Price: 78.14 Smart Investing & Trading Score: 81 | |
| Day Percent Change: 1.32% Day Change: 1.02 | |
| Week Change: 2.8% Year-to-date Change: -18.8% | |
| ARE Links: Profile News Message Board | |
| Charts:- Daily , Weekly | |
| Add ARE to Watchlist: View: Get Complete ARE Trend Analysis ➞ | |
 | TROW T. Rowe Price Group, Inc. |
| Sector: Financials | |
| SubSector: Asset Management | |
| MarketCap: 24530 Millions | |
| Recent Price: 105.65 Smart Investing & Trading Score: 81 | |
| Day Percent Change: -0.27% Day Change: -0.29 | |
| Week Change: 2.51% Year-to-date Change: -5.3% | |
| TROW Links: Profile News Message Board | |
| Charts:- Daily , Weekly | |
| Add TROW to Watchlist: View: Get Complete TROW Trend Analysis ➞ | |
 | VCTR Victory Capital Holdings, Inc. |
| Sector: Financials | |
| SubSector: Asset Management | |
| MarketCap: 1148.33 Millions | |
| Recent Price: 69.24 Smart Investing & Trading Score: 80 | |
| Day Percent Change: 0.45% Day Change: 0.31 | |
| Week Change: 3.65% Year-to-date Change: 6.5% | |
| VCTR Links: Profile News Message Board | |
| Charts:- Daily , Weekly | |
| Add VCTR to Watchlist: View: Get Complete VCTR Trend Analysis ➞ | |
 | LTC LTC Properties, Inc. |
| Sector: Financials | |
| SubSector: REIT - Healthcare Facilities | |
| MarketCap: 1369.24 Millions | |
| Recent Price: 35.15 Smart Investing & Trading Score: 80 | |
| Day Percent Change: 1.18% Day Change: 0.41 | |
| Week Change: 2.51% Year-to-date Change: 4.0% | |
| LTC Links: Profile News Message Board | |
| Charts:- Daily , Weekly | |
| Add LTC to Watchlist: View: Get Complete LTC Trend Analysis ➞ | |
 | ERIE Erie Indemnity Company |
| Sector: Financials | |
| SubSector: Insurance Brokers | |
| MarketCap: 8822 Millions | |
| Recent Price: 356.82 Smart Investing & Trading Score: 80 | |
| Day Percent Change: 0.17% Day Change: 0.61 | |
| Week Change: 1.73% Year-to-date Change: -12.9% | |
| ERIE Links: Profile News Message Board | |
| Charts:- Daily , Weekly | |
| Add ERIE to Watchlist: View: Get Complete ERIE Trend Analysis ➞ | |
 | BHB Bar Harbor Bankshares |
| Sector: Financials | |
| SubSector: Regional - Northeast Banks | |
| MarketCap: 298.099 Millions | |
| Recent Price: 30.36 Smart Investing & Trading Score: 78 | |
| Day Percent Change: 4.69% Day Change: 1.36 | |
| Week Change: 6.01% Year-to-date Change: 0.2% | |
| BHB Links: Profile News Message Board | |
| Charts:- Daily , Weekly | |
| Add BHB to Watchlist: View: Get Complete BHB Trend Analysis ➞ | |
 | EGP EastGroup Properties, Inc. |
| Sector: Financials | |
| SubSector: REIT - Industrial | |
| MarketCap: 4034.29 Millions | |
| Recent Price: 164.25 Smart Investing & Trading Score: 78 | |
| Day Percent Change: 0.4% Day Change: 0.65 | |
| Week Change: 1.41% Year-to-date Change: 3.2% | |
| EGP Links: Profile News Message Board | |
| Charts:- Daily , Weekly | |
| Add EGP to Watchlist: View: Get Complete EGP Trend Analysis ➞ | |
 | O Realty Income Corporation |
| Sector: Financials | |
| SubSector: REIT - Retail | |
| MarketCap: 17647.4 Millions | |
| Recent Price: 57.20 Smart Investing & Trading Score: 78 | |
| Day Percent Change: -0.44% Day Change: -0.25 | |
| Week Change: 1.11% Year-to-date Change: 9.2% | |
| O Links: Profile News Message Board | |
| Charts:- Daily , Weekly | |
| Add O to Watchlist: View: Get Complete O Trend Analysis ➞ | |
 | ORC Orchid Island Capital, Inc. |
| Sector: Financials | |
| SubSector: Mortgage Investment | |
| MarketCap: 212.339 Millions | |
| Recent Price: 7.12 Smart Investing & Trading Score: 78 | |
| Day Percent Change: -0.7% Day Change: -0.05 | |
| Week Change: 1.28% Year-to-date Change: -4.3% | |
| ORC Links: Profile News Message Board | |
| Charts:- Daily , Weekly | |
| Add ORC to Watchlist: View: Get Complete ORC Trend Analysis ➞ | |
| For tabular summary view of above stock list: Summary View ➞ 0 - 25 , 25 - 50 , 50 - 75 , 75 - 100 , 100 - 125 , 125 - 150 , 150 - 175 , 175 - 200 , 200 - 225 , 225 - 250 , 250 - 275 , 275 - 300 , 300 - 325 , 325 - 350 , 350 - 375 , 375 - 400 , 400 - 425 , 425 - 450 , 450 - 475 , 475 - 500 , 500 - 525 , 525 - 550 , 550 - 575 | ||
| Click To Change The Sort Order: By Market Cap or Company Size Performance: Year-to-date, Week and Day | |
| Select Chart Type: | ||
|
Best Stocks Today 12Stocks.com |
© 2025 12Stocks.com Terms & Conditions Privacy Contact Us
All Information Provided Only For Education And Not To Be Used For Investing or Trading. See Terms & Conditions


One More Thing ... Get Best Stocks Delivered Daily!
Never Ever Miss A Move With Our Top Ten Stocks Lists
Find Best Stocks In Any Market - Bull or Bear Market
Take A Peek At Our Top Ten Stocks Lists: Daily, Weekly, Year-to-Date & Top Trends
Find Best Stocks In Any Market - Bull or Bear Market
Take A Peek At Our Top Ten Stocks Lists: Daily, Weekly, Year-to-Date & Top Trends
Financial Stocks With Best Up Trends [0-bearish to 100-bullish]: Lemonade [100], MBIA [100], AlTi Global[100], Cushman & Wakefield[100], LGI Homes[100], Rocket [100], Tanger Factory[100], Mr. Cooper[100], CBL & Associates Properties[100], Hamilton Lane[100], Simon Property[100]
Best Financial Stocks Year-to-Date:
ESSA Bancorp[3207.77%], Easterly Government[107.23%], Mr. Cooper[97.21%], Heritage Insurance[79.01%], Root [72.94%], Industrial Logistics[70.13%], Rocket [69.21%], Diversified Healthcare[50.49%], ProAssurance [49.72%], World Acceptance[41.78%], XP [41.43%] Best Financial Stocks This Week:
Uniti [47.66%], Lemonade [31.68%], AlTi Global[24.1%], MBIA [20.54%], Industrial Logistics[14.9%], Cushman & Wakefield[12.24%], Tanger Factory[9.38%], Hippo [9.07%], Rocket [9.01%], LGI Homes[8.92%], eXp World[8.81%] Best Financial Stocks Daily:
Lemonade [29.54%], MBIA [22.5%], AlTi Global[18.05%], Cushman & Wakefield[8.69%], LGI Homes[8.6%], Rocket [6.81%], Alexander s[6.14%], Tanger Factory[5.97%], Brookfield Business[5.91%], Mr. Cooper[5.69%], B. Riley[5.38%]