
 Login Sign Up


| |||||
 |  | ||||

| 12Stocks.com Market Intelligence |
Best Financial Stocks
| In a hurry? Financial Stocks Lists: Performance Trends Table, Stock Charts
Sort Financial stocks: Daily, Weekly, Year-to-Date, Market Cap & Trends. Filter Financial stocks list by size:All Financial Large Mid-Range Small & MicroCap |
| 12Stocks.com Financial Stocks Performances & Trends Daily | |||||||||
|
|  The overall Smart Investing & Trading Score is 33 (0-bearish to 100-bullish) which puts Financial sector in short term bearish to neutral trend. The Smart Investing & Trading Score from previous trading session is 26 and an improvement of trend continues.
| ||||||||
Here are the Smart Investing & Trading Scores of the most requested Financial stocks at 12Stocks.com (click stock name for detailed review):
|


| 12Stocks.com: Investing in Financial sector with Stocks | |
|
The following table helps investors and traders sort through current performance and trends (as measured by Smart Investing & Trading Score) of various
stocks in the Financial sector. Quick View: Move mouse or cursor over stock symbol (ticker) to view short-term Technical chart and over stock name to view long term chart. Click on  to add stock symbol to your watchlist and to add stock symbol to your watchlist and  to view watchlist. Click on any ticker or stock name for detailed market intelligence report for that stock. to view watchlist. Click on any ticker or stock name for detailed market intelligence report for that stock. |
12Stocks.com Performance of Stocks in Financial Sector
| Ticker | Stock Name | Watchlist | Category | Recent Price | Trend Score | Change % | YTD Change% |
| EQR | Equity Residential |   | REIT | 63.41 | 25 | 1.18% | -9.92% |
| INVH | Invitation Homes | | Real Estatet | 30.46 | 25 | 0.89% | -3.91% |
| CBU | Community Bank | | Regional Banks | 52.86 | 25 | 0.88% | -13.59% |
| BFS | Saul Centers | | REIT - Retail | 32.26 | 25 | 0.81% | -14.00% |
| USCB | USCB | | Banks - Regional | 16.52 | 25 | 0.73% | -6.44% |
| AGM | Federal Agricultural | | Credit Services | 172.96 | 25 | 0.52% | -11.49% |
| CBNK | Capital Bancorp | | S&L | 31.37 | 25 | 0.48% | 10.41% |
| WASH | Washington Trust | | Regional Banks | 27.08 | 25 | 0.41% | -10.42% |
| AJG | Arthur J. | | Insurance | 285.78 | 25 | 0.41% | 0.87% |
| AFL | Aflac | | Insurance | 98.92 | 25 | 0.37% | -3.84% |
| UVSP | Univest | | Regional Banks | 28.74 | 25 | 0.31% | -1.94% |
| HOMB | Home Bancshares | | Banks | 28.00 | 25 | 0.25% | -0.44% |
| PB | Prosperity Bancshares | | Regional - Southwest Banks | 66.31 | 25 | 0.18% | -11.25% |
| CBSH | Commerce Bancshares | | Regional Banks | 60.80 | 25 | -0.02% | -1.98% |
| GOOD | Gladstone Commercial | | REIT - | 13.23 | 25 | -0.08% | -16.37% |
| CIVB | Civista Bancshares | | Regional Banks | 19.34 | 25 | -0.67% | -7.33% |
| IBKR | Interactive Brokers | | Brokerage | 63.71 | 25 | -1.83% | -63.89% |
| CNOB | ConnectOne Bancorp | | Regional Banks | 22.80 | 23 | 0.53% | 0.19% |
| HST | Host Hotels | | REIT | 15.40 | 23 | -1.85% | -10.85% |
| RHP | Ryman Hospitality | | REIT | 93.74 | 20 | 0.75% | -9.02% |
| CLDT | Chatham Lodging | | REIT | 6.71 | 20 | 0.30% | -24.08% |
| SUNS | Solar Senior | | Asset Mgmt | 9.94 | 20 | 0.10% | -27.46% |
| MSBI | Midland States | | Regional Banks | 16.71 | 20 | -0.12% | -30.42% |
| AHH | Armada Hoffler | | REIT - | 6.75 | 20 | -0.30% | -32.80% |
| SLQT | SelectQuote | | Insurance | 1.74 | 20 | -1.14% | -53.23% |
| For chart view version of above stock list: Chart View ➞ 0 - 25 , 25 - 50 , 50 - 75 , 75 - 100 , 100 - 125 , 125 - 150 , 150 - 175 , 175 - 200 , 200 - 225 , 225 - 250 , 250 - 275 , 275 - 300 , 300 - 325 , 325 - 350 , 350 - 375 , 375 - 400 , 400 - 425 , 425 - 450 , 450 - 475 , 475 - 500 , 500 - 525 , 525 - 550 , 550 - 575 | ||
 | Click To Change The Sort Order: By Market Cap or Company Size Performance: Year-to-date, Week and Day |  |
|
Get the most comprehensive stock market coverage daily at 12Stocks.com ➞ Best Stocks Today ➞ Best Stocks Weekly ➞ Best Stocks Year-to-Date ➞ Best Stocks Trends ➞  Best Stocks Today 12Stocks.com Best Nasdaq Stocks ➞ Best S&P 500 Stocks ➞ Best Tech Stocks ➞ Best Biotech Stocks ➞ |
| Detailed Overview of Financial Stocks |
| Financial Technical Overview, Leaders & Laggards, Top Financial ETF Funds & Detailed Financial Stocks List, Charts, Trends & More |
| Financial Sector: Technical Analysis, Trends & YTD Performance | |
| Financial sector is composed of stocks
from banks, brokers, insurance, REITs
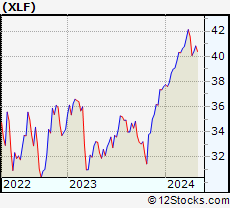
and services subsectors. Financial sector, as represented by XLF, an exchange-traded fund [ETF] that holds basket of Financial stocks (e.g, Bank of America, Goldman Sachs) is up by 7.36% and is currently outperforming the overall market by 0.31% year-to-date. Below is a quick view of Technical charts and trends: |
|
 XLF Weekly Chart |
|
| Long Term Trend: Good | |
| Medium Term Trend: Not Good | |
 XLF Daily Chart |
|
| Short Term Trend: Not Good | |
| Overall Trend Score: 33 | |
| YTD Performance: 7.36% | |
| **Trend Scores & Views Are Only For Educational Purposes And Not For Investing | |
| 12Stocks.com: Top Performing Financial Sector Stocks | ||||||||||||||||||||||||||||||||||||||||||||||||
 The top performing Financial sector stocks year to date are
Now, more recently, over last week, the top performing Financial sector stocks on the move are


|
||||||||||||||||||||||||||||||||||||||||||||||||
| 12Stocks.com: Investing in Financial Sector using Exchange Traded Funds | |
|
The following table shows list of key exchange traded funds (ETF) that
help investors track Financial Index. For detailed view, check out our ETF Funds section of our website. Quick View: Move mouse or cursor over ETF symbol (ticker) to view short-term Technical chart and over ETF name to view long term chart. Click on ticker or stock name for detailed view. Click on to add stock symbol to your watchlist and to view watchlist. |
12Stocks.com List of ETFs that track Financial Index
| Ticker | ETF Name | Watchlist | Recent Price | Smart Investing & Trading Score | Change % | Week % | Year-to-date % |
| XLF | Financial | | 51.70 | 33 | -0.4 | 0.58 | 7.36% |
| IAI | Broker-Dealers & Secs | | 173.45 | 53 | -0.87 | 1.45 | 20.77% |
| KBE | Bank | | 56.27 | 51 | 0.52 | 1.83 | 2.16% |
| FAS | Financial Bull 3X | | 159.77 | 33 | -1.27 | 1.61 | 6.12% |
| FAZ | Financial Bear 3X | | 4.60 | 62 | 1.32 | -1.5 | -26.44% |
| UYG | Financials | | 92.14 | 26 | -0.79 | 0.92 | 8.14% |
| KIE | Insurance | | 56.82 | 35 | 0.71 | 1.99 | 1.03% |
| 12Stocks.com: Charts, Trends, Fundamental Data and Performances of Financial Stocks | |
|
We now take in-depth look at all Financial stocks including charts, multi-period performances and overall trends (as measured by Smart Investing & Trading Score). One can sort Financial stocks (click link to choose) by Daily, Weekly and by Year-to-Date performances. Also, one can sort by size of the company or by market capitalization. |
| Select Your Default Chart Type: | |||||
| |||||
| Click on stock symbol or name for detailed view. Click on to add stock symbol to your watchlist and to view watchlist. Quick View: Move mouse or cursor over "Daily" to quickly view daily Technical stock chart and over "Weekly" to view weekly Technical stock chart. | |||||

 | EQR Equity Residential |
| Sector: Financials | |
| SubSector: REIT - Residential | |
| MarketCap: 22061.9 Millions | |
| Recent Price: 63.41 Smart Investing & Trading Score: 25 | |
| Day Percent Change: 1.18% Day Change: 0.74 | |
| Week Change: 1.05% Year-to-date Change: -9.9% | |
| EQR Links: Profile News Message Board | |
| Charts:- Daily , Weekly | |
| Add EQR to Watchlist: View: Get Complete EQR Trend Analysis ➞ | |
 | INVH Invitation Homes Inc. |
| Sector: Financials | |
| SubSector: Real Estate Development | |
| MarketCap: 9782.89 Millions | |
| Recent Price: 30.46 Smart Investing & Trading Score: 25 | |
| Day Percent Change: 0.89% Day Change: 0.27 | |
| Week Change: 0.4% Year-to-date Change: -3.9% | |
| INVH Links: Profile News Message Board | |
| Charts:- Daily , Weekly | |
| Add INVH to Watchlist: View: Get Complete INVH Trend Analysis ➞ | |
 | CBU Community Bank System, Inc. |
| Sector: Financials | |
| SubSector: Regional - Midwest Banks | |
| MarketCap: 2787.8 Millions | |
| Recent Price: 52.86 Smart Investing & Trading Score: 25 | |
| Day Percent Change: 0.88% Day Change: 0.46 | |
| Week Change: 2.72% Year-to-date Change: -13.6% | |
| CBU Links: Profile News Message Board | |
| Charts:- Daily , Weekly | |
| Add CBU to Watchlist: View: Get Complete CBU Trend Analysis ➞ | |
 | BFS Saul Centers, Inc. |
| Sector: Financials | |
| SubSector: REIT - Retail | |
| MarketCap: 689.914 Millions | |
| Recent Price: 32.26 Smart Investing & Trading Score: 25 | |
| Day Percent Change: 0.81% Day Change: 0.26 | |
| Week Change: 1.67% Year-to-date Change: -14.0% | |
| BFS Links: Profile News Message Board | |
| Charts:- Daily , Weekly | |
| Add BFS to Watchlist: View: Get Complete BFS Trend Analysis ➞ | |
 | USCB USCB Financial Holdings, Inc. |
| Sector: Financials | |
| SubSector: Banks - Regional | |
| MarketCap: 198 Millions | |
| Recent Price: 16.52 Smart Investing & Trading Score: 25 | |
| Day Percent Change: 0.73% Day Change: 0.12 | |
| Week Change: 2.16% Year-to-date Change: -6.4% | |
| USCB Links: Profile News Message Board | |
| Charts:- Daily , Weekly | |
| Add USCB to Watchlist: View: Get Complete USCB Trend Analysis ➞ | |
 | AGM Federal Agricultural Mortgage Corporation |
| Sector: Financials | |
| SubSector: Credit Services | |
| MarketCap: 542.008 Millions | |
| Recent Price: 172.96 Smart Investing & Trading Score: 25 | |
| Day Percent Change: 0.52% Day Change: 0.89 | |
| Week Change: 1.57% Year-to-date Change: -11.5% | |
| AGM Links: Profile News Message Board | |
| Charts:- Daily , Weekly | |
| Add AGM to Watchlist: View: Get Complete AGM Trend Analysis ➞ | |
 | CBNK Capital Bancorp, Inc. |
| Sector: Financials | |
| SubSector: Savings & Loans | |
| MarketCap: 174.93 Millions | |
| Recent Price: 31.37 Smart Investing & Trading Score: 25 | |
| Day Percent Change: 0.48% Day Change: 0.15 | |
| Week Change: 1.49% Year-to-date Change: 10.4% | |
| CBNK Links: Profile News Message Board | |
| Charts:- Daily , Weekly | |
| Add CBNK to Watchlist: View: Get Complete CBNK Trend Analysis ➞ | |
 | WASH Washington Trust Bancorp, Inc. |
| Sector: Financials | |
| SubSector: Regional - Northeast Banks | |
| MarketCap: 590.099 Millions | |
| Recent Price: 27.08 Smart Investing & Trading Score: 25 | |
| Day Percent Change: 0.41% Day Change: 0.11 | |
| Week Change: 2.46% Year-to-date Change: -10.4% | |
| WASH Links: Profile News Message Board | |
| Charts:- Daily , Weekly | |
| Add WASH to Watchlist: View: Get Complete WASH Trend Analysis ➞ | |
 | AJG Arthur J. Gallagher & Co. |
| Sector: Financials | |
| SubSector: Insurance Brokers | |
| MarketCap: 14852.2 Millions | |
| Recent Price: 285.78 Smart Investing & Trading Score: 25 | |
| Day Percent Change: 0.41% Day Change: 1.17 | |
| Week Change: 0.57% Year-to-date Change: 0.9% | |
| AJG Links: Profile News Message Board | |
| Charts:- Daily , Weekly | |
| Add AJG to Watchlist: View: Get Complete AJG Trend Analysis ➞ | |
 | AFL Aflac Incorporated |
| Sector: Financials | |
| SubSector: Accident & Health Insurance | |
| MarketCap: 22706 Millions | |
| Recent Price: 98.92 Smart Investing & Trading Score: 25 | |
| Day Percent Change: 0.37% Day Change: 0.36 | |
| Week Change: 0.85% Year-to-date Change: -3.8% | |
| AFL Links: Profile News Message Board | |
| Charts:- Daily , Weekly | |
| Add AFL to Watchlist: View: Get Complete AFL Trend Analysis ➞ | |
 | UVSP Univest Financial Corporation |
| Sector: Financials | |
| SubSector: Regional - Northeast Banks | |
| MarketCap: 467.999 Millions | |
| Recent Price: 28.74 Smart Investing & Trading Score: 25 | |
| Day Percent Change: 0.31% Day Change: 0.09 | |
| Week Change: 2.2% Year-to-date Change: -1.9% | |
| UVSP Links: Profile News Message Board | |
| Charts:- Daily , Weekly | |
| Add UVSP to Watchlist: View: Get Complete UVSP Trend Analysis ➞ | |
 | HOMB Home Bancshares, Inc. (Conway, AR) |
| Sector: Financials | |
| SubSector: Money Center Banks | |
| MarketCap: 2090.49 Millions | |
| Recent Price: 28.00 Smart Investing & Trading Score: 25 | |
| Day Percent Change: 0.25% Day Change: 0.07 | |
| Week Change: 1.45% Year-to-date Change: -0.4% | |
| HOMB Links: Profile News Message Board | |
| Charts:- Daily , Weekly | |
| Add HOMB to Watchlist: View: Get Complete HOMB Trend Analysis ➞ | |
 | PB Prosperity Bancshares, Inc. |
| Sector: Financials | |
| SubSector: Regional - Southwest Banks | |
| MarketCap: 4682.25 Millions | |
| Recent Price: 66.31 Smart Investing & Trading Score: 25 | |
| Day Percent Change: 0.18% Day Change: 0.12 | |
| Week Change: 0.59% Year-to-date Change: -11.3% | |
| PB Links: Profile News Message Board | |
| Charts:- Daily , Weekly | |
| Add PB to Watchlist: View: Get Complete PB Trend Analysis ➞ | |
 | CBSH Commerce Bancshares, Inc. |
| Sector: Financials | |
| SubSector: Regional - Midwest Banks | |
| MarketCap: 6201.5 Millions | |
| Recent Price: 60.80 Smart Investing & Trading Score: 25 | |
| Day Percent Change: -0.02% Day Change: -0.01 | |
| Week Change: 1.47% Year-to-date Change: -2.0% | |
| CBSH Links: Profile News Message Board | |
| Charts:- Daily , Weekly | |
| Add CBSH to Watchlist: View: Get Complete CBSH Trend Analysis ➞ | |
 | GOOD Gladstone Commercial Corporation |
| Sector: Financials | |
| SubSector: REIT - Diversified | |
| MarketCap: 425.253 Millions | |
| Recent Price: 13.23 Smart Investing & Trading Score: 25 | |
| Day Percent Change: -0.08% Day Change: -0.01 | |
| Week Change: 1.69% Year-to-date Change: -16.4% | |
| GOOD Links: Profile News Message Board | |
| Charts:- Daily , Weekly | |
| Add GOOD to Watchlist: View: Get Complete GOOD Trend Analysis ➞ | |
 | CIVB Civista Bancshares, Inc. |
| Sector: Financials | |
| SubSector: Regional - Pacific Banks | |
| MarketCap: 255.929 Millions | |
| Recent Price: 19.34 Smart Investing & Trading Score: 25 | |
| Day Percent Change: -0.67% Day Change: -0.13 | |
| Week Change: -0.05% Year-to-date Change: -7.3% | |
| CIVB Links: Profile News Message Board | |
| Charts:- Daily , Weekly | |
| Add CIVB to Watchlist: View: Get Complete CIVB Trend Analysis ➞ | |
 | IBKR Interactive Brokers Group, Inc. |
| Sector: Financials | |
| SubSector: Investment Brokerage - National | |
| MarketCap: 16975.7 Millions | |
| Recent Price: 63.71 Smart Investing & Trading Score: 25 | |
| Day Percent Change: -1.83% Day Change: -1.19 | |
| Week Change: 0.16% Year-to-date Change: -63.9% | |
| IBKR Links: Profile News Message Board | |
| Charts:- Daily , Weekly | |
| Add IBKR to Watchlist: View: Get Complete IBKR Trend Analysis ➞ | |
 | CNOB ConnectOne Bancorp, Inc. |
| Sector: Financials | |
| SubSector: Regional - Northeast Banks | |
| MarketCap: 491.899 Millions | |
| Recent Price: 22.80 Smart Investing & Trading Score: 23 | |
| Day Percent Change: 0.53% Day Change: 0.12 | |
| Week Change: 2.52% Year-to-date Change: 0.2% | |
| CNOB Links: Profile News Message Board | |
| Charts:- Daily , Weekly | |
| Add CNOB to Watchlist: View: Get Complete CNOB Trend Analysis ➞ | |
 | HST Host Hotels & Resorts, Inc. |
| Sector: Financials | |
| SubSector: REIT - Hotel/Motel | |
| MarketCap: 8253.74 Millions | |
| Recent Price: 15.40 Smart Investing & Trading Score: 23 | |
| Day Percent Change: -1.85% Day Change: -0.29 | |
| Week Change: -0.84% Year-to-date Change: -10.9% | |
| HST Links: Profile News Message Board | |
| Charts:- Daily , Weekly | |
| Add HST to Watchlist: View: Get Complete HST Trend Analysis ➞ | |
 | RHP Ryman Hospitality Properties, Inc. |
| Sector: Financials | |
| SubSector: REIT - Hotel/Motel | |
| MarketCap: 1519.74 Millions | |
| Recent Price: 93.74 Smart Investing & Trading Score: 20 | |
| Day Percent Change: 0.75% Day Change: 0.7 | |
| Week Change: 0.89% Year-to-date Change: -9.0% | |
| RHP Links: Profile News Message Board | |
| Charts:- Daily , Weekly | |
| Add RHP to Watchlist: View: Get Complete RHP Trend Analysis ➞ | |
 | CLDT Chatham Lodging Trust |
| Sector: Financials | |
| SubSector: REIT - Hotel/Motel | |
| MarketCap: 274.734 Millions | |
| Recent Price: 6.71 Smart Investing & Trading Score: 20 | |
| Day Percent Change: 0.3% Day Change: 0.02 | |
| Week Change: 0.9% Year-to-date Change: -24.1% | |
| CLDT Links: Profile News Message Board | |
| Charts:- Daily , Weekly | |
| Add CLDT to Watchlist: View: Get Complete CLDT Trend Analysis ➞ | |
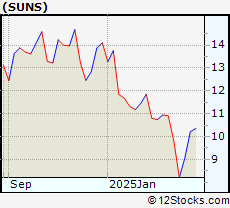 | SUNS Solar Senior Capital Ltd. |
| Sector: Financials | |
| SubSector: Asset Management | |
| MarketCap: 147.203 Millions | |
| Recent Price: 9.94 Smart Investing & Trading Score: 20 | |
| Day Percent Change: 0.1% Day Change: 0.01 | |
| Week Change: 0.71% Year-to-date Change: -27.5% | |
| SUNS Links: Profile News Message Board | |
| Charts:- Daily , Weekly | |
| Add SUNS to Watchlist: View: Get Complete SUNS Trend Analysis ➞ | |
 | MSBI Midland States Bancorp, Inc. |
| Sector: Financials | |
| SubSector: Regional - Midwest Banks | |
| MarketCap: 400.27 Millions | |
| Recent Price: 16.71 Smart Investing & Trading Score: 20 | |
| Day Percent Change: -0.12% Day Change: -0.02 | |
| Week Change: 1.09% Year-to-date Change: -30.4% | |
| MSBI Links: Profile News Message Board | |
| Charts:- Daily , Weekly | |
| Add MSBI to Watchlist: View: Get Complete MSBI Trend Analysis ➞ | |
 | AHH Armada Hoffler Properties, Inc. |
| Sector: Financials | |
| SubSector: REIT - Diversified | |
| MarketCap: 550.653 Millions | |
| Recent Price: 6.75 Smart Investing & Trading Score: 20 | |
| Day Percent Change: -0.3% Day Change: -0.02 | |
| Week Change: 0.9% Year-to-date Change: -32.8% | |
| AHH Links: Profile News Message Board | |
| Charts:- Daily , Weekly | |
| Add AHH to Watchlist: View: Get Complete AHH Trend Analysis ➞ | |
 | SLQT SelectQuote, Inc. |
| Sector: Financials | |
| SubSector: Insurance Brokers | |
| MarketCap: 38257 Millions | |
| Recent Price: 1.74 Smart Investing & Trading Score: 20 | |
| Day Percent Change: -1.14% Day Change: -0.02 | |
| Week Change: 0% Year-to-date Change: -53.2% | |
| SLQT Links: Profile News Message Board | |
| Charts:- Daily , Weekly | |
| Add SLQT to Watchlist: View: Get Complete SLQT Trend Analysis ➞ | |
| For tabular summary view of above stock list: Summary View ➞ 0 - 25 , 25 - 50 , 50 - 75 , 75 - 100 , 100 - 125 , 125 - 150 , 150 - 175 , 175 - 200 , 200 - 225 , 225 - 250 , 250 - 275 , 275 - 300 , 300 - 325 , 325 - 350 , 350 - 375 , 375 - 400 , 400 - 425 , 425 - 450 , 450 - 475 , 475 - 500 , 500 - 525 , 525 - 550 , 550 - 575 | ||
| Click To Change The Sort Order: By Market Cap or Company Size Performance: Year-to-date, Week and Day | |
| Select Chart Type: | ||
|
Best Stocks Today 12Stocks.com |
© 2025 12Stocks.com Terms & Conditions Privacy Contact Us
All Information Provided Only For Education And Not To Be Used For Investing or Trading. See Terms & Conditions


One More Thing ... Get Best Stocks Delivered Daily!
Never Ever Miss A Move With Our Top Ten Stocks Lists
Find Best Stocks In Any Market - Bull or Bear Market
Take A Peek At Our Top Ten Stocks Lists: Daily, Weekly, Year-to-Date & Top Trends
Find Best Stocks In Any Market - Bull or Bear Market
Take A Peek At Our Top Ten Stocks Lists: Daily, Weekly, Year-to-Date & Top Trends
Financial Stocks With Best Up Trends [0-bearish to 100-bullish]: Lemonade [100], MBIA [100], AlTi Global[100], Cushman & Wakefield[100], LGI Homes[100], Rocket [100], Tanger Factory[100], Mr. Cooper[100], CBL & Associates Properties[100], Hamilton Lane[100], Simon Property[100]
Best Financial Stocks Year-to-Date:
ESSA Bancorp[3207.77%], Easterly Government[107.23%], Mr. Cooper[97.21%], Heritage Insurance[79.01%], Root [72.94%], Industrial Logistics[70.13%], Rocket [69.21%], Diversified Healthcare[50.49%], ProAssurance [49.72%], World Acceptance[41.78%], XP [41.43%] Best Financial Stocks This Week:
Uniti [47.66%], Lemonade [31.68%], AlTi Global[24.1%], MBIA [20.54%], Industrial Logistics[14.9%], Cushman & Wakefield[12.24%], Tanger Factory[9.38%], Hippo [9.07%], Rocket [9.01%], LGI Homes[8.92%], eXp World[8.81%] Best Financial Stocks Daily:
Lemonade [29.54%], MBIA [22.5%], AlTi Global[18.05%], Cushman & Wakefield[8.69%], LGI Homes[8.6%], Rocket [6.81%], Alexander s[6.14%], Tanger Factory[5.97%], Brookfield Business[5.91%], Mr. Cooper[5.69%], B. Riley[5.38%]