
 Login Sign Up


| |||||
 |  | ||||

| 12Stocks.com Market Intelligence |
Best Financial Stocks
| In a hurry? Financial Stocks Lists: Performance Trends Table, Stock Charts
Sort Financial stocks: Daily, Weekly, Year-to-Date, Market Cap & Trends. Filter Financial stocks list by size:All Financial Large Mid-Range Small & MicroCap |
| 12Stocks.com Financial Stocks Performances & Trends Daily | |||||||||
|
|  The overall Smart Investing & Trading Score is 33 (0-bearish to 100-bullish) which puts Financial sector in short term bearish to neutral trend. The Smart Investing & Trading Score from previous trading session is 26 and hence an improvement of trend.
| ||||||||
Here are the Smart Investing & Trading Scores of the most requested Financial stocks at 12Stocks.com (click stock name for detailed review):
|


| 12Stocks.com: Investing in Financial sector with Stocks | |
|
The following table helps investors and traders sort through current performance and trends (as measured by Smart Investing & Trading Score) of various
stocks in the Financial sector. Quick View: Move mouse or cursor over stock symbol (ticker) to view short-term Technical chart and over stock name to view long term chart. Click on  to add stock symbol to your watchlist and to add stock symbol to your watchlist and  to view watchlist. Click on any ticker or stock name for detailed market intelligence report for that stock. to view watchlist. Click on any ticker or stock name for detailed market intelligence report for that stock. |
12Stocks.com Performance of Stocks in Financial Sector
| Ticker | Stock Name | Watchlist | Category | Recent Price | Smart Investing & Trading Score | Change % | YTD Change% |
| ABCB | Ameris Bancorp |   | Regional Banks | 66.60 | 33 | 1.05 | 6.81% |
| WSBC | WesBanco | | Regional Banks | 29.82 | 17 | 1.05 | -7.31% |
| BDN | Brandywine Realty | | REIT - | 3.85 | 0 | 1.05 | -26.84% |
| SMBC | Southern Missouri | | S&L | 53.01 | 13 | 1.03 | -7.25% |
| VRTS | Virtus | | Asset Mgmt | 191.62 | 53 | 1.03 | -13.13% |
| FRT | Federal Realty | | REIT - Retail | 91.54 | 10 | 1.03 | -16.48% |
| HST | Host Hotels | | REIT | 15.69 | 53 | 1.03 | -9.17% |
| FRME | First Merchants | | Regional Banks | 37.49 | 23 | 1.02 | -5.23% |
| KEY | KeyCorp | | Regional Banks | 17.83 | 53 | 1.02 | 5.30% |
| SBSI | Southside Bancshares | | Regional Banks | 28.98 | 36 | 1.01 | -7.69% |
| EGP | East Properties | | REIT - Industrial | 163.60 | 44 | 1.01 | 2.75% |
| PRU | Prudential | | Life Insurance | 101.73 | 18 | 1.01 | -13.12% |
| CBNK | Capital Bancorp | | S&L | 31.22 | 10 | 1.00 | 9.89% |
| CNO | CNO | | Insurance | 35.84 | 8 | 0.99 | -3.29% |
| SF | Stifel | | Brokerage | 112.27 | 65 | 0.99 | 6.30% |
| EPRT | Essential Properties | | REIT - | 30.84 | 57 | 0.98 | -0.51% |
| ESRT | Empire State | | REIT - | 7.22 | 27 | 0.98 | -29.73% |
| FFIN | First | | Regional - Southwest Banks | 34.38 | 10 | 0.97 | -4.14% |
| DX | Dynex Capital | | Mortgage | 12.57 | 70 | 0.96 | 5.63% |
| OFG | OFG Bancorp | | Banks | 42.18 | 54 | 0.96 | 0.42% |
| AFG | American | | Insurance | 123.60 | 31 | 0.96 | -7.15% |
| HONE | HarborOne Bancorp | | S&L | 11.72 | 46 | 0.95 | 0.04% |
| HRTG | Heritage Insurance | | Insurance | 21.21 | 25 | 0.95 | 75.29% |
| WSFS | WSFS | | Regional Banks | 54.27 | 43 | 0.95 | 2.40% |
| WABC | Westamerica Ban | | Regional Banks | 47.77 | 30 | 0.95 | -8.16% |
| For chart view version of above stock list: Chart View ➞ 0 - 25 , 25 - 50 , 50 - 75 , 75 - 100 , 100 - 125 , 125 - 150 , 150 - 175 , 175 - 200 , 200 - 225 , 225 - 250 , 250 - 275 , 275 - 300 , 300 - 325 , 325 - 350 , 350 - 375 , 375 - 400 , 400 - 425 , 425 - 450 , 450 - 475 , 475 - 500 , 500 - 525 , 525 - 550 , 550 - 575 | ||
 | Click To Change The Sort Order: By Market Cap or Company Size Performance: Year-to-date, Week and Day |  |
|
Get the most comprehensive stock market coverage daily at 12Stocks.com ➞ Best Stocks Today ➞ Best Stocks Weekly ➞ Best Stocks Year-to-Date ➞ Best Stocks Trends ➞  Best Stocks Today 12Stocks.com Best Nasdaq Stocks ➞ Best S&P 500 Stocks ➞ Best Tech Stocks ➞ Best Biotech Stocks ➞ |
| Detailed Overview of Financial Stocks |
| Financial Technical Overview, Leaders & Laggards, Top Financial ETF Funds & Detailed Financial Stocks List, Charts, Trends & More |
| Financial Sector: Technical Analysis, Trends & YTD Performance | |
| Financial sector is composed of stocks
from banks, brokers, insurance, REITs
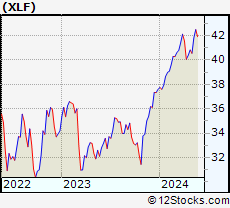
and services subsectors. Financial sector, as represented by XLF, an exchange-traded fund [ETF] that holds basket of Financial stocks (e.g, Bank of America, Goldman Sachs) is up by 7.8% and is currently outperforming the overall market by 0.27% year-to-date. Below is a quick view of Technical charts and trends: |
|
 XLF Weekly Chart |
|
| Long Term Trend: Good | |
| Medium Term Trend: Not Good | |
 XLF Daily Chart |
|
| Short Term Trend: Not Good | |
| Overall Trend Score: 33 | |
| YTD Performance: 7.8% | |
| **Trend Scores & Views Are Only For Educational Purposes And Not For Investing | |
| 12Stocks.com: Top Performing Financial Sector Stocks | ||||||||||||||||||||||||||||||||||||||||||||||||
 The top performing Financial sector stocks year to date are
Now, more recently, over last week, the top performing Financial sector stocks on the move are


|
||||||||||||||||||||||||||||||||||||||||||||||||
| 12Stocks.com: Investing in Financial Sector using Exchange Traded Funds | |
|
The following table shows list of key exchange traded funds (ETF) that
help investors track Financial Index. For detailed view, check out our ETF Funds section of our website. Quick View: Move mouse or cursor over ETF symbol (ticker) to view short-term Technical chart and over ETF name to view long term chart. Click on ticker or stock name for detailed view. Click on to add stock symbol to your watchlist and to view watchlist. |
12Stocks.com List of ETFs that track Financial Index
| Ticker | ETF Name | Watchlist | Recent Price | Smart Investing & Trading Score | Change % | Week % | Year-to-date % |
| XLF | Financial | | 51.91 | 33 | 0.99 | 0.99 | 7.8% |
| IAI | Broker-Dealers & Secs | | 174.97 | 63 | 2.34 | 2.34 | 21.82% |
| KBE | Bank | | 55.98 | 43 | 1.3 | 1.3 | 1.64% |
| FAS | Financial Bull 3X | | 161.82 | 33 | 2.91 | 2.91 | 7.48% |
| FAZ | Financial Bear 3X | | 4.54 | 62 | -2.78 | -2.78 | -27.4% |
| UYG | Financials | | 92.87 | 26 | 1.72 | 1.72 | 9% |
| KIE | Insurance | | 56.42 | 25 | 1.27 | 1.27 | 0.32% |
| 12Stocks.com: Charts, Trends, Fundamental Data and Performances of Financial Stocks | |
|
We now take in-depth look at all Financial stocks including charts, multi-period performances and overall trends (as measured by Smart Investing & Trading Score). One can sort Financial stocks (click link to choose) by Daily, Weekly and by Year-to-Date performances. Also, one can sort by size of the company or by market capitalization. |
| Select Your Default Chart Type: | |||||
| |||||
| Click on stock symbol or name for detailed view. Click on to add stock symbol to your watchlist and to view watchlist. Quick View: Move mouse or cursor over "Daily" to quickly view daily Technical stock chart and over "Weekly" to view weekly Technical stock chart. | |||||

 | ABCB Ameris Bancorp |
| Sector: Financials | |
| SubSector: Regional - Mid-Atlantic Banks | |
| MarketCap: 1537.79 Millions | |
| Recent Price: 66.60 Smart Investing & Trading Score: 33 | |
| Day Percent Change: 1.05% Day Change: 0.69 | |
| Week Change: 1.05% Year-to-date Change: 6.8% | |
| ABCB Links: Profile News Message Board | |
| Charts:- Daily , Weekly | |
| Add ABCB to Watchlist: View: Get Complete ABCB Trend Analysis ➞ | |
 | WSBC WesBanco, Inc. |
| Sector: Financials | |
| SubSector: Regional - Mid-Atlantic Banks | |
| MarketCap: 1575.79 Millions | |
| Recent Price: 29.82 Smart Investing & Trading Score: 17 | |
| Day Percent Change: 1.05% Day Change: 0.31 | |
| Week Change: 1.05% Year-to-date Change: -7.3% | |
| WSBC Links: Profile News Message Board | |
| Charts:- Daily , Weekly | |
| Add WSBC to Watchlist: View: Get Complete WSBC Trend Analysis ➞ | |
 | BDN Brandywine Realty Trust |
| Sector: Financials | |
| SubSector: REIT - Diversified | |
| MarketCap: 1688.13 Millions | |
| Recent Price: 3.85 Smart Investing & Trading Score: 0 | |
| Day Percent Change: 1.05% Day Change: 0.04 | |
| Week Change: 1.05% Year-to-date Change: -26.8% | |
| BDN Links: Profile News Message Board | |
| Charts:- Daily , Weekly | |
| Add BDN to Watchlist: View: Get Complete BDN Trend Analysis ➞ | |
 | SMBC Southern Missouri Bancorp, Inc. |
| Sector: Financials | |
| SubSector: Savings & Loans | |
| MarketCap: 272.53 Millions | |
| Recent Price: 53.01 Smart Investing & Trading Score: 13 | |
| Day Percent Change: 1.03% Day Change: 0.54 | |
| Week Change: 1.03% Year-to-date Change: -7.3% | |
| SMBC Links: Profile News Message Board | |
| Charts:- Daily , Weekly | |
| Add SMBC to Watchlist: View: Get Complete SMBC Trend Analysis ➞ | |
 | VRTS Virtus Investment Partners, Inc. |
| Sector: Financials | |
| SubSector: Asset Management | |
| MarketCap: 601.303 Millions | |
| Recent Price: 191.62 Smart Investing & Trading Score: 53 | |
| Day Percent Change: 1.03% Day Change: 1.96 | |
| Week Change: 1.03% Year-to-date Change: -13.1% | |
| VRTS Links: Profile News Message Board | |
| Charts:- Daily , Weekly | |
| Add VRTS to Watchlist: View: Get Complete VRTS Trend Analysis ➞ | |
 | FRT Federal Realty Investment Trust |
| Sector: Financials | |
| SubSector: REIT - Retail | |
| MarketCap: 5878.64 Millions | |
| Recent Price: 91.54 Smart Investing & Trading Score: 10 | |
| Day Percent Change: 1.03% Day Change: 0.93 | |
| Week Change: 1.03% Year-to-date Change: -16.5% | |
| FRT Links: Profile News Message Board | |
| Charts:- Daily , Weekly | |
| Add FRT to Watchlist: View: Get Complete FRT Trend Analysis ➞ | |
 | HST Host Hotels & Resorts, Inc. |
| Sector: Financials | |
| SubSector: REIT - Hotel/Motel | |
| MarketCap: 8253.74 Millions | |
| Recent Price: 15.69 Smart Investing & Trading Score: 53 | |
| Day Percent Change: 1.03% Day Change: 0.16 | |
| Week Change: 1.03% Year-to-date Change: -9.2% | |
| HST Links: Profile News Message Board | |
| Charts:- Daily , Weekly | |
| Add HST to Watchlist: View: Get Complete HST Trend Analysis ➞ | |
 | FRME First Merchants Corporation |
| Sector: Financials | |
| SubSector: Regional - Midwest Banks | |
| MarketCap: 1490.4 Millions | |
| Recent Price: 37.49 Smart Investing & Trading Score: 23 | |
| Day Percent Change: 1.02% Day Change: 0.38 | |
| Week Change: 1.02% Year-to-date Change: -5.2% | |
| FRME Links: Profile News Message Board | |
| Charts:- Daily , Weekly | |
| Add FRME to Watchlist: View: Get Complete FRME Trend Analysis ➞ | |
 | KEY KeyCorp |
| Sector: Financials | |
| SubSector: Regional - Midwest Banks | |
| MarketCap: 10045 Millions | |
| Recent Price: 17.83 Smart Investing & Trading Score: 53 | |
| Day Percent Change: 1.02% Day Change: 0.18 | |
| Week Change: 1.02% Year-to-date Change: 5.3% | |
| KEY Links: Profile News Message Board | |
| Charts:- Daily , Weekly | |
| Add KEY to Watchlist: View: Get Complete KEY Trend Analysis ➞ | |
 | SBSI Southside Bancshares, Inc. |
| Sector: Financials | |
| SubSector: Regional - Mid-Atlantic Banks | |
| MarketCap: 971.259 Millions | |
| Recent Price: 28.98 Smart Investing & Trading Score: 36 | |
| Day Percent Change: 1.01% Day Change: 0.29 | |
| Week Change: 1.01% Year-to-date Change: -7.7% | |
| SBSI Links: Profile News Message Board | |
| Charts:- Daily , Weekly | |
| Add SBSI to Watchlist: View: Get Complete SBSI Trend Analysis ➞ | |
 | EGP EastGroup Properties, Inc. |
| Sector: Financials | |
| SubSector: REIT - Industrial | |
| MarketCap: 4034.29 Millions | |
| Recent Price: 163.60 Smart Investing & Trading Score: 44 | |
| Day Percent Change: 1.01% Day Change: 1.63 | |
| Week Change: 1.01% Year-to-date Change: 2.8% | |
| EGP Links: Profile News Message Board | |
| Charts:- Daily , Weekly | |
| Add EGP to Watchlist: View: Get Complete EGP Trend Analysis ➞ | |
 | PRU Prudential Financial, Inc. |
| Sector: Financials | |
| SubSector: Life Insurance | |
| MarketCap: 21001.6 Millions | |
| Recent Price: 101.73 Smart Investing & Trading Score: 18 | |
| Day Percent Change: 1.01% Day Change: 1.02 | |
| Week Change: 1.01% Year-to-date Change: -13.1% | |
| PRU Links: Profile News Message Board | |
| Charts:- Daily , Weekly | |
| Add PRU to Watchlist: View: Get Complete PRU Trend Analysis ➞ | |
 | CBNK Capital Bancorp, Inc. |
| Sector: Financials | |
| SubSector: Savings & Loans | |
| MarketCap: 174.93 Millions | |
| Recent Price: 31.22 Smart Investing & Trading Score: 10 | |
| Day Percent Change: 1% Day Change: 0.31 | |
| Week Change: 1% Year-to-date Change: 9.9% | |
| CBNK Links: Profile News Message Board | |
| Charts:- Daily , Weekly | |
| Add CBNK to Watchlist: View: Get Complete CBNK Trend Analysis ➞ | |
 | CNO CNO Financial Group, Inc. |
| Sector: Financials | |
| SubSector: Accident & Health Insurance | |
| MarketCap: 1746.9 Millions | |
| Recent Price: 35.84 Smart Investing & Trading Score: 8 | |
| Day Percent Change: 0.99% Day Change: 0.35 | |
| Week Change: 0.99% Year-to-date Change: -3.3% | |
| CNO Links: Profile News Message Board | |
| Charts:- Daily , Weekly | |
| Add CNO to Watchlist: View: Get Complete CNO Trend Analysis ➞ | |
 | SF Stifel Financial Corp. |
| Sector: Financials | |
| SubSector: Investment Brokerage - Regional | |
| MarketCap: 2783.65 Millions | |
| Recent Price: 112.27 Smart Investing & Trading Score: 65 | |
| Day Percent Change: 0.99% Day Change: 1.1 | |
| Week Change: 0.99% Year-to-date Change: 6.3% | |
| SF Links: Profile News Message Board | |
| Charts:- Daily , Weekly | |
| Add SF to Watchlist: View: Get Complete SF Trend Analysis ➞ | |
 | EPRT Essential Properties Realty Trust, Inc. |
| Sector: Financials | |
| SubSector: REIT - Diversified | |
| MarketCap: 1424.43 Millions | |
| Recent Price: 30.84 Smart Investing & Trading Score: 57 | |
| Day Percent Change: 0.98% Day Change: 0.3 | |
| Week Change: 0.98% Year-to-date Change: -0.5% | |
| EPRT Links: Profile News Message Board | |
| Charts:- Daily , Weekly | |
| Add EPRT to Watchlist: View: Get Complete EPRT Trend Analysis ➞ | |
 | ESRT Empire State Realty Trust, Inc. |
| Sector: Financials | |
| SubSector: REIT - Diversified | |
| MarketCap: 1632.13 Millions | |
| Recent Price: 7.22 Smart Investing & Trading Score: 27 | |
| Day Percent Change: 0.98% Day Change: 0.07 | |
| Week Change: 0.98% Year-to-date Change: -29.7% | |
| ESRT Links: Profile News Message Board | |
| Charts:- Daily , Weekly | |
| Add ESRT to Watchlist: View: Get Complete ESRT Trend Analysis ➞ | |
 | FFIN First Financial Bankshares, Inc. |
| Sector: Financials | |
| SubSector: Regional - Southwest Banks | |
| MarketCap: 3503.75 Millions | |
| Recent Price: 34.38 Smart Investing & Trading Score: 10 | |
| Day Percent Change: 0.97% Day Change: 0.33 | |
| Week Change: 0.97% Year-to-date Change: -4.1% | |
| FFIN Links: Profile News Message Board | |
| Charts:- Daily , Weekly | |
| Add FFIN to Watchlist: View: Get Complete FFIN Trend Analysis ➞ | |
 | DX Dynex Capital, Inc. |
| Sector: Financials | |
| SubSector: Mortgage Investment | |
| MarketCap: 327.839 Millions | |
| Recent Price: 12.57 Smart Investing & Trading Score: 70 | |
| Day Percent Change: 0.96% Day Change: 0.12 | |
| Week Change: 0.96% Year-to-date Change: 5.6% | |
| DX Links: Profile News Message Board | |
| Charts:- Daily , Weekly | |
| Add DX to Watchlist: View: Get Complete DX Trend Analysis ➞ | |
 | OFG OFG Bancorp |
| Sector: Financials | |
| SubSector: Money Center Banks | |
| MarketCap: 537.599 Millions | |
| Recent Price: 42.18 Smart Investing & Trading Score: 54 | |
| Day Percent Change: 0.96% Day Change: 0.4 | |
| Week Change: 0.96% Year-to-date Change: 0.4% | |
| OFG Links: Profile News Message Board | |
| Charts:- Daily , Weekly | |
| Add OFG to Watchlist: View: Get Complete OFG Trend Analysis ➞ | |
 | AFG American Financial Group, Inc. |
| Sector: Financials | |
| SubSector: Property & Casualty Insurance | |
| MarketCap: 5353.82 Millions | |
| Recent Price: 123.60 Smart Investing & Trading Score: 31 | |
| Day Percent Change: 0.96% Day Change: 1.18 | |
| Week Change: 0.96% Year-to-date Change: -7.2% | |
| AFG Links: Profile News Message Board | |
| Charts:- Daily , Weekly | |
| Add AFG to Watchlist: View: Get Complete AFG Trend Analysis ➞ | |
 | HONE HarborOne Bancorp, Inc. |
| Sector: Financials | |
| SubSector: Savings & Loans | |
| MarketCap: 456.03 Millions | |
| Recent Price: 11.72 Smart Investing & Trading Score: 46 | |
| Day Percent Change: 0.95% Day Change: 0.11 | |
| Week Change: 0.95% Year-to-date Change: 0.0% | |
| HONE Links: Profile News Message Board | |
| Charts:- Daily , Weekly | |
| Add HONE to Watchlist: View: Get Complete HONE Trend Analysis ➞ | |
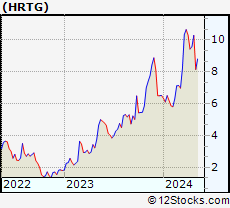 | HRTG Heritage Insurance Holdings, Inc. |
| Sector: Financials | |
| SubSector: Property & Casualty Insurance | |
| MarketCap: 303.312 Millions | |
| Recent Price: 21.21 Smart Investing & Trading Score: 25 | |
| Day Percent Change: 0.95% Day Change: 0.2 | |
| Week Change: 0.95% Year-to-date Change: 75.3% | |
| HRTG Links: Profile News Message Board | |
| Charts:- Daily , Weekly | |
| Add HRTG to Watchlist: View: Get Complete HRTG Trend Analysis ➞ | |
 | WSFS WSFS Financial Corporation |
| Sector: Financials | |
| SubSector: Regional - Mid-Atlantic Banks | |
| MarketCap: 1191.29 Millions | |
| Recent Price: 54.27 Smart Investing & Trading Score: 43 | |
| Day Percent Change: 0.95% Day Change: 0.51 | |
| Week Change: 0.95% Year-to-date Change: 2.4% | |
| WSFS Links: Profile News Message Board | |
| Charts:- Daily , Weekly | |
| Add WSFS to Watchlist: View: Get Complete WSFS Trend Analysis ➞ | |
 | WABC Westamerica Bancorporation |
| Sector: Financials | |
| SubSector: Regional - Pacific Banks | |
| MarketCap: 1557.69 Millions | |
| Recent Price: 47.77 Smart Investing & Trading Score: 30 | |
| Day Percent Change: 0.95% Day Change: 0.45 | |
| Week Change: 0.95% Year-to-date Change: -8.2% | |
| WABC Links: Profile News Message Board | |
| Charts:- Daily , Weekly | |
| Add WABC to Watchlist: View: Get Complete WABC Trend Analysis ➞ | |
| For tabular summary view of above stock list: Summary View ➞ 0 - 25 , 25 - 50 , 50 - 75 , 75 - 100 , 100 - 125 , 125 - 150 , 150 - 175 , 175 - 200 , 200 - 225 , 225 - 250 , 250 - 275 , 275 - 300 , 300 - 325 , 325 - 350 , 350 - 375 , 375 - 400 , 400 - 425 , 425 - 450 , 450 - 475 , 475 - 500 , 500 - 525 , 525 - 550 , 550 - 575 | ||
| Click To Change The Sort Order: By Market Cap or Company Size Performance: Year-to-date, Week and Day | |
| Select Chart Type: | ||
|
Best Stocks Today 12Stocks.com |
© 2025 12Stocks.com Terms & Conditions Privacy Contact Us
All Information Provided Only For Education And Not To Be Used For Investing or Trading. See Terms & Conditions


One More Thing ... Get Best Stocks Delivered Daily!
Never Ever Miss A Move With Our Top Ten Stocks Lists
Find Best Stocks In Any Market - Bull or Bear Market
Take A Peek At Our Top Ten Stocks Lists: Daily, Weekly, Year-to-Date & Top Trends
Find Best Stocks In Any Market - Bull or Bear Market
Take A Peek At Our Top Ten Stocks Lists: Daily, Weekly, Year-to-Date & Top Trends
Financial Stocks With Best Up Trends [0-bearish to 100-bullish]: Uniti [100], LendingTree [100], Mercury General[100], Perella Weinberg[100], Broadstone Net[100], LendingClub [100], TPG RE[100], CareTrust REIT[100], Stewart Information[100], Healthcare Realty[100], VICI Properties[100]
Best Financial Stocks Year-to-Date:
ESSA Bancorp[3207.77%], Easterly Government[108.45%], Mr. Cooper[86.58%], Heritage Insurance[75.29%], Root [65.29%], Industrial Logistics[64.89%], Rocket [58.42%], Diversified Healthcare[49.61%], ProAssurance [49.59%], Uniti [47.09%], SoFi Technologies[41.62%] Best Financial Stocks This Week:
Uniti [64.77%], Industrial Logistics[11.36%], LendingTree [7.32%], eXp World[7.27%], EverQuote [6.89%], Camping World[6.84%], First Foundation[6.69%], Diamond Hill[5.46%], Mercury General[5.36%], Cipher Mining[5.27%], AlTi Global[5.13%] Best Financial Stocks Daily:
Uniti [64.77%], Industrial Logistics[11.36%], LendingTree [7.32%], eXp World[7.27%], EverQuote [6.89%], Camping World[6.84%], First Foundation[6.69%], Diamond Hill[5.46%], Mercury General[5.36%], Cipher Mining[5.27%], AlTi Global[5.13%]