
 Login Sign Up


| |||||
 |  | ||||

| 12Stocks.com Market Intelligence |
Best Financial Stocks
| In a hurry? Financial Stocks Lists: Performance Trends Table, Stock Charts
Sort Financial stocks: Daily, Weekly, Year-to-Date, Market Cap & Trends. Filter Financial stocks list by size:All Financial Large Mid-Range Small & MicroCap |
| 12Stocks.com Financial Stocks Performances & Trends Daily | |||||||||
|
|  The overall Smart Investing & Trading Score is 33 (0-bearish to 100-bullish) which puts Financial sector in short term bearish to neutral trend. The Smart Investing & Trading Score from previous trading session is 26 and an improvement of trend continues.
| ||||||||
Here are the Smart Investing & Trading Scores of the most requested Financial stocks at 12Stocks.com (click stock name for detailed review):
|


| 12Stocks.com: Investing in Financial sector with Stocks | |
|
The following table helps investors and traders sort through current performance and trends (as measured by Smart Investing & Trading Score) of various
stocks in the Financial sector. Quick View: Move mouse or cursor over stock symbol (ticker) to view short-term Technical chart and over stock name to view long term chart. Click on  to add stock symbol to your watchlist and to add stock symbol to your watchlist and  to view watchlist. Click on any ticker or stock name for detailed market intelligence report for that stock. to view watchlist. Click on any ticker or stock name for detailed market intelligence report for that stock. |
12Stocks.com Performance of Stocks in Financial Sector
| Ticker | Stock Name | Watchlist | Category | Recent Price | Trend Score | Change % | YTD Change% |
| GSBC | Great Southern |   | Regional - Southwest Banks | 56.60 | 44 | 0.77% | -4.52% |
| DCOM | Dime Community | | S&L | 27.63 | 44 | 0.77% | -8.49% |
| TSBK | Timberland Bancorp | | S&L | 31.38 | 44 | 0.03% | 3.70% |
| CTBI | Community Trust | | Regional Banks | 53.68 | 44 | -0.24% | 2.17% |
| BX | Blackstone | | Asset Mgmt | 167.68 | 44 | -1.65% | -1.92% |
| JXN | Jackson | | Insurance - Life | 86.46 | 43 | 2.14% | 0.28% |
| MPB | Mid Penn | | Regional Banks | 27.09 | 43 | 1.23% | -5.44% |
| RNST | Renasant | | Banks | 36.38 | 43 | 1.08% | 2.42% |
| CFFN | Capitol Federal | | S&L | 5.82 | 43 | 0.87% | -0.15% |
| WTFC | Wintrust | | Regional Banks | 125.82 | 43 | 0.78% | 1.28% |
| NBHC | National Bank | | Regional Banks | 36.77 | 43 | 0.74% | -14.01% |
| FSBW | FS Bancorp | | Regional Banks | 39.07 | 43 | 0.64% | -4.20% |
| STEP | StepStone | | Asset Mgmt | 58.43 | 43 | 0.60% | 1.37% |
| COF | Capital One | | Credit Services | 212.00 | 43 | 0.57% | 19.24% |
| EBC | Eastern Bankshares | | Banks Regional | 15.31 | 43 | 0.39% | -10.65% |
| USB | U.S. Bancorp | | Regional Banks | 44.56 | 43 | 0.32% | -5.72% |
| OWL | Blue Owl | | Asset Mgmt | 19.35 | 43 | 0.00% | -16.19% |
| BKU | BankUnited | | Regional Banks | 35.80 | 43 | 0.00% | -4.47% |
| CCBG | Capital City | | Regional Banks | 38.89 | 43 | -0.08% | 6.82% |
| VBTX | Veritex | | Regional - Southwest Banks | 31.35 | 43 | -0.16% | 16.30% |
| CCNE | CNB | | Regional Banks | 22.53 | 43 | -0.18% | -8.71% |
| ASB | Associated Banc-Corp | | Regional Banks | 24.29 | 43 | -0.41% | 2.58% |
| HBAN | Huntington Bancshares | | Regional Banks | 16.20 | 43 | -0.43% | 0.62% |
| ZION | Zions Ban | | Regional Banks | 52.47 | 43 | -0.55% | -2.53% |
| CFG | Citizens | | Regional Banks | 47.30 | 43 | -0.59% | 9.04% |
| For chart view version of above stock list: Chart View ➞ 0 - 25 , 25 - 50 , 50 - 75 , 75 - 100 , 100 - 125 , 125 - 150 , 150 - 175 , 175 - 200 , 200 - 225 , 225 - 250 , 250 - 275 , 275 - 300 , 300 - 325 , 325 - 350 , 350 - 375 , 375 - 400 , 400 - 425 , 425 - 450 , 450 - 475 , 475 - 500 , 500 - 525 , 525 - 550 , 550 - 575 | ||
 | Click To Change The Sort Order: By Market Cap or Company Size Performance: Year-to-date, Week and Day |  |
|
Get the most comprehensive stock market coverage daily at 12Stocks.com ➞ Best Stocks Today ➞ Best Stocks Weekly ➞ Best Stocks Year-to-Date ➞ Best Stocks Trends ➞  Best Stocks Today 12Stocks.com Best Nasdaq Stocks ➞ Best S&P 500 Stocks ➞ Best Tech Stocks ➞ Best Biotech Stocks ➞ |
| Detailed Overview of Financial Stocks |
| Financial Technical Overview, Leaders & Laggards, Top Financial ETF Funds & Detailed Financial Stocks List, Charts, Trends & More |
| Financial Sector: Technical Analysis, Trends & YTD Performance | |
| Financial sector is composed of stocks
from banks, brokers, insurance, REITs
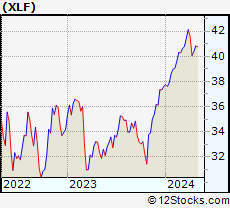
and services subsectors. Financial sector, as represented by XLF, an exchange-traded fund [ETF] that holds basket of Financial stocks (e.g, Bank of America, Goldman Sachs) is up by 7.36% and is currently outperforming the overall market by 0.31% year-to-date. Below is a quick view of Technical charts and trends: |
|
 XLF Weekly Chart |
|
| Long Term Trend: Good | |
| Medium Term Trend: Not Good | |
 XLF Daily Chart |
|
| Short Term Trend: Not Good | |
| Overall Trend Score: 33 | |
| YTD Performance: 7.36% | |
| **Trend Scores & Views Are Only For Educational Purposes And Not For Investing | |
| 12Stocks.com: Top Performing Financial Sector Stocks | ||||||||||||||||||||||||||||||||||||||||||||||||
 The top performing Financial sector stocks year to date are
Now, more recently, over last week, the top performing Financial sector stocks on the move are


|
||||||||||||||||||||||||||||||||||||||||||||||||
| 12Stocks.com: Investing in Financial Sector using Exchange Traded Funds | |
|
The following table shows list of key exchange traded funds (ETF) that
help investors track Financial Index. For detailed view, check out our ETF Funds section of our website. Quick View: Move mouse or cursor over ETF symbol (ticker) to view short-term Technical chart and over ETF name to view long term chart. Click on ticker or stock name for detailed view. Click on to add stock symbol to your watchlist and to view watchlist. |
12Stocks.com List of ETFs that track Financial Index
| Ticker | ETF Name | Watchlist | Recent Price | Smart Investing & Trading Score | Change % | Week % | Year-to-date % |
| XLF | Financial | | 51.70 | 33 | -0.4 | 0.58 | 7.36% |
| IAI | Broker-Dealers & Secs | | 173.45 | 53 | -0.87 | 1.45 | 20.77% |
| KBE | Bank | | 56.27 | 51 | 0.52 | 1.83 | 2.16% |
| FAS | Financial Bull 3X | | 159.77 | 33 | -1.27 | 1.61 | 6.12% |
| FAZ | Financial Bear 3X | | 4.60 | 62 | 1.32 | -1.5 | -26.44% |
| UYG | Financials | | 92.14 | 26 | -0.79 | 0.92 | 8.14% |
| KIE | Insurance | | 56.82 | 35 | 0.71 | 1.99 | 1.03% |
| 12Stocks.com: Charts, Trends, Fundamental Data and Performances of Financial Stocks | |
|
We now take in-depth look at all Financial stocks including charts, multi-period performances and overall trends (as measured by Smart Investing & Trading Score). One can sort Financial stocks (click link to choose) by Daily, Weekly and by Year-to-Date performances. Also, one can sort by size of the company or by market capitalization. |
| Select Your Default Chart Type: | |||||
| |||||
| Click on stock symbol or name for detailed view. Click on to add stock symbol to your watchlist and to view watchlist. Quick View: Move mouse or cursor over "Daily" to quickly view daily Technical stock chart and over "Weekly" to view weekly Technical stock chart. | |||||

 | GSBC Great Southern Bancorp, Inc. |
| Sector: Financials | |
| SubSector: Regional - Southwest Banks | |
| MarketCap: 524.765 Millions | |
| Recent Price: 56.60 Smart Investing & Trading Score: 44 | |
| Day Percent Change: 0.77% Day Change: 0.43 | |
| Week Change: 1.09% Year-to-date Change: -4.5% | |
| GSBC Links: Profile News Message Board | |
| Charts:- Daily , Weekly | |
| Add GSBC to Watchlist: View: Get Complete GSBC Trend Analysis ➞ | |
 | DCOM Dime Community Bancshares, Inc. |
| Sector: Financials | |
| SubSector: Savings & Loans | |
| MarketCap: 477.83 Millions | |
| Recent Price: 27.63 Smart Investing & Trading Score: 44 | |
| Day Percent Change: 0.77% Day Change: 0.21 | |
| Week Change: 1.84% Year-to-date Change: -8.5% | |
| DCOM Links: Profile News Message Board | |
| Charts:- Daily , Weekly | |
| Add DCOM to Watchlist: View: Get Complete DCOM Trend Analysis ➞ | |
 | TSBK Timberland Bancorp, Inc. |
| Sector: Financials | |
| SubSector: Savings & Loans | |
| MarketCap: 155.03 Millions | |
| Recent Price: 31.38 Smart Investing & Trading Score: 44 | |
| Day Percent Change: 0.03% Day Change: 0.01 | |
| Week Change: 1.32% Year-to-date Change: 3.7% | |
| TSBK Links: Profile News Message Board | |
| Charts:- Daily , Weekly | |
| Add TSBK to Watchlist: View: Get Complete TSBK Trend Analysis ➞ | |
 | CTBI Community Trust Bancorp, Inc. |
| Sector: Financials | |
| SubSector: Regional - Southeast Banks | |
| MarketCap: 608.435 Millions | |
| Recent Price: 53.68 Smart Investing & Trading Score: 44 | |
| Day Percent Change: -0.24% Day Change: -0.13 | |
| Week Change: 1.07% Year-to-date Change: 2.2% | |
| CTBI Links: Profile News Message Board | |
| Charts:- Daily , Weekly | |
| Add CTBI to Watchlist: View: Get Complete CTBI Trend Analysis ➞ | |
 | BX The Blackstone Group Inc. |
| Sector: Financials | |
| SubSector: Asset Management | |
| MarketCap: 50957.7 Millions | |
| Recent Price: 167.68 Smart Investing & Trading Score: 44 | |
| Day Percent Change: -1.65% Day Change: -2.82 | |
| Week Change: -1.6% Year-to-date Change: -1.9% | |
| BX Links: Profile News Message Board | |
| Charts:- Daily , Weekly | |
| Add BX to Watchlist: View: Get Complete BX Trend Analysis ➞ | |
 | JXN Jackson Financial Inc. |
| Sector: Financials | |
| SubSector: Insurance - Life | |
| MarketCap: 2460 Millions | |
| Recent Price: 86.46 Smart Investing & Trading Score: 43 | |
| Day Percent Change: 2.14% Day Change: 1.81 | |
| Week Change: 2.86% Year-to-date Change: 0.3% | |
| JXN Links: Profile News Message Board | |
| Charts:- Daily , Weekly | |
| Add JXN to Watchlist: View: Get Complete JXN Trend Analysis ➞ | |
 | MPB Mid Penn Bancorp, Inc. |
| Sector: Financials | |
| SubSector: Regional - Northeast Banks | |
| MarketCap: 187.699 Millions | |
| Recent Price: 27.09 Smart Investing & Trading Score: 43 | |
| Day Percent Change: 1.23% Day Change: 0.33 | |
| Week Change: -0.07% Year-to-date Change: -5.4% | |
| MPB Links: Profile News Message Board | |
| Charts:- Daily , Weekly | |
| Add MPB to Watchlist: View: Get Complete MPB Trend Analysis ➞ | |
 | RNST Renasant Corporation |
| Sector: Financials | |
| SubSector: Money Center Banks | |
| MarketCap: 1279.39 Millions | |
| Recent Price: 36.38 Smart Investing & Trading Score: 43 | |
| Day Percent Change: 1.08% Day Change: 0.39 | |
| Week Change: 2.42% Year-to-date Change: 2.4% | |
| RNST Links: Profile News Message Board | |
| Charts:- Daily , Weekly | |
| Add RNST to Watchlist: View: Get Complete RNST Trend Analysis ➞ | |
 | CFFN Capitol Federal Financial, Inc. |
| Sector: Financials | |
| SubSector: Savings & Loans | |
| MarketCap: 1639.1 Millions | |
| Recent Price: 5.82 Smart Investing & Trading Score: 43 | |
| Day Percent Change: 0.87% Day Change: 0.05 | |
| Week Change: 1.57% Year-to-date Change: -0.2% | |
| CFFN Links: Profile News Message Board | |
| Charts:- Daily , Weekly | |
| Add CFFN to Watchlist: View: Get Complete CFFN Trend Analysis ➞ | |
 | WTFC Wintrust Financial Corporation |
| Sector: Financials | |
| SubSector: Regional - Midwest Banks | |
| MarketCap: 1942.6 Millions | |
| Recent Price: 125.82 Smart Investing & Trading Score: 43 | |
| Day Percent Change: 0.78% Day Change: 0.97 | |
| Week Change: 1.45% Year-to-date Change: 1.3% | |
| WTFC Links: Profile News Message Board | |
| Charts:- Daily , Weekly | |
| Add WTFC to Watchlist: View: Get Complete WTFC Trend Analysis ➞ | |
 | NBHC National Bank Holdings Corporation |
| Sector: Financials | |
| SubSector: Regional - Midwest Banks | |
| MarketCap: 766.87 Millions | |
| Recent Price: 36.77 Smart Investing & Trading Score: 43 | |
| Day Percent Change: 0.74% Day Change: 0.27 | |
| Week Change: 1.97% Year-to-date Change: -14.0% | |
| NBHC Links: Profile News Message Board | |
| Charts:- Daily , Weekly | |
| Add NBHC to Watchlist: View: Get Complete NBHC Trend Analysis ➞ | |
 | FSBW FS Bancorp, Inc. |
| Sector: Financials | |
| SubSector: Regional - Pacific Banks | |
| MarketCap: 140.429 Millions | |
| Recent Price: 39.07 Smart Investing & Trading Score: 43 | |
| Day Percent Change: 0.64% Day Change: 0.25 | |
| Week Change: 3.25% Year-to-date Change: -4.2% | |
| FSBW Links: Profile News Message Board | |
| Charts:- Daily , Weekly | |
| Add FSBW to Watchlist: View: Get Complete FSBW Trend Analysis ➞ | |
 | STEP StepStone Group Inc. |
| Sector: Financials | |
| SubSector: Asset Management | |
| MarketCap: 30757 Millions | |
| Recent Price: 58.43 Smart Investing & Trading Score: 43 | |
| Day Percent Change: 0.6% Day Change: 0.35 | |
| Week Change: 2.87% Year-to-date Change: 1.4% | |
| STEP Links: Profile News Message Board | |
| Charts:- Daily , Weekly | |
| Add STEP to Watchlist: View: Get Complete STEP Trend Analysis ➞ | |
 | COF Capital One Financial Corporation |
| Sector: Financials | |
| SubSector: Credit Services | |
| MarketCap: 23094.2 Millions | |
| Recent Price: 212.00 Smart Investing & Trading Score: 43 | |
| Day Percent Change: 0.57% Day Change: 1.21 | |
| Week Change: 2.18% Year-to-date Change: 19.2% | |
| COF Links: Profile News Message Board | |
| Charts:- Daily , Weekly | |
| Add COF to Watchlist: View: Get Complete COF Trend Analysis ➞ | |
 | EBC Eastern Bankshares, Inc. |
| Sector: Financials | |
| SubSector: Banks Regional | |
| MarketCap: 30057 Millions | |
| Recent Price: 15.31 Smart Investing & Trading Score: 43 | |
| Day Percent Change: 0.39% Day Change: 0.06 | |
| Week Change: 1.86% Year-to-date Change: -10.7% | |
| EBC Links: Profile News Message Board | |
| Charts:- Daily , Weekly | |
| Add EBC to Watchlist: View: Get Complete EBC Trend Analysis ➞ | |
 | USB U.S. Bancorp |
| Sector: Financials | |
| SubSector: Regional - Midwest Banks | |
| MarketCap: 56757.8 Millions | |
| Recent Price: 44.56 Smart Investing & Trading Score: 43 | |
| Day Percent Change: 0.32% Day Change: 0.14 | |
| Week Change: 1.41% Year-to-date Change: -5.7% | |
| USB Links: Profile News Message Board | |
| Charts:- Daily , Weekly | |
| Add USB to Watchlist: View: Get Complete USB Trend Analysis ➞ | |
 | OWL Blue Owl Capital Inc. |
| Sector: Financials | |
| SubSector: Asset Management | |
| MarketCap: 16240 Millions | |
| Recent Price: 19.35 Smart Investing & Trading Score: 43 | |
| Day Percent Change: 0% Day Change: 0 | |
| Week Change: 2.71% Year-to-date Change: -16.2% | |
| OWL Links: Profile News Message Board | |
| Charts:- Daily , Weekly | |
| Add OWL to Watchlist: View: Get Complete OWL Trend Analysis ➞ | |
 | BKU BankUnited, Inc. |
| Sector: Financials | |
| SubSector: Regional - Mid-Atlantic Banks | |
| MarketCap: 1905.99 Millions | |
| Recent Price: 35.80 Smart Investing & Trading Score: 43 | |
| Day Percent Change: 0% Day Change: 0 | |
| Week Change: 0.14% Year-to-date Change: -4.5% | |
| BKU Links: Profile News Message Board | |
| Charts:- Daily , Weekly | |
| Add BKU to Watchlist: View: Get Complete BKU Trend Analysis ➞ | |
 | CCBG Capital City Bank Group, Inc. |
| Sector: Financials | |
| SubSector: Regional - Mid-Atlantic Banks | |
| MarketCap: 314.459 Millions | |
| Recent Price: 38.89 Smart Investing & Trading Score: 43 | |
| Day Percent Change: -0.08% Day Change: -0.03 | |
| Week Change: 1.01% Year-to-date Change: 6.8% | |
| CCBG Links: Profile News Message Board | |
| Charts:- Daily , Weekly | |
| Add CCBG to Watchlist: View: Get Complete CCBG Trend Analysis ➞ | |
 | VBTX Veritex Holdings, Inc. |
| Sector: Financials | |
| SubSector: Regional - Southwest Banks | |
| MarketCap: 625.165 Millions | |
| Recent Price: 31.35 Smart Investing & Trading Score: 43 | |
| Day Percent Change: -0.16% Day Change: -0.05 | |
| Week Change: 1.39% Year-to-date Change: 16.3% | |
| VBTX Links: Profile News Message Board | |
| Charts:- Daily , Weekly | |
| Add VBTX to Watchlist: View: Get Complete VBTX Trend Analysis ➞ | |
 | CCNE CNB Financial Corporation |
| Sector: Financials | |
| SubSector: Regional - Northeast Banks | |
| MarketCap: 286.599 Millions | |
| Recent Price: 22.53 Smart Investing & Trading Score: 43 | |
| Day Percent Change: -0.18% Day Change: -0.04 | |
| Week Change: 0.22% Year-to-date Change: -8.7% | |
| CCNE Links: Profile News Message Board | |
| Charts:- Daily , Weekly | |
| Add CCNE to Watchlist: View: Get Complete CCNE Trend Analysis ➞ | |
 | ASB Associated Banc-Corp |
| Sector: Financials | |
| SubSector: Regional - Midwest Banks | |
| MarketCap: 1904.8 Millions | |
| Recent Price: 24.29 Smart Investing & Trading Score: 43 | |
| Day Percent Change: -0.41% Day Change: -0.1 | |
| Week Change: 0.83% Year-to-date Change: 2.6% | |
| ASB Links: Profile News Message Board | |
| Charts:- Daily , Weekly | |
| Add ASB to Watchlist: View: Get Complete ASB Trend Analysis ➞ | |
 | HBAN Huntington Bancshares Incorporated |
| Sector: Financials | |
| SubSector: Regional - Midwest Banks | |
| MarketCap: 8468.1 Millions | |
| Recent Price: 16.20 Smart Investing & Trading Score: 43 | |
| Day Percent Change: -0.43% Day Change: -0.07 | |
| Week Change: 1% Year-to-date Change: 0.6% | |
| HBAN Links: Profile News Message Board | |
| Charts:- Daily , Weekly | |
| Add HBAN to Watchlist: View: Get Complete HBAN Trend Analysis ➞ | |
 | ZION Zions Bancorporation, National Association |
| Sector: Financials | |
| SubSector: Regional - Pacific Banks | |
| MarketCap: 4577.89 Millions | |
| Recent Price: 52.47 Smart Investing & Trading Score: 43 | |
| Day Percent Change: -0.55% Day Change: -0.29 | |
| Week Change: 0.75% Year-to-date Change: -2.5% | |
| ZION Links: Profile News Message Board | |
| Charts:- Daily , Weekly | |
| Add ZION to Watchlist: View: Get Complete ZION Trend Analysis ➞ | |
 | CFG Citizens Financial Group, Inc. |
| Sector: Financials | |
| SubSector: Regional - Mid-Atlantic Banks | |
| MarketCap: 8225.19 Millions | |
| Recent Price: 47.30 Smart Investing & Trading Score: 43 | |
| Day Percent Change: -0.59% Day Change: -0.28 | |
| Week Change: 1.03% Year-to-date Change: 9.0% | |
| CFG Links: Profile News Message Board | |
| Charts:- Daily , Weekly | |
| Add CFG to Watchlist: View: Get Complete CFG Trend Analysis ➞ | |
| For tabular summary view of above stock list: Summary View ➞ 0 - 25 , 25 - 50 , 50 - 75 , 75 - 100 , 100 - 125 , 125 - 150 , 150 - 175 , 175 - 200 , 200 - 225 , 225 - 250 , 250 - 275 , 275 - 300 , 300 - 325 , 325 - 350 , 350 - 375 , 375 - 400 , 400 - 425 , 425 - 450 , 450 - 475 , 475 - 500 , 500 - 525 , 525 - 550 , 550 - 575 | ||
| Click To Change The Sort Order: By Market Cap or Company Size Performance: Year-to-date, Week and Day | |
| Select Chart Type: | ||
|
Best Stocks Today 12Stocks.com |
© 2025 12Stocks.com Terms & Conditions Privacy Contact Us
All Information Provided Only For Education And Not To Be Used For Investing or Trading. See Terms & Conditions


One More Thing ... Get Best Stocks Delivered Daily!
Never Ever Miss A Move With Our Top Ten Stocks Lists
Find Best Stocks In Any Market - Bull or Bear Market
Take A Peek At Our Top Ten Stocks Lists: Daily, Weekly, Year-to-Date & Top Trends
Find Best Stocks In Any Market - Bull or Bear Market
Take A Peek At Our Top Ten Stocks Lists: Daily, Weekly, Year-to-Date & Top Trends
Financial Stocks With Best Up Trends [0-bearish to 100-bullish]: Lemonade [100], MBIA [100], AlTi Global[100], Cushman & Wakefield[100], LGI Homes[100], Rocket [100], Tanger Factory[100], Mr. Cooper[100], CBL & Associates Properties[100], Hamilton Lane[100], Simon Property[100]
Best Financial Stocks Year-to-Date:
ESSA Bancorp[3207.77%], Easterly Government[107.23%], Mr. Cooper[97.21%], Heritage Insurance[79.01%], Root [72.94%], Industrial Logistics[70.13%], Rocket [69.21%], Diversified Healthcare[50.49%], ProAssurance [49.72%], World Acceptance[41.78%], XP [41.43%] Best Financial Stocks This Week:
Uniti [47.66%], Lemonade [31.68%], AlTi Global[24.1%], MBIA [20.54%], Industrial Logistics[14.9%], Cushman & Wakefield[12.24%], Tanger Factory[9.38%], Hippo [9.07%], Rocket [9.01%], LGI Homes[8.92%], eXp World[8.81%] Best Financial Stocks Daily:
Lemonade [29.54%], MBIA [22.5%], AlTi Global[18.05%], Cushman & Wakefield[8.69%], LGI Homes[8.6%], Rocket [6.81%], Alexander s[6.14%], Tanger Factory[5.97%], Brookfield Business[5.91%], Mr. Cooper[5.69%], B. Riley[5.38%]