
 Login Sign Up


| |||||
 |  | ||||

| 12Stocks.com Market Intelligence |
Best Financial Stocks
| In a hurry? Financial Stocks Lists: Performance Trends Table, Stock Charts
Sort Financial stocks: Daily, Weekly, Year-to-Date, Market Cap & Trends. Filter Financial stocks list by size:All Financial Large Mid-Range Small & MicroCap |
| 12Stocks.com Financial Stocks Performances & Trends Daily | |||||||||
|
|  The overall Smart Investing & Trading Score is 33 (0-bearish to 100-bullish) which puts Financial sector in short term bearish to neutral trend. The Smart Investing & Trading Score from previous trading session is 26 and an improvement of trend continues.
| ||||||||
Here are the Smart Investing & Trading Scores of the most requested Financial stocks at 12Stocks.com (click stock name for detailed review):
|


| 12Stocks.com: Investing in Financial sector with Stocks | |
|
The following table helps investors and traders sort through current performance and trends (as measured by Smart Investing & Trading Score) of various
stocks in the Financial sector. Quick View: Move mouse or cursor over stock symbol (ticker) to view short-term Technical chart and over stock name to view long term chart. Click on  to add stock symbol to your watchlist and to add stock symbol to your watchlist and  to view watchlist. Click on any ticker or stock name for detailed market intelligence report for that stock. to view watchlist. Click on any ticker or stock name for detailed market intelligence report for that stock. |
12Stocks.com Performance of Stocks in Financial Sector
| Ticker | Stock Name | Watchlist | Category | Recent Price | Trend Score | Change % | YTD Change% |
| IRT | Independence Realty |   | REIT | 17.24 | 50 | 3.23% | -12.44% |
| IIPR | Innovative Industrial | | REIT - Industrial | 52.29 | 50 | 1.24% | -19.12% |
| ROOT | Root | | Insurance Property & Casualty | 125.54 | 49 | 4.63% | 72.94% |
| FIHL | Fidelis Insurance | | Insurance - | 15.66 | 49 | 3.37% | -13.03% |
| HMN | Horace Mann | | Insurance | 42.06 | 49 | 0.38% | 8.12% |
| OMF | OneMain | | Credit Services | 56.21 | 48 | 0.66% | 9.84% |
| HWC | Hancock Whitney | | Regional Banks | 58.81 | 48 | -0.14% | 8.37% |
| ONL | Orion Office | | REIT - Office | 2.55 | 48 | -0.39% | -30.62% |
| KIM | Kimco Realty | | REIT - Retail | 21.29 | 48 | 1.14% | -8.06% |
| MS | Morgan Stanley | | Brokerage | 140.46 | 48 | -0.64% | 12.47% |
| JPM | JPMorgan Chase | | Banks | 291.37 | 48 | -0.98% | 22.93% |
| MA | Mastercard | | Credit Services | 566.04 | 47 | -0.66% | 7.83% |
| MLP | Maui Land | | Real Estatet | 16.58 | 46 | 0.67% | -24.57% |
| GCBC | Greene County | | S&L | 23.53 | 46 | 0.56% | -14.83% |
| WBS | Webster | | Regional Banks | 56.66 | 46 | 0.07% | 3.29% |
| SAMG | Silvercrest Asset | | Asset Mgmt | 16.14 | 46 | -0.98% | -11.18% |
| OVLY | Oak Valley | | Regional Banks | 26.20 | 46 | -1.32% | -9.38% |
| CIFR | Cipher Mining | | Capital Markets | 5.01 | 46 | -3.47% | 7.97% |
| OPAD | Offerpad | | Financials Services | 1.12 | 46 | -6.67% | -60.70% |
| SNV | Synovus | | Regional Banks | 47.95 | 45 | 2.15% | -5.63% |
| BLX | Banco Latinoamericano | | Foreign Banks | 40.84 | 45 | 0.67% | 16.66% |
| NNN | National Retail | | REIT - | 41.98 | 45 | -2.49% | 4.29% |
| TRNO | Terreno Realty | | REIT - Industrial | 55.48 | 45 | 1.11% | -5.46% |
| XP | XP | | Asset Mgmt | 16.76 | 44 | 0.42% | 41.43% |
| OSBC | Old Second | | Regional Banks | 17.02 | 44 | 1.31% | -3.60% |
| For chart view version of above stock list: Chart View ➞ 0 - 25 , 25 - 50 , 50 - 75 , 75 - 100 , 100 - 125 , 125 - 150 , 150 - 175 , 175 - 200 , 200 - 225 , 225 - 250 , 250 - 275 , 275 - 300 , 300 - 325 , 325 - 350 , 350 - 375 , 375 - 400 , 400 - 425 , 425 - 450 , 450 - 475 , 475 - 500 , 500 - 525 , 525 - 550 , 550 - 575 | ||
 | Click To Change The Sort Order: By Market Cap or Company Size Performance: Year-to-date, Week and Day |  |
|
Get the most comprehensive stock market coverage daily at 12Stocks.com ➞ Best Stocks Today ➞ Best Stocks Weekly ➞ Best Stocks Year-to-Date ➞ Best Stocks Trends ➞  Best Stocks Today 12Stocks.com Best Nasdaq Stocks ➞ Best S&P 500 Stocks ➞ Best Tech Stocks ➞ Best Biotech Stocks ➞ |
| Detailed Overview of Financial Stocks |
| Financial Technical Overview, Leaders & Laggards, Top Financial ETF Funds & Detailed Financial Stocks List, Charts, Trends & More |
| Financial Sector: Technical Analysis, Trends & YTD Performance | |
| Financial sector is composed of stocks
from banks, brokers, insurance, REITs
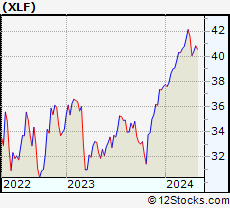
and services subsectors. Financial sector, as represented by XLF, an exchange-traded fund [ETF] that holds basket of Financial stocks (e.g, Bank of America, Goldman Sachs) is up by 7.36% and is currently outperforming the overall market by 0.31% year-to-date. Below is a quick view of Technical charts and trends: |
|
 XLF Weekly Chart |
|
| Long Term Trend: Good | |
| Medium Term Trend: Not Good | |
 XLF Daily Chart |
|
| Short Term Trend: Not Good | |
| Overall Trend Score: 33 | |
| YTD Performance: 7.36% | |
| **Trend Scores & Views Are Only For Educational Purposes And Not For Investing | |
| 12Stocks.com: Top Performing Financial Sector Stocks | ||||||||||||||||||||||||||||||||||||||||||||||||
 The top performing Financial sector stocks year to date are
Now, more recently, over last week, the top performing Financial sector stocks on the move are


|
||||||||||||||||||||||||||||||||||||||||||||||||
| 12Stocks.com: Investing in Financial Sector using Exchange Traded Funds | |
|
The following table shows list of key exchange traded funds (ETF) that
help investors track Financial Index. For detailed view, check out our ETF Funds section of our website. Quick View: Move mouse or cursor over ETF symbol (ticker) to view short-term Technical chart and over ETF name to view long term chart. Click on ticker or stock name for detailed view. Click on to add stock symbol to your watchlist and to view watchlist. |
12Stocks.com List of ETFs that track Financial Index
| Ticker | ETF Name | Watchlist | Recent Price | Smart Investing & Trading Score | Change % | Week % | Year-to-date % |
| XLF | Financial | | 51.70 | 33 | -0.4 | 0.58 | 7.36% |
| IAI | Broker-Dealers & Secs | | 173.45 | 53 | -0.87 | 1.45 | 20.77% |
| KBE | Bank | | 56.27 | 51 | 0.52 | 1.83 | 2.16% |
| FAS | Financial Bull 3X | | 159.77 | 33 | -1.27 | 1.61 | 6.12% |
| FAZ | Financial Bear 3X | | 4.60 | 62 | 1.32 | -1.5 | -26.44% |
| UYG | Financials | | 92.14 | 26 | -0.79 | 0.92 | 8.14% |
| KIE | Insurance | | 56.82 | 35 | 0.71 | 1.99 | 1.03% |
| 12Stocks.com: Charts, Trends, Fundamental Data and Performances of Financial Stocks | |
|
We now take in-depth look at all Financial stocks including charts, multi-period performances and overall trends (as measured by Smart Investing & Trading Score). One can sort Financial stocks (click link to choose) by Daily, Weekly and by Year-to-Date performances. Also, one can sort by size of the company or by market capitalization. |
| Select Your Default Chart Type: | |||||
| |||||
| Click on stock symbol or name for detailed view. Click on to add stock symbol to your watchlist and to view watchlist. Quick View: Move mouse or cursor over "Daily" to quickly view daily Technical stock chart and over "Weekly" to view weekly Technical stock chart. | |||||

 | IRT Independence Realty Trust, Inc. |
| Sector: Financials | |
| SubSector: REIT - Residential | |
| MarketCap: 980.161 Millions | |
| Recent Price: 17.24 Smart Investing & Trading Score: 50 | |
| Day Percent Change: 3.23% Day Change: 0.54 | |
| Week Change: 2.86% Year-to-date Change: -12.4% | |
| IRT Links: Profile News Message Board | |
| Charts:- Daily , Weekly | |
| Add IRT to Watchlist: View: Get Complete IRT Trend Analysis ➞ | |
 | IIPR Innovative Industrial Properties, Inc. |
| Sector: Financials | |
| SubSector: REIT - Industrial | |
| MarketCap: 1193.29 Millions | |
| Recent Price: 52.29 Smart Investing & Trading Score: 50 | |
| Day Percent Change: 1.24% Day Change: 0.64 | |
| Week Change: 1.79% Year-to-date Change: -19.1% | |
| IIPR Links: Profile News Message Board | |
| Charts:- Daily , Weekly | |
| Add IIPR to Watchlist: View: Get Complete IIPR Trend Analysis ➞ | |
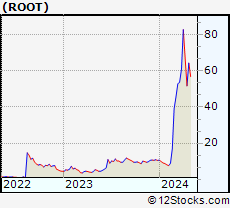 | ROOT Root, Inc. |
| Sector: Financials | |
| SubSector: Insurance Property & Casualty | |
| MarketCap: 35257 Millions | |
| Recent Price: 125.54 Smart Investing & Trading Score: 49 | |
| Day Percent Change: 4.63% Day Change: 5.55 | |
| Week Change: 7.56% Year-to-date Change: 72.9% | |
| ROOT Links: Profile News Message Board | |
| Charts:- Daily , Weekly | |
| Add ROOT to Watchlist: View: Get Complete ROOT Trend Analysis ➞ | |
 | FIHL Fidelis Insurance Holdings Limited |
| Sector: Financials | |
| SubSector: Insurance - Diversified | |
| MarketCap: 1590 Millions | |
| Recent Price: 15.66 Smart Investing & Trading Score: 49 | |
| Day Percent Change: 3.37% Day Change: 0.51 | |
| Week Change: 5.31% Year-to-date Change: -13.0% | |
| FIHL Links: Profile News Message Board | |
| Charts:- Daily , Weekly | |
| Add FIHL to Watchlist: View: Get Complete FIHL Trend Analysis ➞ | |
 | HMN Horace Mann Educators Corporation |
| Sector: Financials | |
| SubSector: Property & Casualty Insurance | |
| MarketCap: 1545.52 Millions | |
| Recent Price: 42.06 Smart Investing & Trading Score: 49 | |
| Day Percent Change: 0.38% Day Change: 0.16 | |
| Week Change: 1.91% Year-to-date Change: 8.1% | |
| HMN Links: Profile News Message Board | |
| Charts:- Daily , Weekly | |
| Add HMN to Watchlist: View: Get Complete HMN Trend Analysis ➞ | |
 | OMF OneMain Holdings, Inc. |
| Sector: Financials | |
| SubSector: Credit Services | |
| MarketCap: 2753.38 Millions | |
| Recent Price: 56.21 Smart Investing & Trading Score: 48 | |
| Day Percent Change: 0.66% Day Change: 0.37 | |
| Week Change: -0.5% Year-to-date Change: 9.8% | |
| OMF Links: Profile News Message Board | |
| Charts:- Daily , Weekly | |
| Add OMF to Watchlist: View: Get Complete OMF Trend Analysis ➞ | |
 | HWC Hancock Whitney Corporation |
| Sector: Financials | |
| SubSector: Regional - Southeast Banks | |
| MarketCap: 1438.55 Millions | |
| Recent Price: 58.81 Smart Investing & Trading Score: 48 | |
| Day Percent Change: -0.14% Day Change: -0.08 | |
| Week Change: 2.03% Year-to-date Change: 8.4% | |
| HWC Links: Profile News Message Board | |
| Charts:- Daily , Weekly | |
| Add HWC to Watchlist: View: Get Complete HWC Trend Analysis ➞ | |
 | ONL Orion Office REIT Inc. |
| Sector: Financials | |
| SubSector: REIT - Office | |
| MarketCap: 375 Millions | |
| Recent Price: 2.55 Smart Investing & Trading Score: 48 | |
| Day Percent Change: -0.39% Day Change: -0.01 | |
| Week Change: -1.54% Year-to-date Change: -30.6% | |
| ONL Links: Profile News Message Board | |
| Charts:- Daily , Weekly | |
| Add ONL to Watchlist: View: Get Complete ONL Trend Analysis ➞ | |
 | KIM Kimco Realty Corporation |
| Sector: Financials | |
| SubSector: REIT - Retail | |
| MarketCap: 5358.64 Millions | |
| Recent Price: 21.29 Smart Investing & Trading Score: 48 | |
| Day Percent Change: 1.14% Day Change: 0.24 | |
| Week Change: 2.65% Year-to-date Change: -8.1% | |
| KIM Links: Profile News Message Board | |
| Charts:- Daily , Weekly | |
| Add KIM to Watchlist: View: Get Complete KIM Trend Analysis ➞ | |
 | MS Morgan Stanley |
| Sector: Financials | |
| SubSector: Investment Brokerage - National | |
| MarketCap: 55876.7 Millions | |
| Recent Price: 140.46 Smart Investing & Trading Score: 48 | |
| Day Percent Change: -0.64% Day Change: -0.9 | |
| Week Change: 0.98% Year-to-date Change: 12.5% | |
| MS Links: Profile News Message Board | |
| Charts:- Daily , Weekly | |
| Add MS to Watchlist: View: Get Complete MS Trend Analysis ➞ | |
 | JPM JPMorgan Chase & Co. |
| Sector: Financials | |
| SubSector: Money Center Banks | |
| MarketCap: 279736 Millions | |
| Recent Price: 291.37 Smart Investing & Trading Score: 48 | |
| Day Percent Change: -0.98% Day Change: -2.89 | |
| Week Change: 0.69% Year-to-date Change: 22.9% | |
| JPM Links: Profile News Message Board | |
| Charts:- Daily , Weekly | |
| Add JPM to Watchlist: View: Get Complete JPM Trend Analysis ➞ | |
 | MA Mastercard Incorporated |
| Sector: Financials | |
| SubSector: Credit Services | |
| MarketCap: 234809 Millions | |
| Recent Price: 566.04 Smart Investing & Trading Score: 47 | |
| Day Percent Change: -0.66% Day Change: -3.77 | |
| Week Change: 1.1% Year-to-date Change: 7.8% | |
| MA Links: Profile News Message Board | |
| Charts:- Daily , Weekly | |
| Add MA to Watchlist: View: Get Complete MA Trend Analysis ➞ | |
 | MLP Maui Land & Pineapple Company, Inc. |
| Sector: Financials | |
| SubSector: Real Estate Development | |
| MarketCap: 186.619 Millions | |
| Recent Price: 16.58 Smart Investing & Trading Score: 46 | |
| Day Percent Change: 0.67% Day Change: 0.11 | |
| Week Change: 1.04% Year-to-date Change: -24.6% | |
| MLP Links: Profile News Message Board | |
| Charts:- Daily , Weekly | |
| Add MLP to Watchlist: View: Get Complete MLP Trend Analysis ➞ | |
 | GCBC Greene County Bancorp, Inc. |
| Sector: Financials | |
| SubSector: Savings & Loans | |
| MarketCap: 314.83 Millions | |
| Recent Price: 23.53 Smart Investing & Trading Score: 46 | |
| Day Percent Change: 0.56% Day Change: 0.13 | |
| Week Change: 1.99% Year-to-date Change: -14.8% | |
| GCBC Links: Profile News Message Board | |
| Charts:- Daily , Weekly | |
| Add GCBC to Watchlist: View: Get Complete GCBC Trend Analysis ➞ | |
 | WBS Webster Financial Corporation |
| Sector: Financials | |
| SubSector: Regional - Northeast Banks | |
| MarketCap: 2111.59 Millions | |
| Recent Price: 56.66 Smart Investing & Trading Score: 46 | |
| Day Percent Change: 0.07% Day Change: 0.04 | |
| Week Change: 1.16% Year-to-date Change: 3.3% | |
| WBS Links: Profile News Message Board | |
| Charts:- Daily , Weekly | |
| Add WBS to Watchlist: View: Get Complete WBS Trend Analysis ➞ | |
 | SAMG Silvercrest Asset Management Group Inc. |
| Sector: Financials | |
| SubSector: Asset Management | |
| MarketCap: 116.303 Millions | |
| Recent Price: 16.14 Smart Investing & Trading Score: 46 | |
| Day Percent Change: -0.98% Day Change: -0.16 | |
| Week Change: 1.7% Year-to-date Change: -11.2% | |
| SAMG Links: Profile News Message Board | |
| Charts:- Daily , Weekly | |
| Add SAMG to Watchlist: View: Get Complete SAMG Trend Analysis ➞ | |
 | OVLY Oak Valley Bancorp |
| Sector: Financials | |
| SubSector: Regional - Pacific Banks | |
| MarketCap: 148.429 Millions | |
| Recent Price: 26.20 Smart Investing & Trading Score: 46 | |
| Day Percent Change: -1.32% Day Change: -0.35 | |
| Week Change: -0.72% Year-to-date Change: -9.4% | |
| OVLY Links: Profile News Message Board | |
| Charts:- Daily , Weekly | |
| Add OVLY to Watchlist: View: Get Complete OVLY Trend Analysis ➞ | |
 | CIFR Cipher Mining Inc. |
| Sector: Financials | |
| SubSector: Capital Markets | |
| MarketCap: 712 Millions | |
| Recent Price: 5.01 Smart Investing & Trading Score: 46 | |
| Day Percent Change: -3.47% Day Change: -0.18 | |
| Week Change: 1.62% Year-to-date Change: 8.0% | |
| CIFR Links: Profile News Message Board | |
| Charts:- Daily , Weekly | |
| Add CIFR to Watchlist: View: Get Complete CIFR Trend Analysis ➞ | |
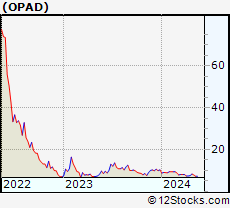 | OPAD Offerpad Solutions Inc. |
| Sector: Financials | |
| SubSector: Financials Services | |
| MarketCap: 345 Millions | |
| Recent Price: 1.12 Smart Investing & Trading Score: 46 | |
| Day Percent Change: -6.67% Day Change: -0.08 | |
| Week Change: -8.2% Year-to-date Change: -60.7% | |
| OPAD Links: Profile News Message Board | |
| Charts:- Daily , Weekly | |
| Add OPAD to Watchlist: View: Get Complete OPAD Trend Analysis ➞ | |
 | SNV Synovus Financial Corp. |
| Sector: Financials | |
| SubSector: Regional - Mid-Atlantic Banks | |
| MarketCap: 2697.29 Millions | |
| Recent Price: 47.95 Smart Investing & Trading Score: 45 | |
| Day Percent Change: 2.15% Day Change: 1.01 | |
| Week Change: 3.01% Year-to-date Change: -5.6% | |
| SNV Links: Profile News Message Board | |
| Charts:- Daily , Weekly | |
| Add SNV to Watchlist: View: Get Complete SNV Trend Analysis ➞ | |
 | BLX Banco Latinoamericano de Comercio Exterior, S.A |
| Sector: Financials | |
| SubSector: Foreign Money Center Banks | |
| MarketCap: 390.471 Millions | |
| Recent Price: 40.84 Smart Investing & Trading Score: 45 | |
| Day Percent Change: 0.67% Day Change: 0.27 | |
| Week Change: 3.84% Year-to-date Change: 16.7% | |
| BLX Links: Profile News Message Board | |
| Charts:- Daily , Weekly | |
| Add BLX to Watchlist: View: Get Complete BLX Trend Analysis ➞ | |
 | NNN National Retail Properties, Inc. |
| Sector: Financials | |
| SubSector: REIT - Diversified | |
| MarketCap: 5459.93 Millions | |
| Recent Price: 41.98 Smart Investing & Trading Score: 45 | |
| Day Percent Change: -2.49% Day Change: -1.07 | |
| Week Change: -0.1% Year-to-date Change: 4.3% | |
| NNN Links: Profile News Message Board | |
| Charts:- Daily , Weekly | |
| Add NNN to Watchlist: View: Get Complete NNN Trend Analysis ➞ | |
 | TRNO Terreno Realty Corporation |
| Sector: Financials | |
| SubSector: REIT - Industrial | |
| MarketCap: 3359.69 Millions | |
| Recent Price: 55.48 Smart Investing & Trading Score: 45 | |
| Day Percent Change: 1.11% Day Change: 0.61 | |
| Week Change: 2.23% Year-to-date Change: -5.5% | |
| TRNO Links: Profile News Message Board | |
| Charts:- Daily , Weekly | |
| Add TRNO to Watchlist: View: Get Complete TRNO Trend Analysis ➞ | |
 | XP XP Inc. |
| Sector: Financials | |
| SubSector: Asset Management | |
| MarketCap: 12990.3 Millions | |
| Recent Price: 16.76 Smart Investing & Trading Score: 44 | |
| Day Percent Change: 0.42% Day Change: 0.07 | |
| Week Change: 2.48% Year-to-date Change: 41.4% | |
| XP Links: Profile News Message Board | |
| Charts:- Daily , Weekly | |
| Add XP to Watchlist: View: Get Complete XP Trend Analysis ➞ | |
 | OSBC Old Second Bancorp, Inc. |
| Sector: Financials | |
| SubSector: Regional - Midwest Banks | |
| MarketCap: 237.17 Millions | |
| Recent Price: 17.02 Smart Investing & Trading Score: 44 | |
| Day Percent Change: 1.31% Day Change: 0.22 | |
| Week Change: 2.59% Year-to-date Change: -3.6% | |
| OSBC Links: Profile News Message Board | |
| Charts:- Daily , Weekly | |
| Add OSBC to Watchlist: View: Get Complete OSBC Trend Analysis ➞ | |
| For tabular summary view of above stock list: Summary View ➞ 0 - 25 , 25 - 50 , 50 - 75 , 75 - 100 , 100 - 125 , 125 - 150 , 150 - 175 , 175 - 200 , 200 - 225 , 225 - 250 , 250 - 275 , 275 - 300 , 300 - 325 , 325 - 350 , 350 - 375 , 375 - 400 , 400 - 425 , 425 - 450 , 450 - 475 , 475 - 500 , 500 - 525 , 525 - 550 , 550 - 575 | ||
| Click To Change The Sort Order: By Market Cap or Company Size Performance: Year-to-date, Week and Day | |
| Select Chart Type: | ||
|
Best Stocks Today 12Stocks.com |
© 2025 12Stocks.com Terms & Conditions Privacy Contact Us
All Information Provided Only For Education And Not To Be Used For Investing or Trading. See Terms & Conditions


One More Thing ... Get Best Stocks Delivered Daily!
Never Ever Miss A Move With Our Top Ten Stocks Lists
Find Best Stocks In Any Market - Bull or Bear Market
Take A Peek At Our Top Ten Stocks Lists: Daily, Weekly, Year-to-Date & Top Trends
Find Best Stocks In Any Market - Bull or Bear Market
Take A Peek At Our Top Ten Stocks Lists: Daily, Weekly, Year-to-Date & Top Trends
Financial Stocks With Best Up Trends [0-bearish to 100-bullish]: Lemonade [100], MBIA [100], AlTi Global[100], Cushman & Wakefield[100], LGI Homes[100], Rocket [100], Tanger Factory[100], Mr. Cooper[100], CBL & Associates Properties[100], Hamilton Lane[100], Simon Property[100]
Best Financial Stocks Year-to-Date:
ESSA Bancorp[3207.77%], Easterly Government[107.23%], Mr. Cooper[97.21%], Heritage Insurance[79.01%], Root [72.94%], Industrial Logistics[70.13%], Rocket [69.21%], Diversified Healthcare[50.49%], ProAssurance [49.72%], World Acceptance[41.78%], XP [41.43%] Best Financial Stocks This Week:
Uniti [47.66%], Lemonade [31.68%], AlTi Global[24.1%], MBIA [20.54%], Industrial Logistics[14.9%], Cushman & Wakefield[12.24%], Tanger Factory[9.38%], Hippo [9.07%], Rocket [9.01%], LGI Homes[8.92%], eXp World[8.81%] Best Financial Stocks Daily:
Lemonade [29.54%], MBIA [22.5%], AlTi Global[18.05%], Cushman & Wakefield[8.69%], LGI Homes[8.6%], Rocket [6.81%], Alexander s[6.14%], Tanger Factory[5.97%], Brookfield Business[5.91%], Mr. Cooper[5.69%], B. Riley[5.38%]