
 Login Sign Up


| |||||
 |  | ||||

| 12Stocks.com Market Intelligence |
Best Financial Stocks
| In a hurry? Financial Stocks Lists: Performance Trends Table, Stock Charts
Sort Financial stocks: Daily, Weekly, Year-to-Date, Market Cap & Trends. Filter Financial stocks list by size:All Financial Large Mid-Range Small & MicroCap |
| 12Stocks.com Financial Stocks Performances & Trends Daily | |||||||||
|
|  The overall Smart Investing & Trading Score is 33 (0-bearish to 100-bullish) which puts Financial sector in short term bearish to neutral trend. The Smart Investing & Trading Score from previous trading session is 26 and an improvement of trend continues.
| ||||||||
Here are the Smart Investing & Trading Scores of the most requested Financial stocks at 12Stocks.com (click stock name for detailed review):
|


| 12Stocks.com: Investing in Financial sector with Stocks | |
|
The following table helps investors and traders sort through current performance and trends (as measured by Smart Investing & Trading Score) of various
stocks in the Financial sector. Quick View: Move mouse or cursor over stock symbol (ticker) to view short-term Technical chart and over stock name to view long term chart. Click on  to add stock symbol to your watchlist and to add stock symbol to your watchlist and  to view watchlist. Click on any ticker or stock name for detailed market intelligence report for that stock. to view watchlist. Click on any ticker or stock name for detailed market intelligence report for that stock. |
12Stocks.com Performance of Stocks in Financial Sector
| Ticker | Stock Name | Watchlist | Category | Recent Price | Trend Score | Change % | YTD Change% |
| EFSC | Enterprise |   | Regional - Southwest Banks | 55.26 | 51 | 1.88% | -1.50% |
| BY | Byline Bancorp | | Regional Banks | 26.19 | 51 | 1.51% | -9.38% |
| ATLC | Atlanticus | | Credit Services | 49.57 | 51 | 1.31% | -11.13% |
| ENVA | Enova | | Credit Services | 103.92 | 51 | 1.29% | 8.39% |
| HBNC | Horizon Bancorp | | Regional Banks | 15.39 | 51 | 1.25% | -2.37% |
| LCNB | LCNB | | Regional Banks | 14.74 | 51 | 1.03% | -1.17% |
| NU | Nu | | Banks - | 12.15 | 51 | 1.00% | 17.28% |
| FMNB | Farmers National | | Regional Banks | 13.47 | 51 | 0.90% | -4.03% |
| TOWN | TowneBank | | Regional Banks | 35.23 | 51 | 0.69% | 4.19% |
| WSFS | WSFS | | Regional Banks | 54.60 | 51 | 0.61% | 3.03% |
| PVBC | Provident Bancorp | | Banks | 12.24 | 51 | 0.41% | 7.37% |
| TRMK | Trustmark | | Regional Banks | 37.01 | 51 | 0.33% | 5.33% |
| SHBI | Shore Bancshares | | Regional Banks | 15.45 | 51 | 0.26% | -1.81% |
| THFF | First | | Regional Banks | 53.32 | 51 | 0.17% | 17.96% |
| FHN | First Horizon | | Regional Banks | 21.68 | 51 | 0.05% | 8.53% |
| SFBS | ServisFirst Bancshares | | Foreign Banks | 78.30 | 51 | 0.03% | -6.86% |
| FRBA | First Bank | | Regional Banks | 14.98 | 51 | 0.00% | 6.88% |
| RF | Regions | | Regional Banks | 25.18 | 51 | 0.00% | 8.20% |
| MTB | M&T Bank | | Regional Banks | 188.04 | 51 | -0.13% | 0.73% |
| PDLB | PDL Community | | REIT - Retail | 14.06 | 51 | -0.42% | 8.15% |
| CG | Carlyle | | Asset Mgmt | 60.10 | 51 | -0.55% | 19.84% |
| SEIC | SEI s | | Asset Mgmt | 87.81 | 51 | -0.60% | 6.46% |
| SOFI | SoFi Technologies | | Credit Services | 21.54 | 50 | -1.24% | 39.87% |
| KKR | KKR | | Asset Mgmt | 142.66 | 50 | -1.70% | -3.43% |
| GEO | GEO | | REIT | 25.84 | 50 | 3.78% | -7.65% |
| For chart view version of above stock list: Chart View ➞ 0 - 25 , 25 - 50 , 50 - 75 , 75 - 100 , 100 - 125 , 125 - 150 , 150 - 175 , 175 - 200 , 200 - 225 , 225 - 250 , 250 - 275 , 275 - 300 , 300 - 325 , 325 - 350 , 350 - 375 , 375 - 400 , 400 - 425 , 425 - 450 , 450 - 475 , 475 - 500 , 500 - 525 , 525 - 550 , 550 - 575 | ||
 | Click To Change The Sort Order: By Market Cap or Company Size Performance: Year-to-date, Week and Day |  |
|
Get the most comprehensive stock market coverage daily at 12Stocks.com ➞ Best Stocks Today ➞ Best Stocks Weekly ➞ Best Stocks Year-to-Date ➞ Best Stocks Trends ➞  Best Stocks Today 12Stocks.com Best Nasdaq Stocks ➞ Best S&P 500 Stocks ➞ Best Tech Stocks ➞ Best Biotech Stocks ➞ |
| Detailed Overview of Financial Stocks |
| Financial Technical Overview, Leaders & Laggards, Top Financial ETF Funds & Detailed Financial Stocks List, Charts, Trends & More |
| Financial Sector: Technical Analysis, Trends & YTD Performance | |
| Financial sector is composed of stocks
from banks, brokers, insurance, REITs
and services subsectors. Financial sector, as represented by XLF, an exchange-traded fund [ETF] that holds basket of Financial stocks (e.g, Bank of America, Goldman Sachs) is up by 7.36% and is currently outperforming the overall market by 0.31% year-to-date. Below is a quick view of Technical charts and trends: |
|
 XLF Weekly Chart |
|
| Long Term Trend: Good | |
| Medium Term Trend: Not Good | |
 XLF Daily Chart |
|
| Short Term Trend: Not Good | |
| Overall Trend Score: 33 | |
| YTD Performance: 7.36% | |
| **Trend Scores & Views Are Only For Educational Purposes And Not For Investing | |
| 12Stocks.com: Top Performing Financial Sector Stocks | ||||||||||||||||||||||||||||||||||||||||||||||||
 The top performing Financial sector stocks year to date are
Now, more recently, over last week, the top performing Financial sector stocks on the move are


|
||||||||||||||||||||||||||||||||||||||||||||||||
| 12Stocks.com: Investing in Financial Sector using Exchange Traded Funds | |
|
The following table shows list of key exchange traded funds (ETF) that
help investors track Financial Index. For detailed view, check out our ETF Funds section of our website. Quick View: Move mouse or cursor over ETF symbol (ticker) to view short-term Technical chart and over ETF name to view long term chart. Click on ticker or stock name for detailed view. Click on to add stock symbol to your watchlist and to view watchlist. |
12Stocks.com List of ETFs that track Financial Index
| Ticker | ETF Name | Watchlist | Recent Price | Smart Investing & Trading Score | Change % | Week % | Year-to-date % |
| XLF | Financial | | 51.70 | 33 | -0.4 | 0.58 | 7.36% |
| IAI | Broker-Dealers & Secs | | 173.45 | 53 | -0.87 | 1.45 | 20.77% |
| KBE | Bank | | 56.27 | 51 | 0.52 | 1.83 | 2.16% |
| FAS | Financial Bull 3X | | 159.77 | 33 | -1.27 | 1.61 | 6.12% |
| FAZ | Financial Bear 3X | | 4.60 | 62 | 1.32 | -1.5 | -26.44% |
| UYG | Financials | | 92.14 | 26 | -0.79 | 0.92 | 8.14% |
| KIE | Insurance | | 56.82 | 35 | 0.71 | 1.99 | 1.03% |
| 12Stocks.com: Charts, Trends, Fundamental Data and Performances of Financial Stocks | |
|
We now take in-depth look at all Financial stocks including charts, multi-period performances and overall trends (as measured by Smart Investing & Trading Score). One can sort Financial stocks (click link to choose) by Daily, Weekly and by Year-to-Date performances. Also, one can sort by size of the company or by market capitalization. |
| Select Your Default Chart Type: | |||||
| |||||
| Click on stock symbol or name for detailed view. Click on to add stock symbol to your watchlist and to view watchlist. Quick View: Move mouse or cursor over "Daily" to quickly view daily Technical stock chart and over "Weekly" to view weekly Technical stock chart. | |||||

 | EFSC Enterprise Financial Services Corp |
| Sector: Financials | |
| SubSector: Regional - Southwest Banks | |
| MarketCap: 770.165 Millions | |
| Recent Price: 55.26 Smart Investing & Trading Score: 51 | |
| Day Percent Change: 1.88% Day Change: 1.02 | |
| Week Change: 2.69% Year-to-date Change: -1.5% | |
| EFSC Links: Profile News Message Board | |
| Charts:- Daily , Weekly | |
| Add EFSC to Watchlist: View: Get Complete EFSC Trend Analysis ➞ | |
 | BY Byline Bancorp, Inc. |
| Sector: Financials | |
| SubSector: Regional - Midwest Banks | |
| MarketCap: 381.87 Millions | |
| Recent Price: 26.19 Smart Investing & Trading Score: 51 | |
| Day Percent Change: 1.51% Day Change: 0.39 | |
| Week Change: 2.26% Year-to-date Change: -9.4% | |
| BY Links: Profile News Message Board | |
| Charts:- Daily , Weekly | |
| Add BY to Watchlist: View: Get Complete BY Trend Analysis ➞ | |
 | ATLC Atlanticus Holdings Corporation |
| Sector: Financials | |
| SubSector: Credit Services | |
| MarketCap: 122.008 Millions | |
| Recent Price: 49.57 Smart Investing & Trading Score: 51 | |
| Day Percent Change: 1.31% Day Change: 0.64 | |
| Week Change: 3.23% Year-to-date Change: -11.1% | |
| ATLC Links: Profile News Message Board | |
| Charts:- Daily , Weekly | |
| Add ATLC to Watchlist: View: Get Complete ATLC Trend Analysis ➞ | |
 | ENVA Enova International, Inc. |
| Sector: Financials | |
| SubSector: Credit Services | |
| MarketCap: 345.508 Millions | |
| Recent Price: 103.92 Smart Investing & Trading Score: 51 | |
| Day Percent Change: 1.29% Day Change: 1.32 | |
| Week Change: 3.34% Year-to-date Change: 8.4% | |
| ENVA Links: Profile News Message Board | |
| Charts:- Daily , Weekly | |
| Add ENVA to Watchlist: View: Get Complete ENVA Trend Analysis ➞ | |
 | HBNC Horizon Bancorp, Inc. |
| Sector: Financials | |
| SubSector: Regional - Northeast Banks | |
| MarketCap: 405.999 Millions | |
| Recent Price: 15.39 Smart Investing & Trading Score: 51 | |
| Day Percent Change: 1.25% Day Change: 0.19 | |
| Week Change: 2.53% Year-to-date Change: -2.4% | |
| HBNC Links: Profile News Message Board | |
| Charts:- Daily , Weekly | |
| Add HBNC to Watchlist: View: Get Complete HBNC Trend Analysis ➞ | |
 | LCNB LCNB Corp. |
| Sector: Financials | |
| SubSector: Regional - Mid-Atlantic Banks | |
| MarketCap: 176.759 Millions | |
| Recent Price: 14.74 Smart Investing & Trading Score: 51 | |
| Day Percent Change: 1.03% Day Change: 0.15 | |
| Week Change: 3.8% Year-to-date Change: -1.2% | |
| LCNB Links: Profile News Message Board | |
| Charts:- Daily , Weekly | |
| Add LCNB to Watchlist: View: Get Complete LCNB Trend Analysis ➞ | |
 | NU Nu Holdings Ltd. |
| Sector: Financials | |
| SubSector: Banks - Diversified | |
| MarketCap: 37240 Millions | |
| Recent Price: 12.15 Smart Investing & Trading Score: 51 | |
| Day Percent Change: 1% Day Change: 0.12 | |
| Week Change: 0.83% Year-to-date Change: 17.3% | |
| NU Links: Profile News Message Board | |
| Charts:- Daily , Weekly | |
| Add NU to Watchlist: View: Get Complete NU Trend Analysis ➞ | |
 | FMNB Farmers National Banc Corp. |
| Sector: Financials | |
| SubSector: Regional - Midwest Banks | |
| MarketCap: 366.57 Millions | |
| Recent Price: 13.47 Smart Investing & Trading Score: 51 | |
| Day Percent Change: 0.9% Day Change: 0.12 | |
| Week Change: 2.12% Year-to-date Change: -4.0% | |
| FMNB Links: Profile News Message Board | |
| Charts:- Daily , Weekly | |
| Add FMNB to Watchlist: View: Get Complete FMNB Trend Analysis ➞ | |
 | TOWN TowneBank |
| Sector: Financials | |
| SubSector: Regional - Mid-Atlantic Banks | |
| MarketCap: 1344.09 Millions | |
| Recent Price: 35.23 Smart Investing & Trading Score: 51 | |
| Day Percent Change: 0.69% Day Change: 0.24 | |
| Week Change: 2.15% Year-to-date Change: 4.2% | |
| TOWN Links: Profile News Message Board | |
| Charts:- Daily , Weekly | |
| Add TOWN to Watchlist: View: Get Complete TOWN Trend Analysis ➞ | |
 | WSFS WSFS Financial Corporation |
| Sector: Financials | |
| SubSector: Regional - Mid-Atlantic Banks | |
| MarketCap: 1191.29 Millions | |
| Recent Price: 54.60 Smart Investing & Trading Score: 51 | |
| Day Percent Change: 0.61% Day Change: 0.33 | |
| Week Change: 1.56% Year-to-date Change: 3.0% | |
| WSFS Links: Profile News Message Board | |
| Charts:- Daily , Weekly | |
| Add WSFS to Watchlist: View: Get Complete WSFS Trend Analysis ➞ | |
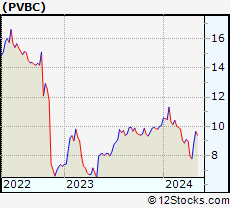 | PVBC Provident Bancorp, Inc. |
| Sector: Financials | |
| SubSector: Money Center Banks | |
| MarketCap: 168.599 Millions | |
| Recent Price: 12.24 Smart Investing & Trading Score: 51 | |
| Day Percent Change: 0.41% Day Change: 0.05 | |
| Week Change: 0.82% Year-to-date Change: 7.4% | |
| PVBC Links: Profile News Message Board | |
| Charts:- Daily , Weekly | |
| Add PVBC to Watchlist: View: Get Complete PVBC Trend Analysis ➞ | |
 | TRMK Trustmark Corporation |
| Sector: Financials | |
| SubSector: Regional - Southeast Banks | |
| MarketCap: 1630.15 Millions | |
| Recent Price: 37.01 Smart Investing & Trading Score: 51 | |
| Day Percent Change: 0.33% Day Change: 0.12 | |
| Week Change: 1.23% Year-to-date Change: 5.3% | |
| TRMK Links: Profile News Message Board | |
| Charts:- Daily , Weekly | |
| Add TRMK to Watchlist: View: Get Complete TRMK Trend Analysis ➞ | |
 | SHBI Shore Bancshares, Inc. |
| Sector: Financials | |
| SubSector: Regional - Mid-Atlantic Banks | |
| MarketCap: 131.359 Millions | |
| Recent Price: 15.45 Smart Investing & Trading Score: 51 | |
| Day Percent Change: 0.26% Day Change: 0.04 | |
| Week Change: 1.38% Year-to-date Change: -1.8% | |
| SHBI Links: Profile News Message Board | |
| Charts:- Daily , Weekly | |
| Add SHBI to Watchlist: View: Get Complete SHBI Trend Analysis ➞ | |
 | THFF First Financial Corporation |
| Sector: Financials | |
| SubSector: Regional - Midwest Banks | |
| MarketCap: 433.07 Millions | |
| Recent Price: 53.32 Smart Investing & Trading Score: 51 | |
| Day Percent Change: 0.17% Day Change: 0.09 | |
| Week Change: 1.68% Year-to-date Change: 18.0% | |
| THFF Links: Profile News Message Board | |
| Charts:- Daily , Weekly | |
| Add THFF to Watchlist: View: Get Complete THFF Trend Analysis ➞ | |
 | FHN First Horizon National Corporation |
| Sector: Financials | |
| SubSector: Regional - Southeast Banks | |
| MarketCap: 2661.05 Millions | |
| Recent Price: 21.68 Smart Investing & Trading Score: 51 | |
| Day Percent Change: 0.05% Day Change: 0.01 | |
| Week Change: 1.59% Year-to-date Change: 8.5% | |
| FHN Links: Profile News Message Board | |
| Charts:- Daily , Weekly | |
| Add FHN to Watchlist: View: Get Complete FHN Trend Analysis ➞ | |
 | SFBS ServisFirst Bancshares, Inc. |
| Sector: Financials | |
| SubSector: Foreign Money Center Banks | |
| MarketCap: 1596.71 Millions | |
| Recent Price: 78.30 Smart Investing & Trading Score: 51 | |
| Day Percent Change: 0.03% Day Change: 0.02 | |
| Week Change: 1.28% Year-to-date Change: -6.9% | |
| SFBS Links: Profile News Message Board | |
| Charts:- Daily , Weekly | |
| Add SFBS to Watchlist: View: Get Complete SFBS Trend Analysis ➞ | |
 | FRBA First Bank |
| Sector: Financials | |
| SubSector: Regional - Mid-Atlantic Banks | |
| MarketCap: 124.859 Millions | |
| Recent Price: 14.98 Smart Investing & Trading Score: 51 | |
| Day Percent Change: 0% Day Change: 0 | |
| Week Change: 2.32% Year-to-date Change: 6.9% | |
| FRBA Links: Profile News Message Board | |
| Charts:- Daily , Weekly | |
| Add FRBA to Watchlist: View: Get Complete FRBA Trend Analysis ➞ | |
 | RF Regions Financial Corporation |
| Sector: Financials | |
| SubSector: Regional - Southeast Banks | |
| MarketCap: 8936.25 Millions | |
| Recent Price: 25.18 Smart Investing & Trading Score: 51 | |
| Day Percent Change: 0% Day Change: 0 | |
| Week Change: 1.17% Year-to-date Change: 8.2% | |
| RF Links: Profile News Message Board | |
| Charts:- Daily , Weekly | |
| Add RF to Watchlist: View: Get Complete RF Trend Analysis ➞ | |
 | MTB M&T Bank Corporation |
| Sector: Financials | |
| SubSector: Regional - Northeast Banks | |
| MarketCap: 13950.9 Millions | |
| Recent Price: 188.04 Smart Investing & Trading Score: 51 | |
| Day Percent Change: -0.13% Day Change: -0.25 | |
| Week Change: 1.65% Year-to-date Change: 0.7% | |
| MTB Links: Profile News Message Board | |
| Charts:- Daily , Weekly | |
| Add MTB to Watchlist: View: Get Complete MTB Trend Analysis ➞ | |
 | PDLB PDL Community Bancorp |
| Sector: Financials | |
| SubSector: REIT - Retail | |
| MarketCap: 206.114 Millions | |
| Recent Price: 14.06 Smart Investing & Trading Score: 51 | |
| Day Percent Change: -0.42% Day Change: -0.06 | |
| Week Change: 1.08% Year-to-date Change: 8.2% | |
| PDLB Links: Profile News Message Board | |
| Charts:- Daily , Weekly | |
| Add PDLB to Watchlist: View: Get Complete PDLB Trend Analysis ➞ | |
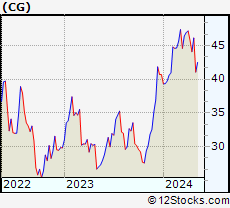 | CG The Carlyle Group Inc. |
| Sector: Financials | |
| SubSector: Asset Management | |
| MarketCap: 7269.33 Millions | |
| Recent Price: 60.10 Smart Investing & Trading Score: 51 | |
| Day Percent Change: -0.55% Day Change: -0.33 | |
| Week Change: 2.37% Year-to-date Change: 19.8% | |
| CG Links: Profile News Message Board | |
| Charts:- Daily , Weekly | |
| Add CG to Watchlist: View: Get Complete CG Trend Analysis ➞ | |
 | SEIC SEI Investments Company |
| Sector: Financials | |
| SubSector: Asset Management | |
| MarketCap: 6367.03 Millions | |
| Recent Price: 87.81 Smart Investing & Trading Score: 51 | |
| Day Percent Change: -0.6% Day Change: -0.53 | |
| Week Change: 1.57% Year-to-date Change: 6.5% | |
| SEIC Links: Profile News Message Board | |
| Charts:- Daily , Weekly | |
| Add SEIC to Watchlist: View: Get Complete SEIC Trend Analysis ➞ | |
 | SOFI SoFi Technologies, Inc. |
| Sector: Financials | |
| SubSector: Credit Services | |
| MarketCap: 7990 Millions | |
| Recent Price: 21.54 Smart Investing & Trading Score: 50 | |
| Day Percent Change: -1.24% Day Change: -0.27 | |
| Week Change: 1.46% Year-to-date Change: 39.9% | |
| SOFI Links: Profile News Message Board | |
| Charts:- Daily , Weekly | |
| Add SOFI to Watchlist: View: Get Complete SOFI Trend Analysis ➞ | |
 | KKR KKR & Co. Inc. |
| Sector: Financials | |
| SubSector: Asset Management | |
| MarketCap: 17722.5 Millions | |
| Recent Price: 142.66 Smart Investing & Trading Score: 50 | |
| Day Percent Change: -1.7% Day Change: -2.47 | |
| Week Change: 0.08% Year-to-date Change: -3.4% | |
| KKR Links: Profile News Message Board | |
| Charts:- Daily , Weekly | |
| Add KKR to Watchlist: View: Get Complete KKR Trend Analysis ➞ | |
 | GEO The GEO Group, Inc. |
| Sector: Financials | |
| SubSector: REIT - Healthcare Facilities | |
| MarketCap: 1678.34 Millions | |
| Recent Price: 25.84 Smart Investing & Trading Score: 50 | |
| Day Percent Change: 3.78% Day Change: 0.94 | |
| Week Change: 3.36% Year-to-date Change: -7.7% | |
| GEO Links: Profile News Message Board | |
| Charts:- Daily , Weekly | |
| Add GEO to Watchlist: View: Get Complete GEO Trend Analysis ➞ | |
| For tabular summary view of above stock list: Summary View ➞ 0 - 25 , 25 - 50 , 50 - 75 , 75 - 100 , 100 - 125 , 125 - 150 , 150 - 175 , 175 - 200 , 200 - 225 , 225 - 250 , 250 - 275 , 275 - 300 , 300 - 325 , 325 - 350 , 350 - 375 , 375 - 400 , 400 - 425 , 425 - 450 , 450 - 475 , 475 - 500 , 500 - 525 , 525 - 550 , 550 - 575 | ||
| Click To Change The Sort Order: By Market Cap or Company Size Performance: Year-to-date, Week and Day | |
| Select Chart Type: | ||
|
Best Stocks Today 12Stocks.com |
© 2025 12Stocks.com Terms & Conditions Privacy Contact Us
All Information Provided Only For Education And Not To Be Used For Investing or Trading. See Terms & Conditions


One More Thing ... Get Best Stocks Delivered Daily!
Never Ever Miss A Move With Our Top Ten Stocks Lists
Find Best Stocks In Any Market - Bull or Bear Market
Take A Peek At Our Top Ten Stocks Lists: Daily, Weekly, Year-to-Date & Top Trends
Find Best Stocks In Any Market - Bull or Bear Market
Take A Peek At Our Top Ten Stocks Lists: Daily, Weekly, Year-to-Date & Top Trends
Financial Stocks With Best Up Trends [0-bearish to 100-bullish]: Lemonade [100], MBIA [100], AlTi Global[100], Cushman & Wakefield[100], LGI Homes[100], Rocket [100], Tanger Factory[100], Mr. Cooper[100], CBL & Associates Properties[100], Hamilton Lane[100], Simon Property[100]
Best Financial Stocks Year-to-Date:
ESSA Bancorp[3207.77%], Easterly Government[107.23%], Mr. Cooper[97.21%], Heritage Insurance[79.01%], Root [72.94%], Industrial Logistics[70.13%], Rocket [69.21%], Diversified Healthcare[50.49%], ProAssurance [49.72%], World Acceptance[41.78%], XP [41.43%] Best Financial Stocks This Week:
Uniti [47.66%], Lemonade [31.68%], AlTi Global[24.1%], MBIA [20.54%], Industrial Logistics[14.9%], Cushman & Wakefield[12.24%], Tanger Factory[9.38%], Hippo [9.07%], Rocket [9.01%], LGI Homes[8.92%], eXp World[8.81%] Best Financial Stocks Daily:
Lemonade [29.54%], MBIA [22.5%], AlTi Global[18.05%], Cushman & Wakefield[8.69%], LGI Homes[8.6%], Rocket [6.81%], Alexander s[6.14%], Tanger Factory[5.97%], Brookfield Business[5.91%], Mr. Cooper[5.69%], B. Riley[5.38%]