
 Login Sign Up


| |||||
 |  | ||||

| 12Stocks.com Market Intelligence |
Best Financial Stocks
| In a hurry? Financial Stocks Lists: Performance Trends Table, Stock Charts
Sort Financial stocks: Daily, Weekly, Year-to-Date, Market Cap & Trends. Filter Financial stocks list by size:All Financial Large Mid-Range Small & MicroCap |
| 12Stocks.com Financial Stocks Performances & Trends Daily | |||||||||
|
|  The overall Smart Investing & Trading Score is 33 (0-bearish to 100-bullish) which puts Financial sector in short term bearish to neutral trend. The Smart Investing & Trading Score from previous trading session is 26 and an improvement of trend continues.
| ||||||||
Here are the Smart Investing & Trading Scores of the most requested Financial stocks at 12Stocks.com (click stock name for detailed review):
|


| 12Stocks.com: Investing in Financial sector with Stocks | |
|
The following table helps investors and traders sort through current performance and trends (as measured by Smart Investing & Trading Score) of various
stocks in the Financial sector. Quick View: Move mouse or cursor over stock symbol (ticker) to view short-term Technical chart and over stock name to view long term chart. Click on  to add stock symbol to your watchlist and to add stock symbol to your watchlist and  to view watchlist. Click on any ticker or stock name for detailed market intelligence report for that stock. to view watchlist. Click on any ticker or stock name for detailed market intelligence report for that stock. |
12Stocks.com Performance of Stocks in Financial Sector
| Ticker | Stock Name | Watchlist | Category | Recent Price | Trend Score | Change % | YTD Change% |
| HOPE | Hope Bancorp |   | Regional Banks | 10.08 | 55 | 1.41% | -17.00% |
| DHIL | Diamond Hill | | Asset Mgmt | 141.57 | 55 | 0.63% | -7.82% |
| FFWM | First Foundation | | Regional Banks | 5.09 | 54 | -0.20% | -18.04% |
| HONE | HarborOne Bancorp | | S&L | 11.77 | 54 | 0.43% | 0.46% |
| PAX | Patria s | | Asset Mgmt | 13.84 | 54 | 0.29% | 20.54% |
| FNLC | First Bancorp | | Regional Banks | 25.06 | 54 | 0.00% | -5.73% |
| RLJ | RLJ Lodging | | REIT | 7.40 | 53 | 1.79% | -26.14% |
| OZK | Bank OZK | | Regional Banks | 48.69 | 53 | 1.50% | 11.70% |
| INN | Summit Hotel | | Real Estatet | 5.11 | 53 | 0.99% | -24.48% |
| FNB | F.N.B | | Regional Banks | 15.09 | 53 | 0.60% | 2.93% |
| AMTB | Amerant Bancorp | | Regional Banks | 19.04 | 53 | 0.53% | -14.71% |
| VOYA | Voya | | Asset Mgmt | 67.95 | 53 | 0.13% | -0.65% |
| ISTR | Investar Holding | | Regional - Southwest Banks | 21.52 | 53 | -0.25% | -1.42% |
| VRTS | Virtus | | Asset Mgmt | 191.06 | 53 | -0.29% | -13.38% |
| CHMG | Chemung | | Regional Banks | 49.85 | 53 | -0.34% | 2.80% |
| PEB | Pebblebrook Hotel | | REIT | 9.86 | 53 | -0.40% | -27.16% |
| ALLY | Ally | | Mortgage | 37.24 | 53 | -0.53% | 4.20% |
| SCHW | Charles Schwab | | Brokerage | 96.44 | 53 | -0.68% | 30.74% |
| FRT | Federal Realty | | REIT - Retail | 93.39 | 52 | 2.02% | -14.79% |
| THG | Hanover Insurance | | Insurance | 171.18 | 52 | -0.12% | 11.28% |
| SFST | Southern First | | Banks | 41.00 | 51 | 0.17% | 3.14% |
| KW | Kennedy-Wilson | | Property Mgmt | 7.34 | 51 | -0.68% | -25.49% |
| CIM | Chimera | | Mortgage | 13.57 | 51 | -0.73% | -0.25% |
| APO | Apollo Global | | Investments | 145.54 | 51 | 2.48% | -11.63% |
| DEI | Douglas Emmett | | REIT - | 15.12 | 51 | 2.02% | -17.56% |
| For chart view version of above stock list: Chart View ➞ 0 - 25 , 25 - 50 , 50 - 75 , 75 - 100 , 100 - 125 , 125 - 150 , 150 - 175 , 175 - 200 , 200 - 225 , 225 - 250 , 250 - 275 , 275 - 300 , 300 - 325 , 325 - 350 , 350 - 375 , 375 - 400 , 400 - 425 , 425 - 450 , 450 - 475 , 475 - 500 , 500 - 525 , 525 - 550 , 550 - 575 | ||
 | Click To Change The Sort Order: By Market Cap or Company Size Performance: Year-to-date, Week and Day |  |
|
Get the most comprehensive stock market coverage daily at 12Stocks.com ➞ Best Stocks Today ➞ Best Stocks Weekly ➞ Best Stocks Year-to-Date ➞ Best Stocks Trends ➞  Best Stocks Today 12Stocks.com Best Nasdaq Stocks ➞ Best S&P 500 Stocks ➞ Best Tech Stocks ➞ Best Biotech Stocks ➞ |
| Detailed Overview of Financial Stocks |
| Financial Technical Overview, Leaders & Laggards, Top Financial ETF Funds & Detailed Financial Stocks List, Charts, Trends & More |
| Financial Sector: Technical Analysis, Trends & YTD Performance | |
| Financial sector is composed of stocks
from banks, brokers, insurance, REITs
and services subsectors. Financial sector, as represented by XLF, an exchange-traded fund [ETF] that holds basket of Financial stocks (e.g, Bank of America, Goldman Sachs) is up by 7.36% and is currently outperforming the overall market by 0.31% year-to-date. Below is a quick view of Technical charts and trends: |
|
 XLF Weekly Chart |
|
| Long Term Trend: Good | |
| Medium Term Trend: Not Good | |
 XLF Daily Chart |
|
| Short Term Trend: Not Good | |
| Overall Trend Score: 33 | |
| YTD Performance: 7.36% | |
| **Trend Scores & Views Are Only For Educational Purposes And Not For Investing | |
| 12Stocks.com: Top Performing Financial Sector Stocks | ||||||||||||||||||||||||||||||||||||||||||||||||
 The top performing Financial sector stocks year to date are
Now, more recently, over last week, the top performing Financial sector stocks on the move are


|
||||||||||||||||||||||||||||||||||||||||||||||||
| 12Stocks.com: Investing in Financial Sector using Exchange Traded Funds | |
|
The following table shows list of key exchange traded funds (ETF) that
help investors track Financial Index. For detailed view, check out our ETF Funds section of our website. Quick View: Move mouse or cursor over ETF symbol (ticker) to view short-term Technical chart and over ETF name to view long term chart. Click on ticker or stock name for detailed view. Click on to add stock symbol to your watchlist and to view watchlist. |
12Stocks.com List of ETFs that track Financial Index
| Ticker | ETF Name | Watchlist | Recent Price | Smart Investing & Trading Score | Change % | Week % | Year-to-date % |
| XLF | Financial | | 51.70 | 33 | -0.4 | 0.58 | 7.36% |
| IAI | Broker-Dealers & Secs | | 173.45 | 53 | -0.87 | 1.45 | 20.77% |
| KBE | Bank | | 56.27 | 51 | 0.52 | 1.83 | 2.16% |
| FAS | Financial Bull 3X | | 159.77 | 33 | -1.27 | 1.61 | 6.12% |
| FAZ | Financial Bear 3X | | 4.60 | 62 | 1.32 | -1.5 | -26.44% |
| UYG | Financials | | 92.14 | 26 | -0.79 | 0.92 | 8.14% |
| KIE | Insurance | | 56.82 | 35 | 0.71 | 1.99 | 1.03% |
| 12Stocks.com: Charts, Trends, Fundamental Data and Performances of Financial Stocks | |
|
We now take in-depth look at all Financial stocks including charts, multi-period performances and overall trends (as measured by Smart Investing & Trading Score). One can sort Financial stocks (click link to choose) by Daily, Weekly and by Year-to-Date performances. Also, one can sort by size of the company or by market capitalization. |
| Select Your Default Chart Type: | |||||
| |||||
| Click on stock symbol or name for detailed view. Click on to add stock symbol to your watchlist and to view watchlist. Quick View: Move mouse or cursor over "Daily" to quickly view daily Technical stock chart and over "Weekly" to view weekly Technical stock chart. | |||||

 | HOPE Hope Bancorp, Inc. |
| Sector: Financials | |
| SubSector: Regional - Pacific Banks | |
| MarketCap: 1099.29 Millions | |
| Recent Price: 10.08 Smart Investing & Trading Score: 55 | |
| Day Percent Change: 1.41% Day Change: 0.14 | |
| Week Change: 3.81% Year-to-date Change: -17.0% | |
| HOPE Links: Profile News Message Board | |
| Charts:- Daily , Weekly | |
| Add HOPE to Watchlist: View: Get Complete HOPE Trend Analysis ➞ | |
 | DHIL Diamond Hill Investment Group, Inc. |
| Sector: Financials | |
| SubSector: Asset Management | |
| MarketCap: 316.203 Millions | |
| Recent Price: 141.57 Smart Investing & Trading Score: 55 | |
| Day Percent Change: 0.63% Day Change: 0.88 | |
| Week Change: 6.12% Year-to-date Change: -7.8% | |
| DHIL Links: Profile News Message Board | |
| Charts:- Daily , Weekly | |
| Add DHIL to Watchlist: View: Get Complete DHIL Trend Analysis ➞ | |
 | FFWM First Foundation Inc. |
| Sector: Financials | |
| SubSector: Regional - Midwest Banks | |
| MarketCap: 457.17 Millions | |
| Recent Price: 5.09 Smart Investing & Trading Score: 54 | |
| Day Percent Change: -0.2% Day Change: -0.01 | |
| Week Change: 6.49% Year-to-date Change: -18.0% | |
| FFWM Links: Profile News Message Board | |
| Charts:- Daily , Weekly | |
| Add FFWM to Watchlist: View: Get Complete FFWM Trend Analysis ➞ | |
 | HONE HarborOne Bancorp, Inc. |
| Sector: Financials | |
| SubSector: Savings & Loans | |
| MarketCap: 456.03 Millions | |
| Recent Price: 11.77 Smart Investing & Trading Score: 54 | |
| Day Percent Change: 0.43% Day Change: 0.05 | |
| Week Change: 1.38% Year-to-date Change: 0.5% | |
| HONE Links: Profile News Message Board | |
| Charts:- Daily , Weekly | |
| Add HONE to Watchlist: View: Get Complete HONE Trend Analysis ➞ | |
 | PAX Patria Investments Limited |
| Sector: Financials | |
| SubSector: Asset Management | |
| MarketCap: 2130 Millions | |
| Recent Price: 13.84 Smart Investing & Trading Score: 54 | |
| Day Percent Change: 0.29% Day Change: 0.04 | |
| Week Change: 3.75% Year-to-date Change: 20.5% | |
| PAX Links: Profile News Message Board | |
| Charts:- Daily , Weekly | |
| Add PAX to Watchlist: View: Get Complete PAX Trend Analysis ➞ | |
 | FNLC The First Bancorp, Inc. |
| Sector: Financials | |
| SubSector: Regional - Northeast Banks | |
| MarketCap: 264.799 Millions | |
| Recent Price: 25.06 Smart Investing & Trading Score: 54 | |
| Day Percent Change: 0% Day Change: 0 | |
| Week Change: 1.13% Year-to-date Change: -5.7% | |
| FNLC Links: Profile News Message Board | |
| Charts:- Daily , Weekly | |
| Add FNLC to Watchlist: View: Get Complete FNLC Trend Analysis ➞ | |
 | RLJ RLJ Lodging Trust |
| Sector: Financials | |
| SubSector: REIT - Hotel/Motel | |
| MarketCap: 1019.34 Millions | |
| Recent Price: 7.40 Smart Investing & Trading Score: 53 | |
| Day Percent Change: 1.79% Day Change: 0.13 | |
| Week Change: 2.49% Year-to-date Change: -26.1% | |
| RLJ Links: Profile News Message Board | |
| Charts:- Daily , Weekly | |
| Add RLJ to Watchlist: View: Get Complete RLJ Trend Analysis ➞ | |
 | OZK Bank OZK |
| Sector: Financials | |
| SubSector: Regional - Southeast Banks | |
| MarketCap: 2518.35 Millions | |
| Recent Price: 48.69 Smart Investing & Trading Score: 53 | |
| Day Percent Change: 1.5% Day Change: 0.72 | |
| Week Change: 1.82% Year-to-date Change: 11.7% | |
| OZK Links: Profile News Message Board | |
| Charts:- Daily , Weekly | |
| Add OZK to Watchlist: View: Get Complete OZK Trend Analysis ➞ | |
 | INN Summit Hotel Properties, Inc. |
| Sector: Financials | |
| SubSector: Real Estate Development | |
| MarketCap: 402.019 Millions | |
| Recent Price: 5.11 Smart Investing & Trading Score: 53 | |
| Day Percent Change: 0.99% Day Change: 0.05 | |
| Week Change: 1.59% Year-to-date Change: -24.5% | |
| INN Links: Profile News Message Board | |
| Charts:- Daily , Weekly | |
| Add INN to Watchlist: View: Get Complete INN Trend Analysis ➞ | |
 | FNB F.N.B. Corporation |
| Sector: Financials | |
| SubSector: Regional - Southeast Banks | |
| MarketCap: 2445.55 Millions | |
| Recent Price: 15.09 Smart Investing & Trading Score: 53 | |
| Day Percent Change: 0.6% Day Change: 0.09 | |
| Week Change: 1.55% Year-to-date Change: 2.9% | |
| FNB Links: Profile News Message Board | |
| Charts:- Daily , Weekly | |
| Add FNB to Watchlist: View: Get Complete FNB Trend Analysis ➞ | |
 | AMTB Amerant Bancorp Inc. |
| Sector: Financials | |
| SubSector: Regional - Midwest Banks | |
| MarketCap: 653.87 Millions | |
| Recent Price: 19.04 Smart Investing & Trading Score: 53 | |
| Day Percent Change: 0.53% Day Change: 0.1 | |
| Week Change: 2.31% Year-to-date Change: -14.7% | |
| AMTB Links: Profile News Message Board | |
| Charts:- Daily , Weekly | |
| Add AMTB to Watchlist: View: Get Complete AMTB Trend Analysis ➞ | |
 | VOYA Voya Financial, Inc. |
| Sector: Financials | |
| SubSector: Asset Management | |
| MarketCap: 4771.23 Millions | |
| Recent Price: 67.95 Smart Investing & Trading Score: 53 | |
| Day Percent Change: 0.13% Day Change: 0.09 | |
| Week Change: 0.95% Year-to-date Change: -0.7% | |
| VOYA Links: Profile News Message Board | |
| Charts:- Daily , Weekly | |
| Add VOYA to Watchlist: View: Get Complete VOYA Trend Analysis ➞ | |
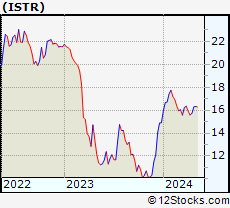 | ISTR Investar Holding Corporation |
| Sector: Financials | |
| SubSector: Regional - Southwest Banks | |
| MarketCap: 136.565 Millions | |
| Recent Price: 21.52 Smart Investing & Trading Score: 53 | |
| Day Percent Change: -0.25% Day Change: -0.05 | |
| Week Change: 1.18% Year-to-date Change: -1.4% | |
| ISTR Links: Profile News Message Board | |
| Charts:- Daily , Weekly | |
| Add ISTR to Watchlist: View: Get Complete ISTR Trend Analysis ➞ | |
 | VRTS Virtus Investment Partners, Inc. |
| Sector: Financials | |
| SubSector: Asset Management | |
| MarketCap: 601.303 Millions | |
| Recent Price: 191.06 Smart Investing & Trading Score: 53 | |
| Day Percent Change: -0.29% Day Change: -0.56 | |
| Week Change: 0.74% Year-to-date Change: -13.4% | |
| VRTS Links: Profile News Message Board | |
| Charts:- Daily , Weekly | |
| Add VRTS to Watchlist: View: Get Complete VRTS Trend Analysis ➞ | |
 | CHMG Chemung Financial Corporation |
| Sector: Financials | |
| SubSector: Regional - Pacific Banks | |
| MarketCap: 142.229 Millions | |
| Recent Price: 49.85 Smart Investing & Trading Score: 53 | |
| Day Percent Change: -0.34% Day Change: -0.17 | |
| Week Change: 1.44% Year-to-date Change: 2.8% | |
| CHMG Links: Profile News Message Board | |
| Charts:- Daily , Weekly | |
| Add CHMG to Watchlist: View: Get Complete CHMG Trend Analysis ➞ | |
 | PEB Pebblebrook Hotel Trust |
| Sector: Financials | |
| SubSector: REIT - Hotel/Motel | |
| MarketCap: 1472.84 Millions | |
| Recent Price: 9.86 Smart Investing & Trading Score: 53 | |
| Day Percent Change: -0.4% Day Change: -0.04 | |
| Week Change: 1.65% Year-to-date Change: -27.2% | |
| PEB Links: Profile News Message Board | |
| Charts:- Daily , Weekly | |
| Add PEB to Watchlist: View: Get Complete PEB Trend Analysis ➞ | |
 | ALLY Ally Financial Inc. |
| Sector: Financials | |
| SubSector: Mortgage Investment | |
| MarketCap: 4643.99 Millions | |
| Recent Price: 37.24 Smart Investing & Trading Score: 53 | |
| Day Percent Change: -0.53% Day Change: -0.2 | |
| Week Change: 0.57% Year-to-date Change: 4.2% | |
| ALLY Links: Profile News Message Board | |
| Charts:- Daily , Weekly | |
| Add ALLY to Watchlist: View: Get Complete ALLY Trend Analysis ➞ | |
 | SCHW The Charles Schwab Corporation |
| Sector: Financials | |
| SubSector: Investment Brokerage - National | |
| MarketCap: 45115.8 Millions | |
| Recent Price: 96.44 Smart Investing & Trading Score: 53 | |
| Day Percent Change: -0.68% Day Change: -0.66 | |
| Week Change: 0.95% Year-to-date Change: 30.7% | |
| SCHW Links: Profile News Message Board | |
| Charts:- Daily , Weekly | |
| Add SCHW to Watchlist: View: Get Complete SCHW Trend Analysis ➞ | |
 | FRT Federal Realty Investment Trust |
| Sector: Financials | |
| SubSector: REIT - Retail | |
| MarketCap: 5878.64 Millions | |
| Recent Price: 93.39 Smart Investing & Trading Score: 52 | |
| Day Percent Change: 2.02% Day Change: 1.85 | |
| Week Change: 3.07% Year-to-date Change: -14.8% | |
| FRT Links: Profile News Message Board | |
| Charts:- Daily , Weekly | |
| Add FRT to Watchlist: View: Get Complete FRT Trend Analysis ➞ | |
 | THG The Hanover Insurance Group, Inc. |
| Sector: Financials | |
| SubSector: Property & Casualty Insurance | |
| MarketCap: 3677.92 Millions | |
| Recent Price: 171.18 Smart Investing & Trading Score: 52 | |
| Day Percent Change: -0.12% Day Change: -0.21 | |
| Week Change: 1.39% Year-to-date Change: 11.3% | |
| THG Links: Profile News Message Board | |
| Charts:- Daily , Weekly | |
| Add THG to Watchlist: View: Get Complete THG Trend Analysis ➞ | |
 | SFST Southern First Bancshares, Inc. |
| Sector: Financials | |
| SubSector: Money Center Banks | |
| MarketCap: 189.099 Millions | |
| Recent Price: 41.00 Smart Investing & Trading Score: 51 | |
| Day Percent Change: 0.17% Day Change: 0.07 | |
| Week Change: 1.26% Year-to-date Change: 3.1% | |
| SFST Links: Profile News Message Board | |
| Charts:- Daily , Weekly | |
| Add SFST to Watchlist: View: Get Complete SFST Trend Analysis ➞ | |
 | KW Kennedy-Wilson Holdings, Inc. |
| Sector: Financials | |
| SubSector: Property Management | |
| MarketCap: 2025.42 Millions | |
| Recent Price: 7.34 Smart Investing & Trading Score: 51 | |
| Day Percent Change: -0.68% Day Change: -0.05 | |
| Week Change: 1.38% Year-to-date Change: -25.5% | |
| KW Links: Profile News Message Board | |
| Charts:- Daily , Weekly | |
| Add KW to Watchlist: View: Get Complete KW Trend Analysis ➞ | |
 | CIM Chimera Investment Corporation |
| Sector: Financials | |
| SubSector: Mortgage Investment | |
| MarketCap: 2164.09 Millions | |
| Recent Price: 13.57 Smart Investing & Trading Score: 51 | |
| Day Percent Change: -0.73% Day Change: -0.1 | |
| Week Change: 0.97% Year-to-date Change: -0.3% | |
| CIM Links: Profile News Message Board | |
| Charts:- Daily , Weekly | |
| Add CIM to Watchlist: View: Get Complete CIM Trend Analysis ➞ | |
 | APO Apollo Global Management, Inc. |
| Sector: Financials | |
| SubSector: Diversified Investments | |
| MarketCap: 12706 Millions | |
| Recent Price: 145.54 Smart Investing & Trading Score: 51 | |
| Day Percent Change: 2.48% Day Change: 3.52 | |
| Week Change: 5.24% Year-to-date Change: -11.6% | |
| APO Links: Profile News Message Board | |
| Charts:- Daily , Weekly | |
| Add APO to Watchlist: View: Get Complete APO Trend Analysis ➞ | |
 | DEI Douglas Emmett, Inc. |
| Sector: Financials | |
| SubSector: REIT - Diversified | |
| MarketCap: 4917.83 Millions | |
| Recent Price: 15.12 Smart Investing & Trading Score: 51 | |
| Day Percent Change: 2.02% Day Change: 0.3 | |
| Week Change: 1.41% Year-to-date Change: -17.6% | |
| DEI Links: Profile News Message Board | |
| Charts:- Daily , Weekly | |
| Add DEI to Watchlist: View: Get Complete DEI Trend Analysis ➞ | |
| For tabular summary view of above stock list: Summary View ➞ 0 - 25 , 25 - 50 , 50 - 75 , 75 - 100 , 100 - 125 , 125 - 150 , 150 - 175 , 175 - 200 , 200 - 225 , 225 - 250 , 250 - 275 , 275 - 300 , 300 - 325 , 325 - 350 , 350 - 375 , 375 - 400 , 400 - 425 , 425 - 450 , 450 - 475 , 475 - 500 , 500 - 525 , 525 - 550 , 550 - 575 | ||
| Click To Change The Sort Order: By Market Cap or Company Size Performance: Year-to-date, Week and Day | |
| Select Chart Type: | ||
|
Best Stocks Today 12Stocks.com |
© 2025 12Stocks.com Terms & Conditions Privacy Contact Us
All Information Provided Only For Education And Not To Be Used For Investing or Trading. See Terms & Conditions


One More Thing ... Get Best Stocks Delivered Daily!
Never Ever Miss A Move With Our Top Ten Stocks Lists
Find Best Stocks In Any Market - Bull or Bear Market
Take A Peek At Our Top Ten Stocks Lists: Daily, Weekly, Year-to-Date & Top Trends
Find Best Stocks In Any Market - Bull or Bear Market
Take A Peek At Our Top Ten Stocks Lists: Daily, Weekly, Year-to-Date & Top Trends
Financial Stocks With Best Up Trends [0-bearish to 100-bullish]: Lemonade [100], MBIA [100], AlTi Global[100], Cushman & Wakefield[100], LGI Homes[100], Rocket [100], Tanger Factory[100], Mr. Cooper[100], CBL & Associates Properties[100], Hamilton Lane[100], Simon Property[100]
Best Financial Stocks Year-to-Date:
ESSA Bancorp[3207.77%], Easterly Government[107.23%], Mr. Cooper[97.21%], Heritage Insurance[79.01%], Root [72.94%], Industrial Logistics[70.13%], Rocket [69.21%], Diversified Healthcare[50.49%], ProAssurance [49.72%], World Acceptance[41.78%], XP [41.43%] Best Financial Stocks This Week:
Uniti [47.66%], Lemonade [31.68%], AlTi Global[24.1%], MBIA [20.54%], Industrial Logistics[14.9%], Cushman & Wakefield[12.24%], Tanger Factory[9.38%], Hippo [9.07%], Rocket [9.01%], LGI Homes[8.92%], eXp World[8.81%] Best Financial Stocks Daily:
Lemonade [29.54%], MBIA [22.5%], AlTi Global[18.05%], Cushman & Wakefield[8.69%], LGI Homes[8.6%], Rocket [6.81%], Alexander s[6.14%], Tanger Factory[5.97%], Brookfield Business[5.91%], Mr. Cooper[5.69%], B. Riley[5.38%]